The figure shows the plot of PVnT vs P, for oxygen gas at two different temperatures then
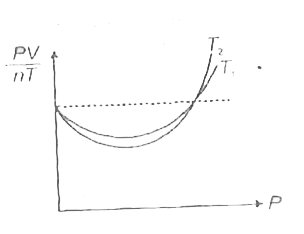
T1>T2
T2>T1
T1=T2
may be (1) & (2)
The correct Answer is:A
Step by step video & image solution for The figure shows the plot of (PV)/(nT) vs P, for oxygen gas at two different temperatures then by Physics experts to help you in doubts & scoring excellent marks in Class 12 exams.
Updated on:21/07/2023Topper's Solved these Questions
- KINETIC THEORYBOOK - AAKASH INSTITUTE ENGLISHCHAPTER - KINETIC THEORYEXERCISE - EXERCISE (ASSIGNMENT) SECTION - A Objective Type Questions
30 Videos
- KINETIC THEORYBOOK - AAKASH INSTITUTE ENGLISHCHAPTER - KINETIC THEORYEXERCISE - EXERCISE (ASSIGNMENT) SECTION - B Objective Type Questions
30 Videos
- KINETIC THEORYBOOK - AAKASH INSTITUTE ENGLISHCHAPTER - KINETIC THEORYEXERCISE - EXERCISE (TRY YOURSELF)
40 Videos
- GRAVITATION BOOK - AAKASH INSTITUTE ENGLISHCHAPTER - GRAVITATION EXERCISE - ASSIGNMENT SECTION - D (ASSERTION-REASON TYPE QUESTIONS)
15 Videos
- LAWS OF MOTIONBOOK - AAKASH INSTITUTE ENGLISHCHAPTER - LAWS OF MOTIONEXERCISE - Assignment (SECTION-D) (Assertion-Reason Type Questions)
15 Videos
Similar Questions
Figure shows plot of PV/T versus Pfor1.00×10−3 kg of oxygen gas at two different temperatures.
(i) What does the dotted plot signify?
(ii) Which is true . T1>T2orT1<T2?
(iii) What is the value of PV/T where the curves meet on the y-axis?_E01_262_Q01.png)
View SolutionFigure shows graph between stress and strain for a uniform wire at two different temperatures. Then

View Solution
Knowledge Check
Given is the graph between PVT and P for 1 gm of oxygen gas at two different temperatures T1andT2 Fig. Given, density of oxygen =1.427kgm−3. The value of (PV)/(T) at the point A and the relation between T1andT2 are respectively :
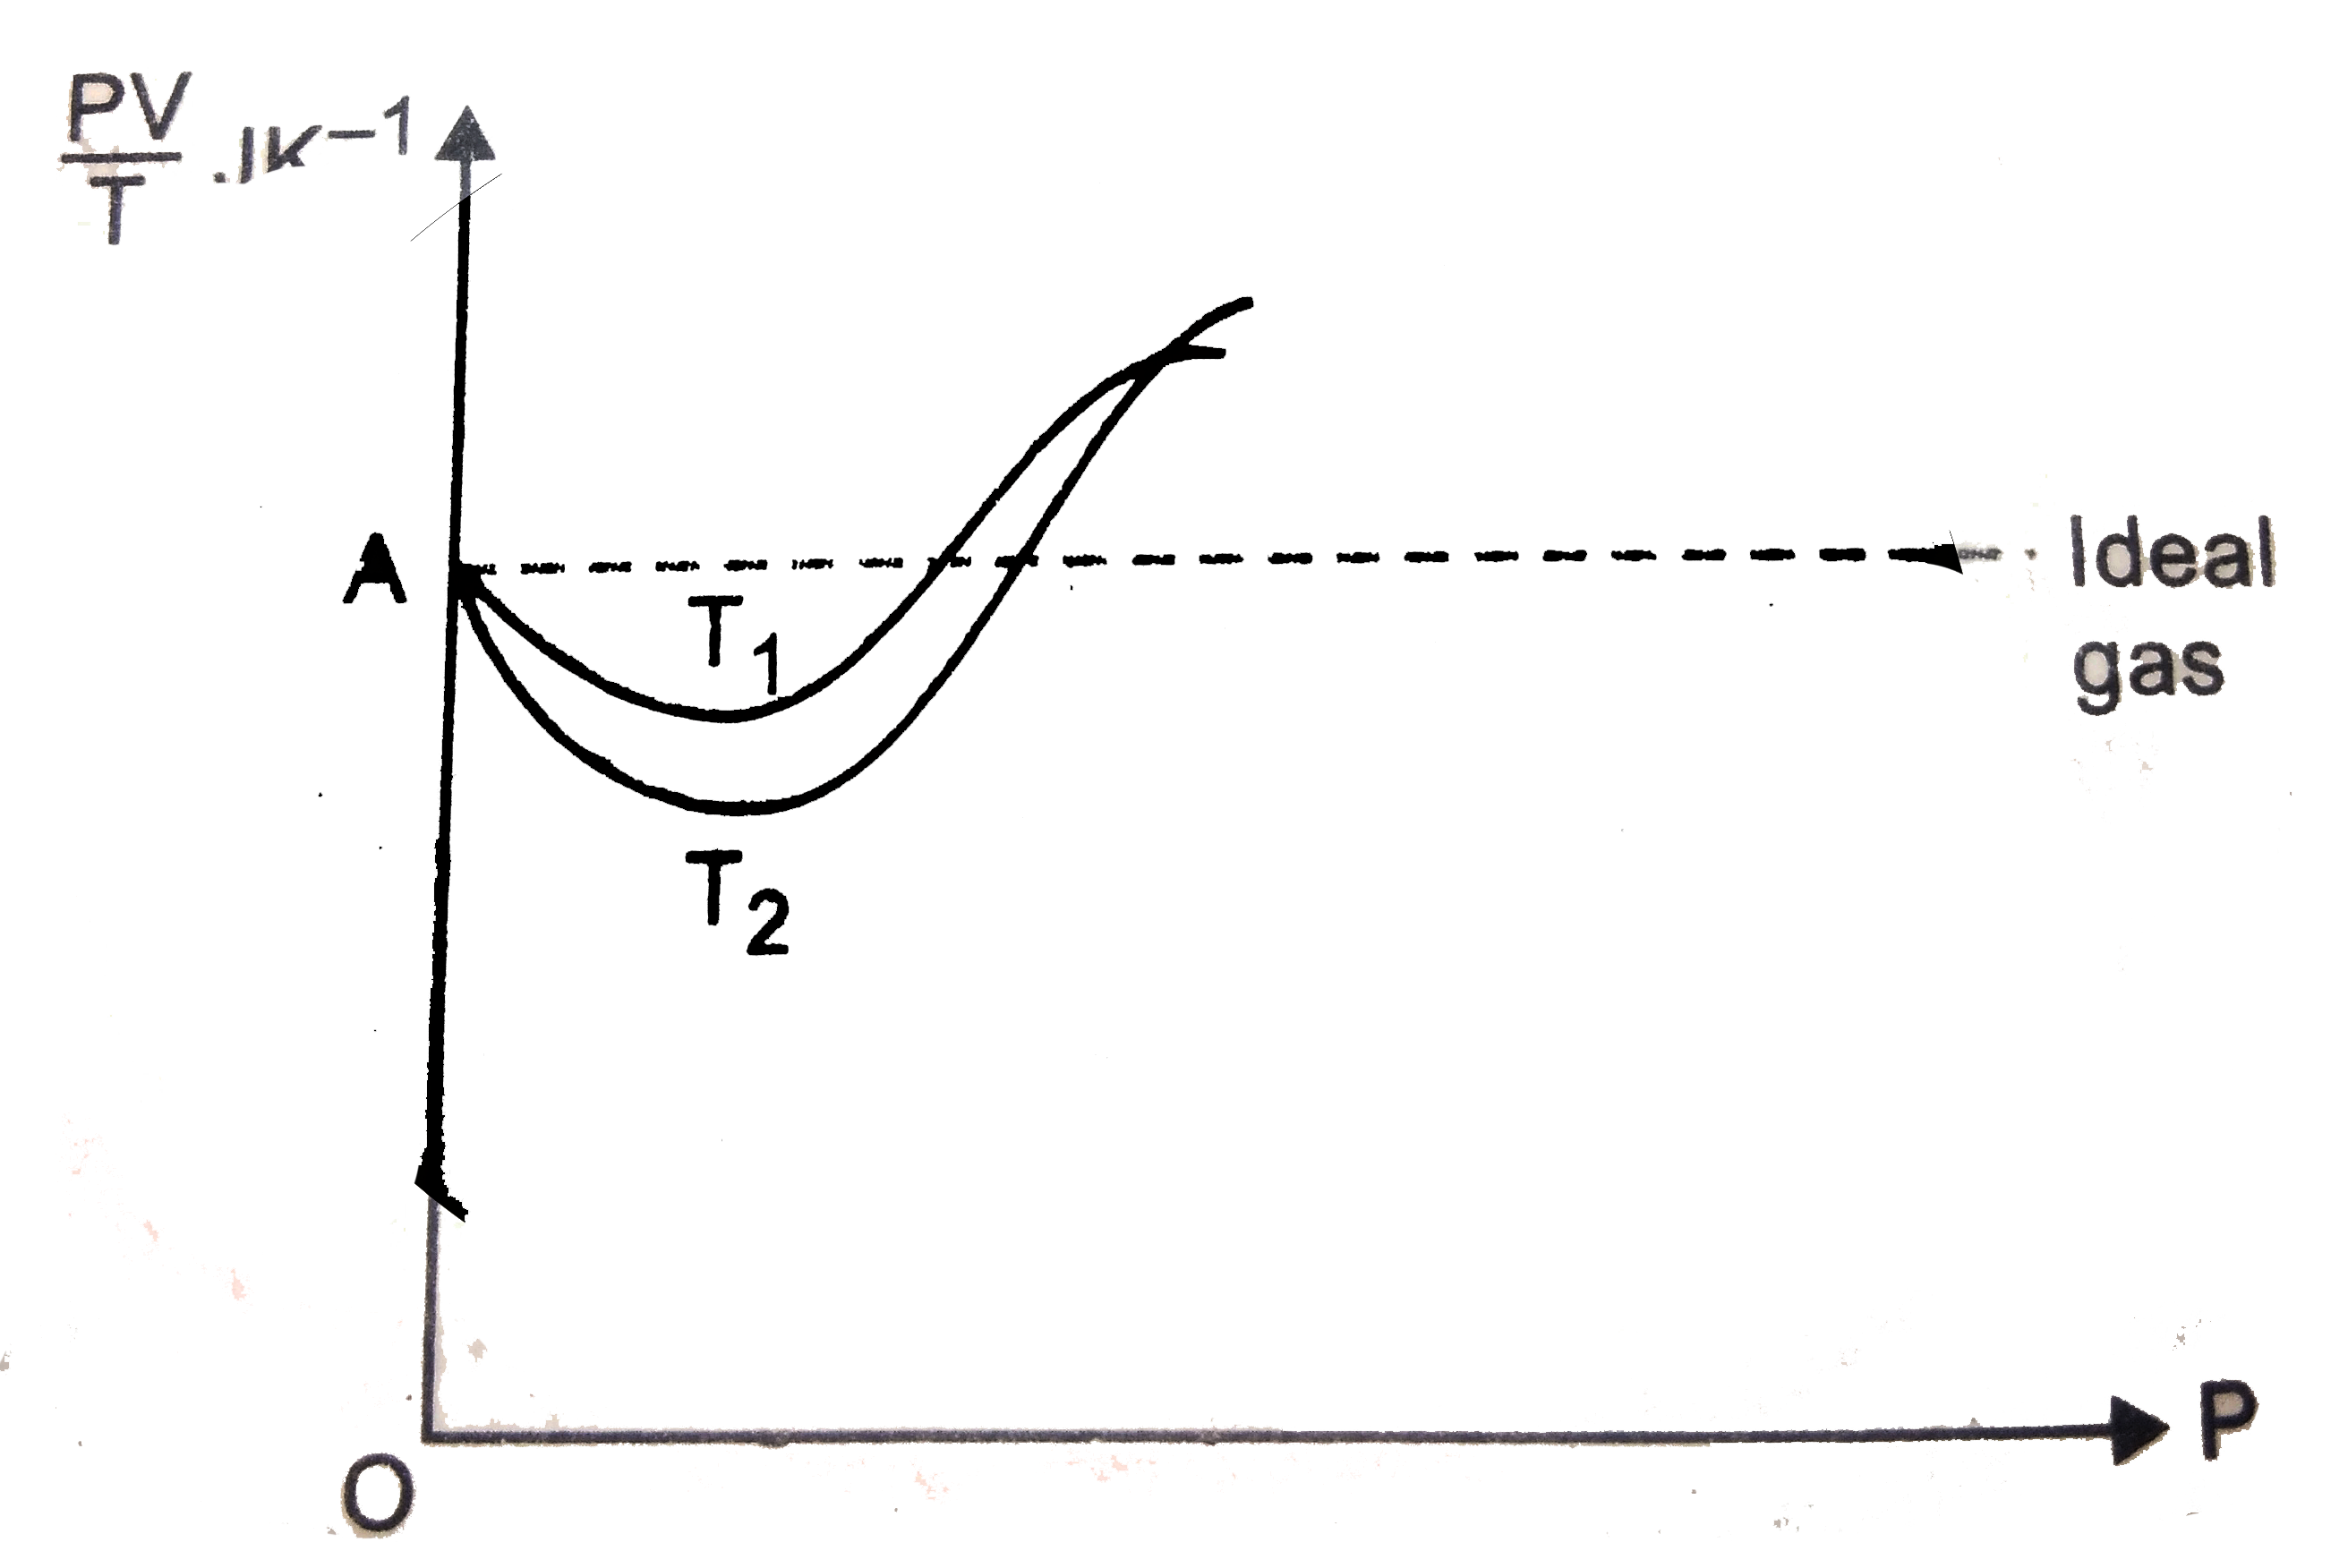 A0.259JK−1andT1<T2B8.314gJmol−1K−1andT1>T2C0.259JK−1andT1>T2D4.28gJK−1andT1<T2
The graph of PV vs P for a gas is
AparabolicBhyperbolicCa straight line parallel to X-axisDa straight line passing through origin
The graph of P vs V is given at different temperature
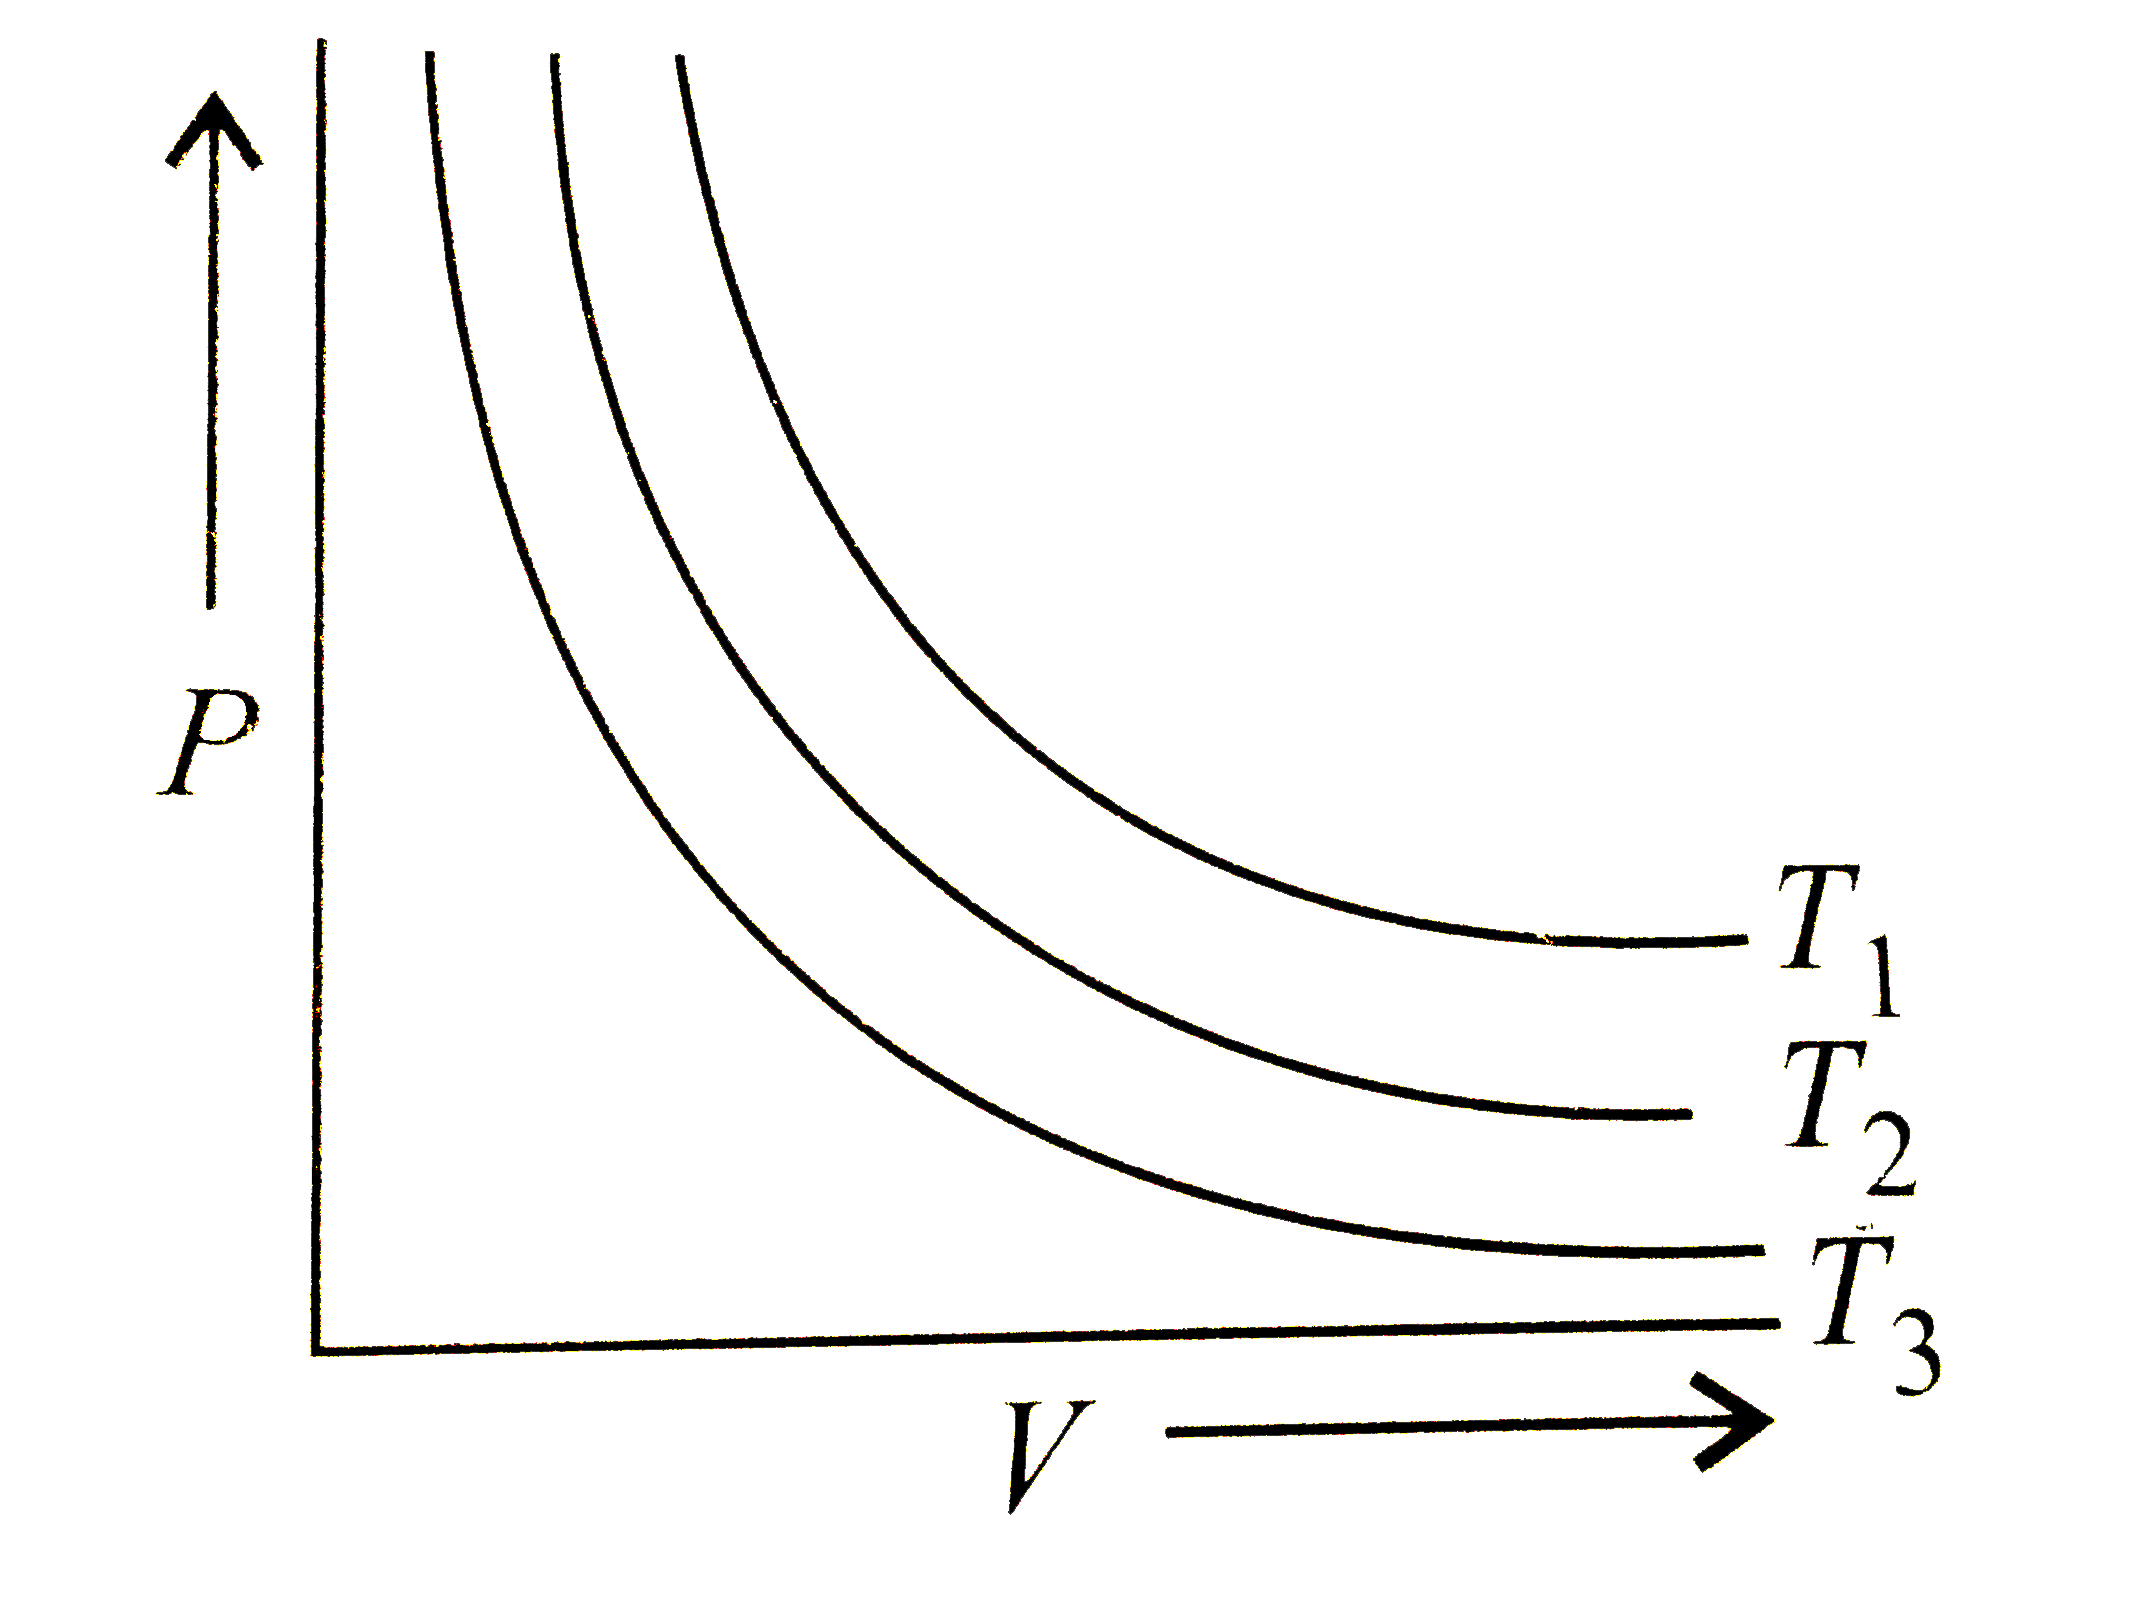
The correct relationship is
View SolutionDraw the plot log P vs log V for Boyle's law.
View SolutionFigure shows volume - temperature (V-T) graph for same mass of an ideal gas at two different pressures P1and P2. Hence
View SolutionThe current in a metallic conductor is plotted against voltage at two different temperatures T1 and T2. Which is correct
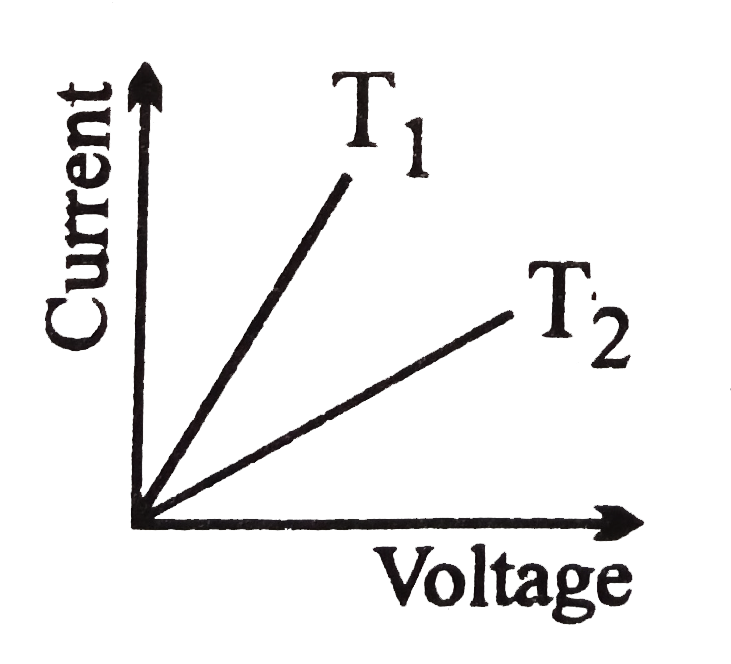
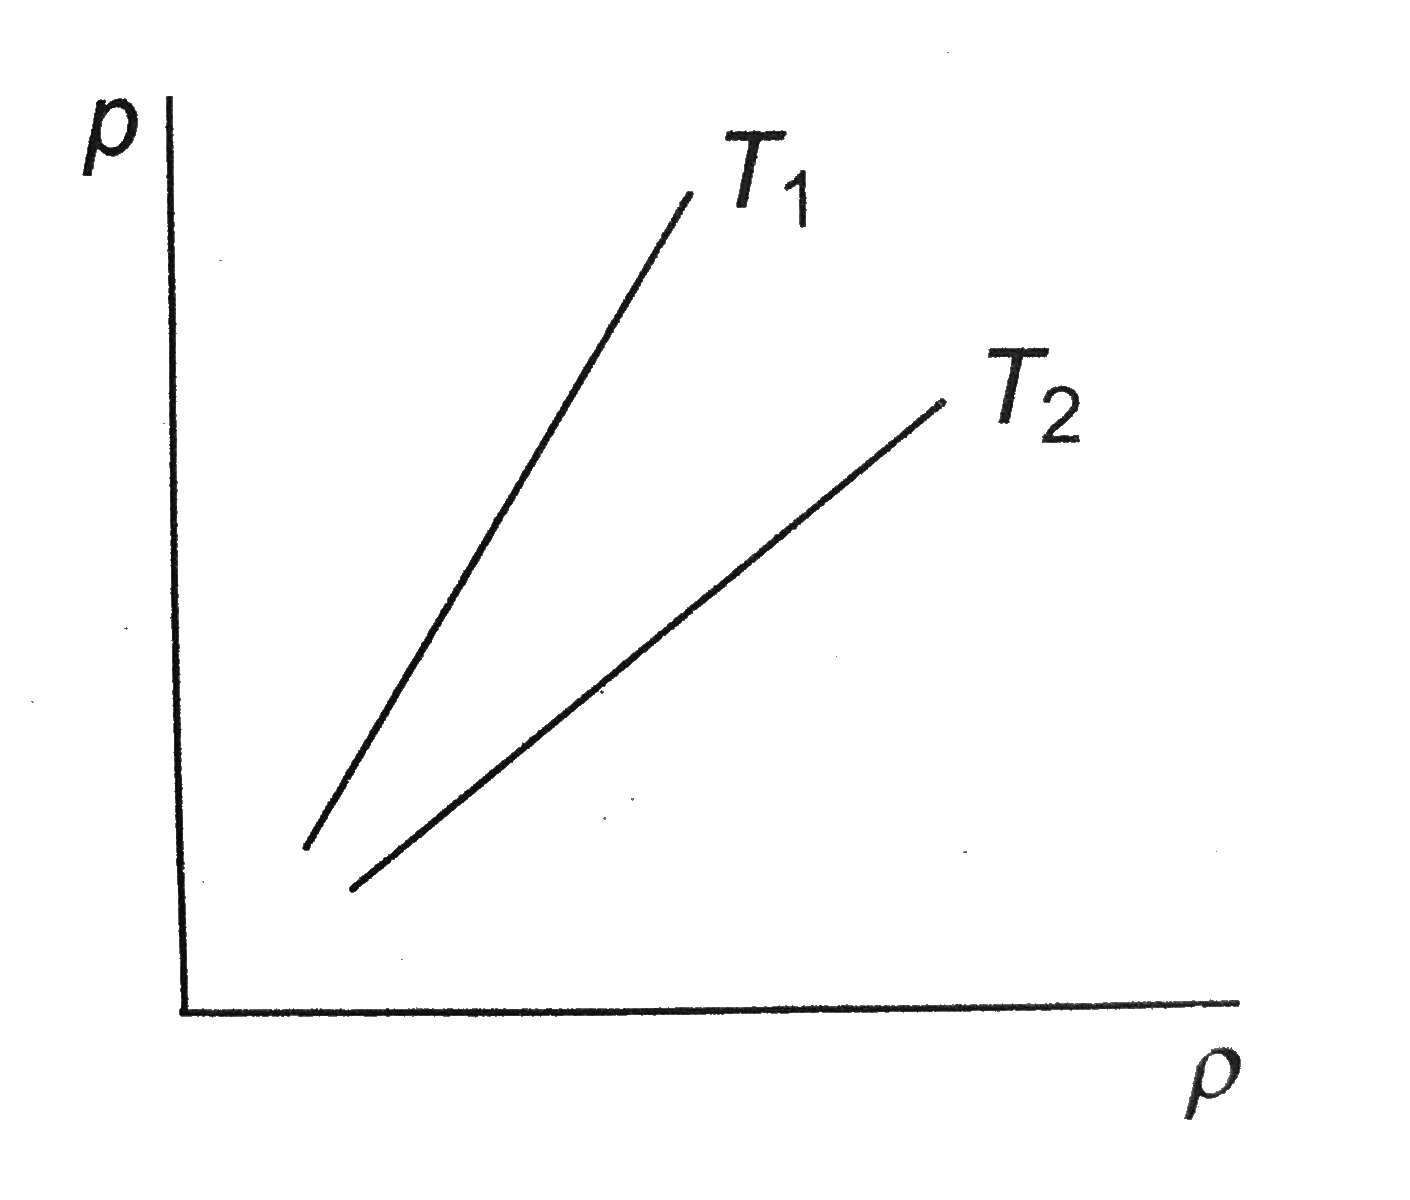
View SolutionFigure shows graphs of pressure vs density for an ideal gas at two temperature T1andT2. Which of the following is correct?
View SolutionThe plots of the extent of adsroption (x/m) Vs pressure at different temperature are as follows,
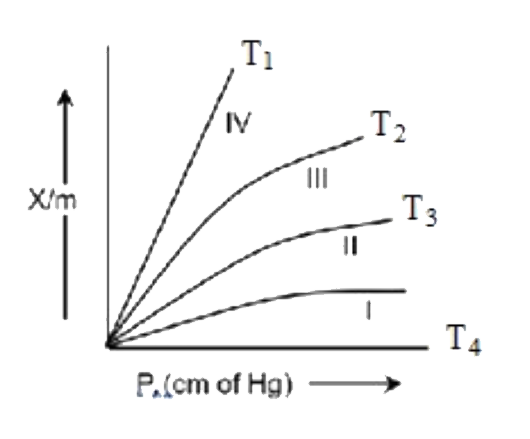
The correct order of increasing temp for curves I, II, III, IV are ,
View Solution
