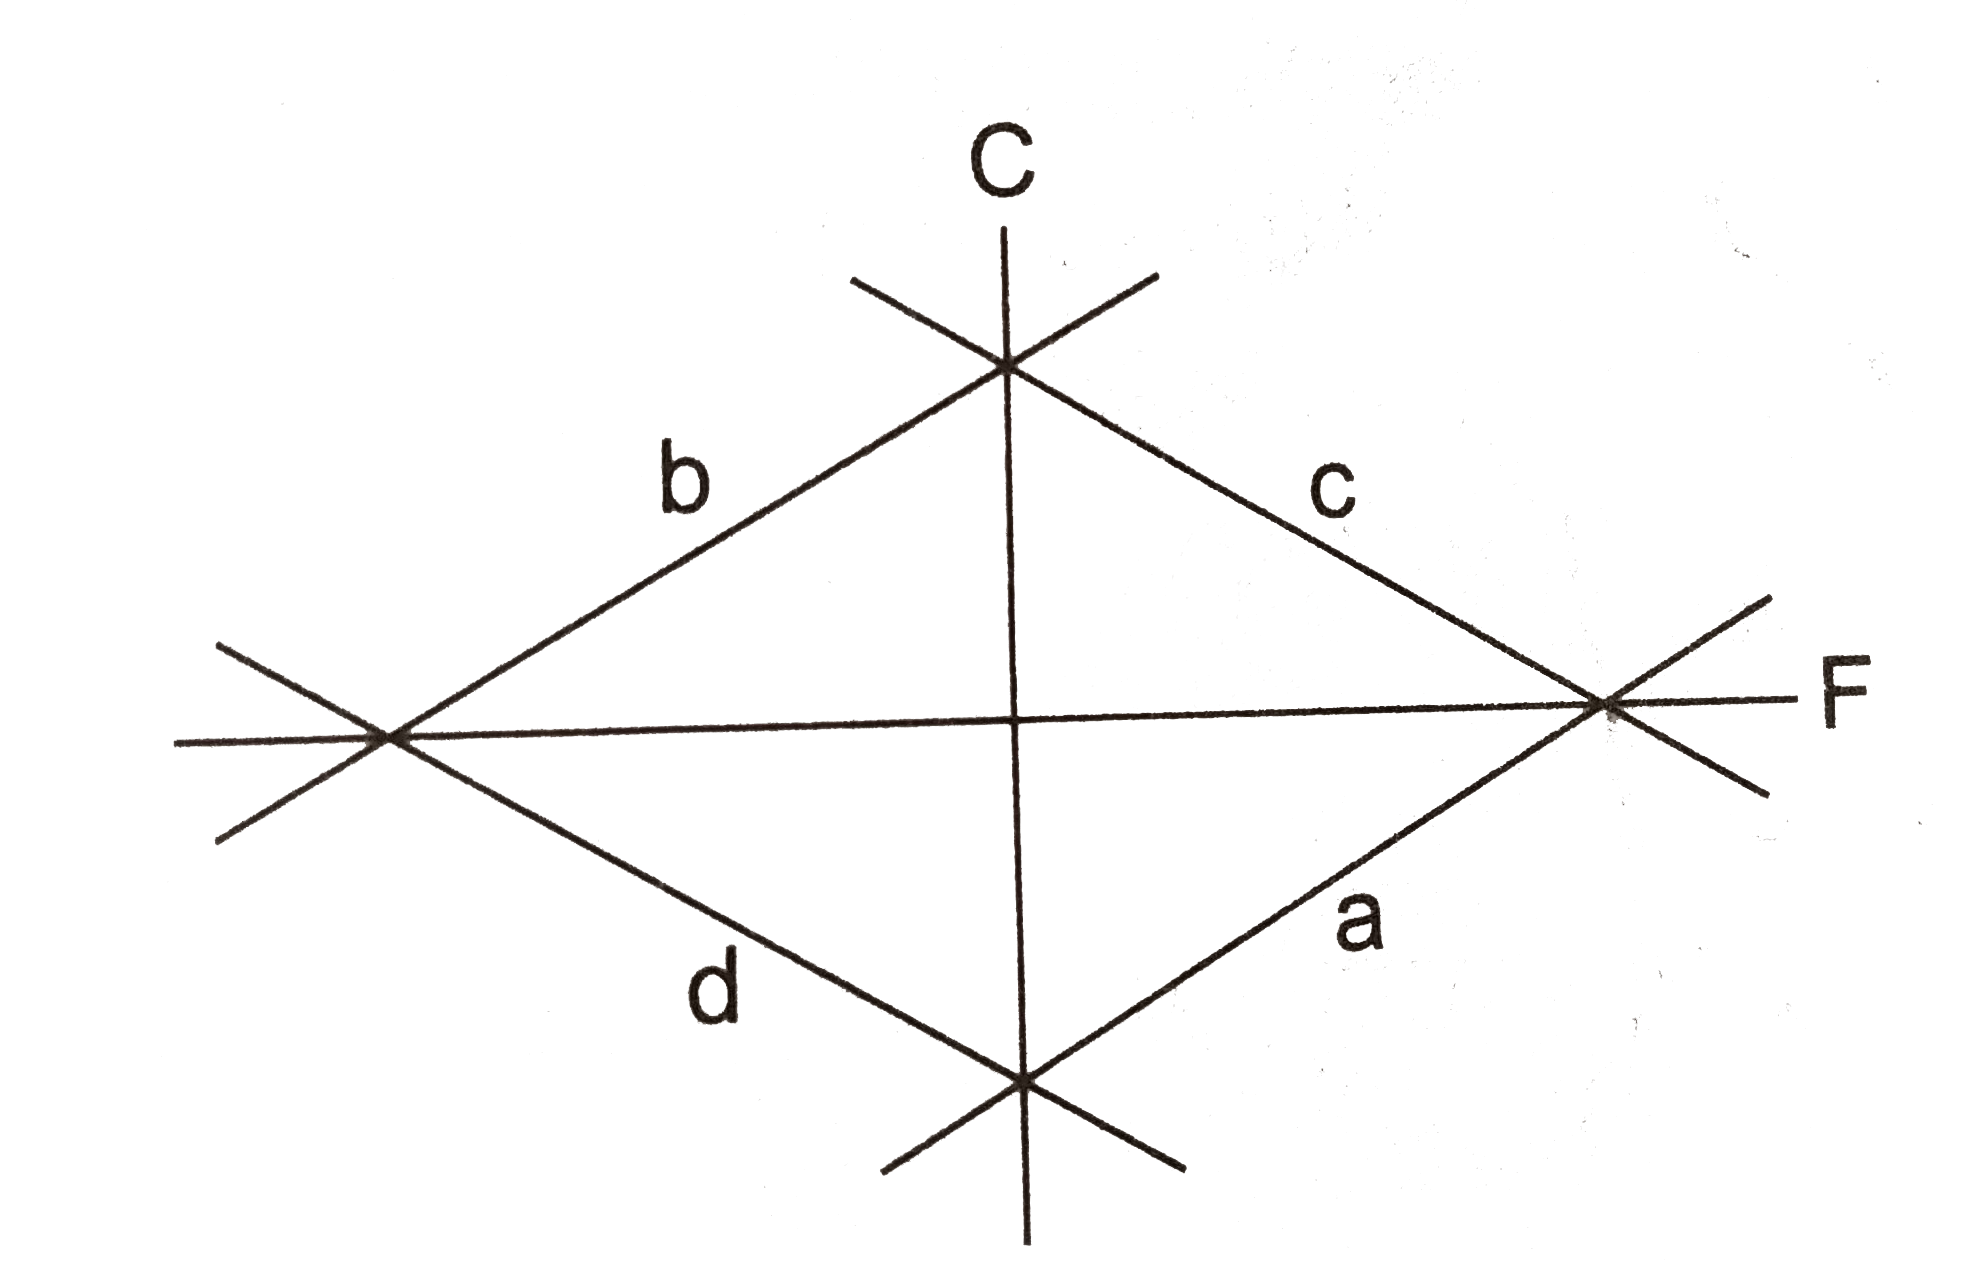
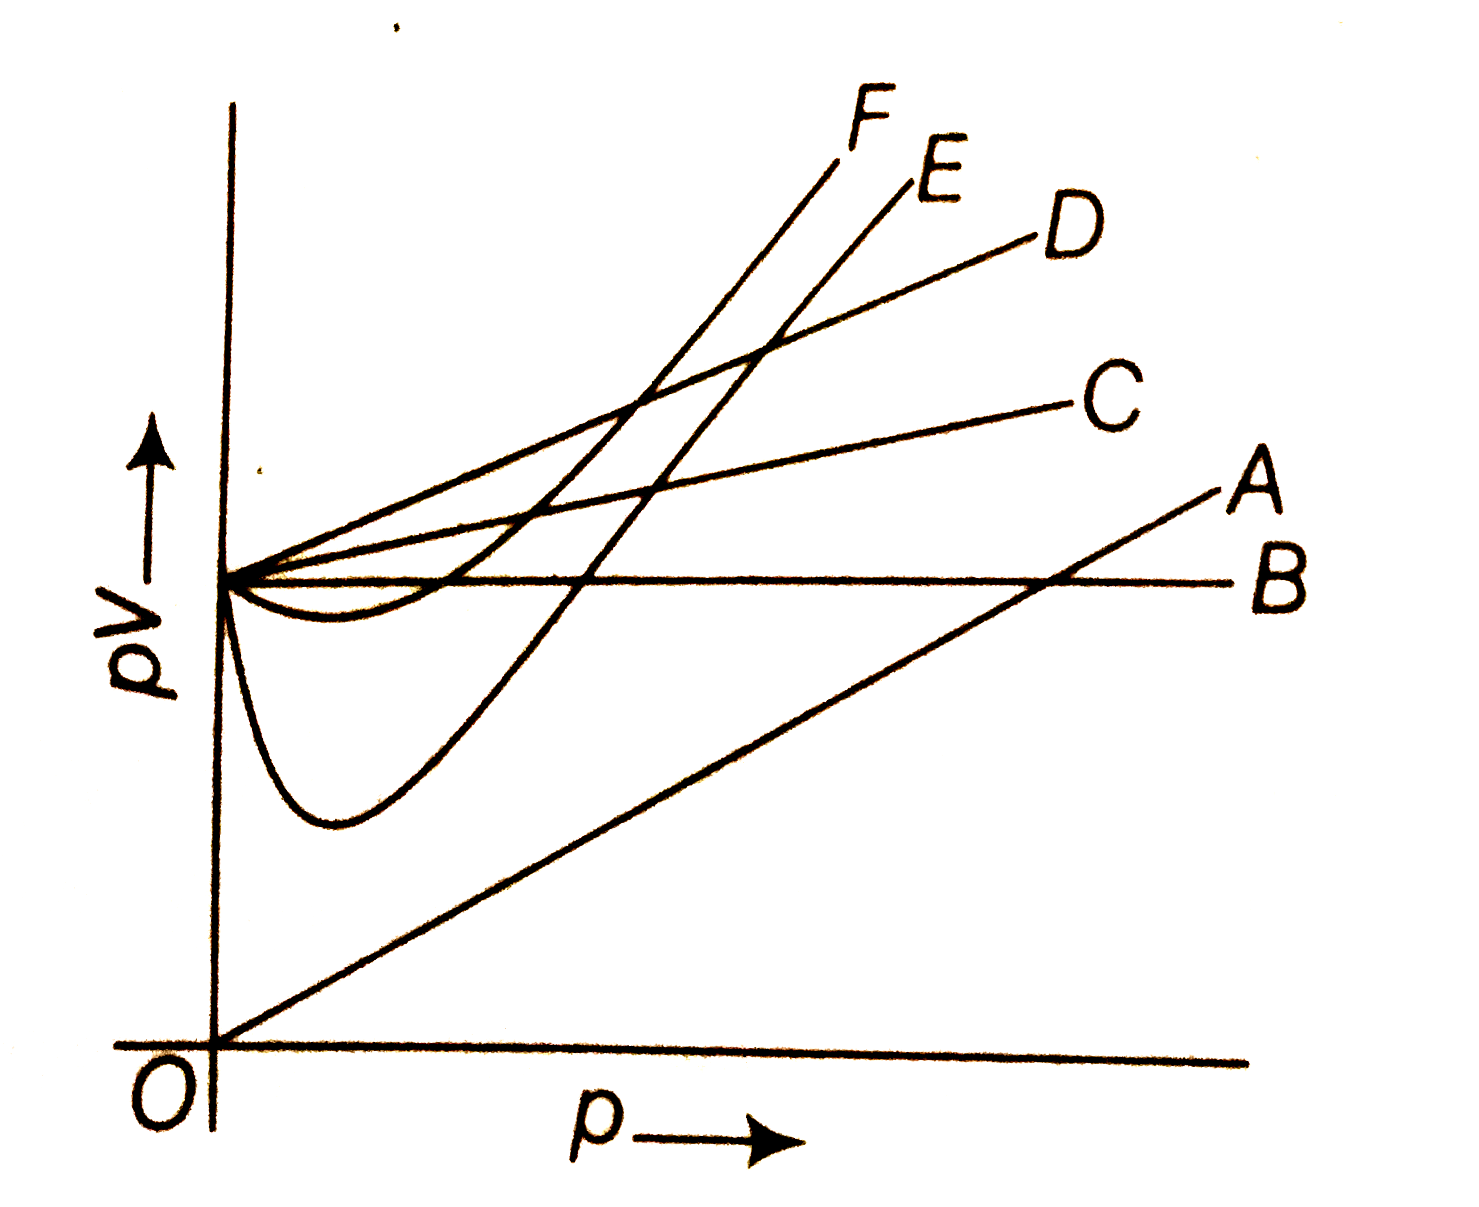
Which curve in figure represents the curve of ideal gas?
Only B
C and D
E and F
A and B
The correct Answer is:A
For ideal gas, pV= constant at all pressures.
Therefore, only B represents ideal gas.
Topper's Solved these Questions
- STATES OF MATTERBOOK - MHTCET PREVIOUS YEAR PAPERS AND PRACTICE PAPERSCHAPTER - STATES OF MATTEREXERCISE - Exercise 2 (Miscellaneous Problems)
30 Videos
- SOME BASIC CONCEPTS OF CHEMISTRYBOOK - MHTCET PREVIOUS YEAR PAPERS AND PRACTICE PAPERSCHAPTER - SOME BASIC CONCEPTS OF CHEMISTRYEXERCISE - EXERCISE 2
30 Videos
- SURFACE CHEMISTRYBOOK - MHTCET PREVIOUS YEAR PAPERS AND PRACTICE PAPERSCHAPTER - SURFACE CHEMISTRYEXERCISE - EXERCISE 2
22 Videos
Similar Questions
Knowledge Check
Which curve in the following graph represents the curve of ideal gas ?
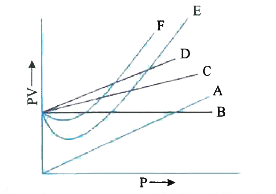 AB onlyBC and D onlyCE and F onlyDA and B only
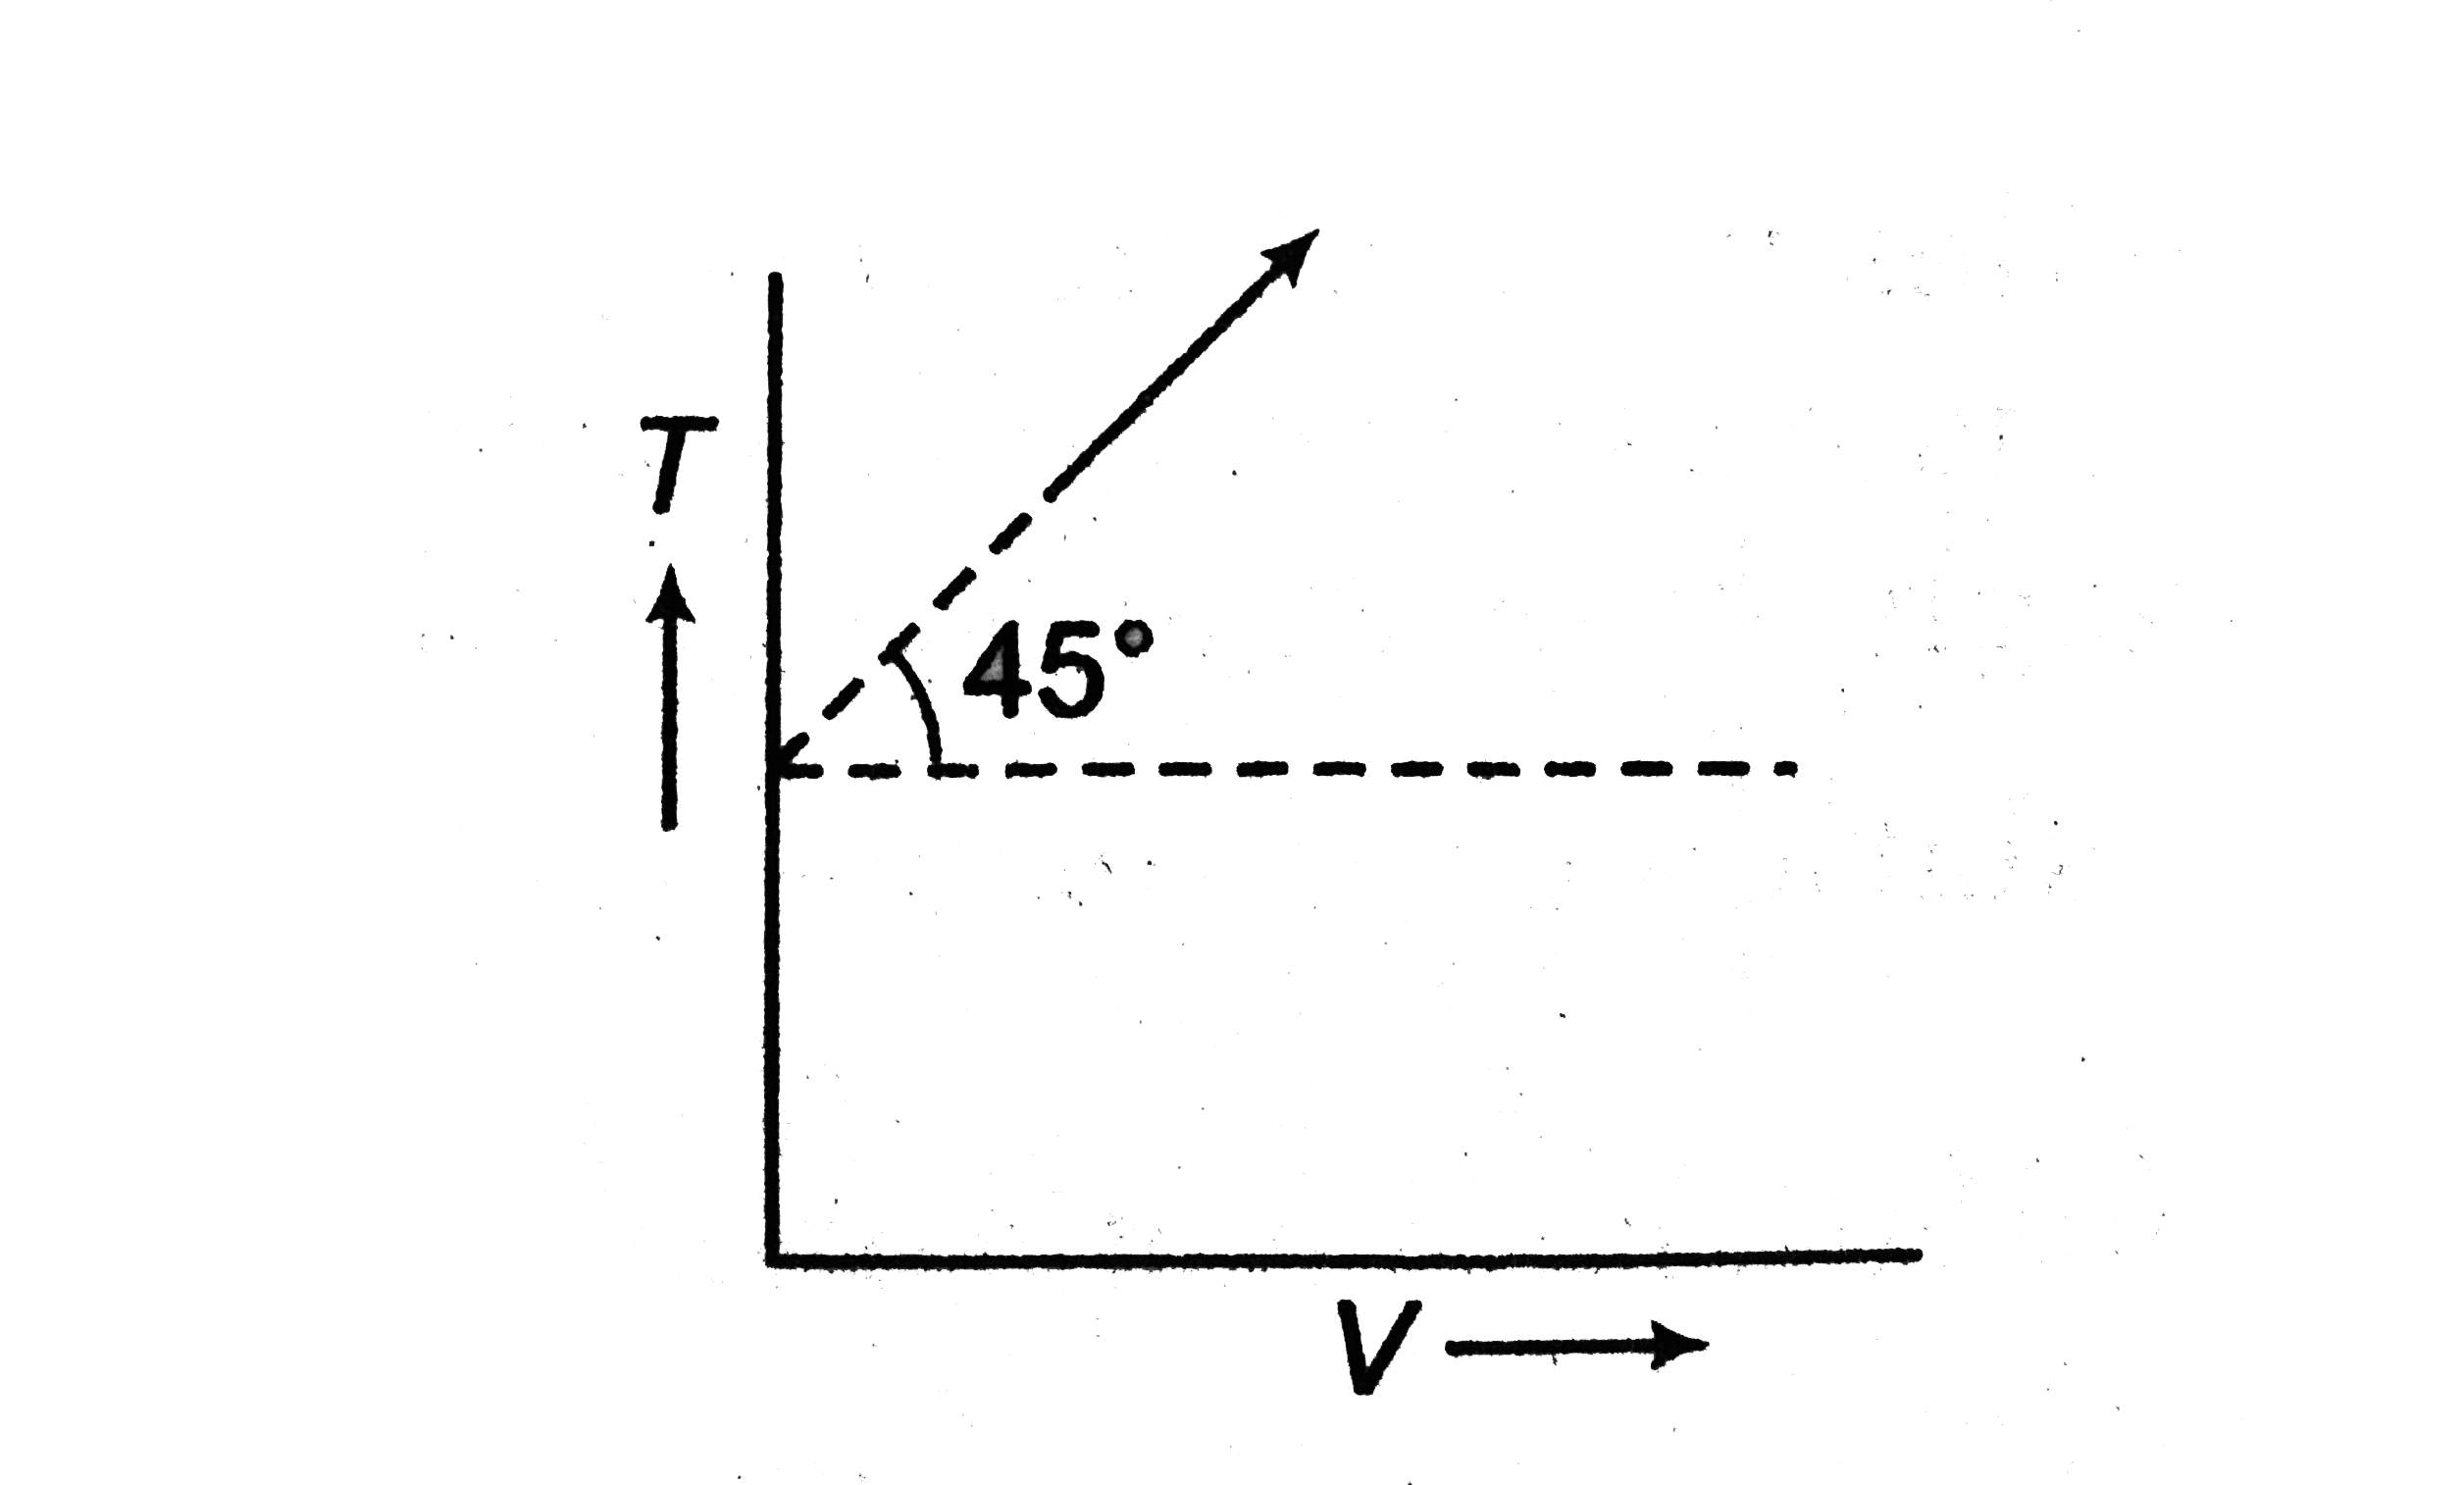
The given curve represents the variation of temperatue as a function of volume for one mole of an ideal gas. Which of the following curves best represents the variation of pressure as a function of volume ?
(##DCP_V03_C20_E01_099_Q01##).A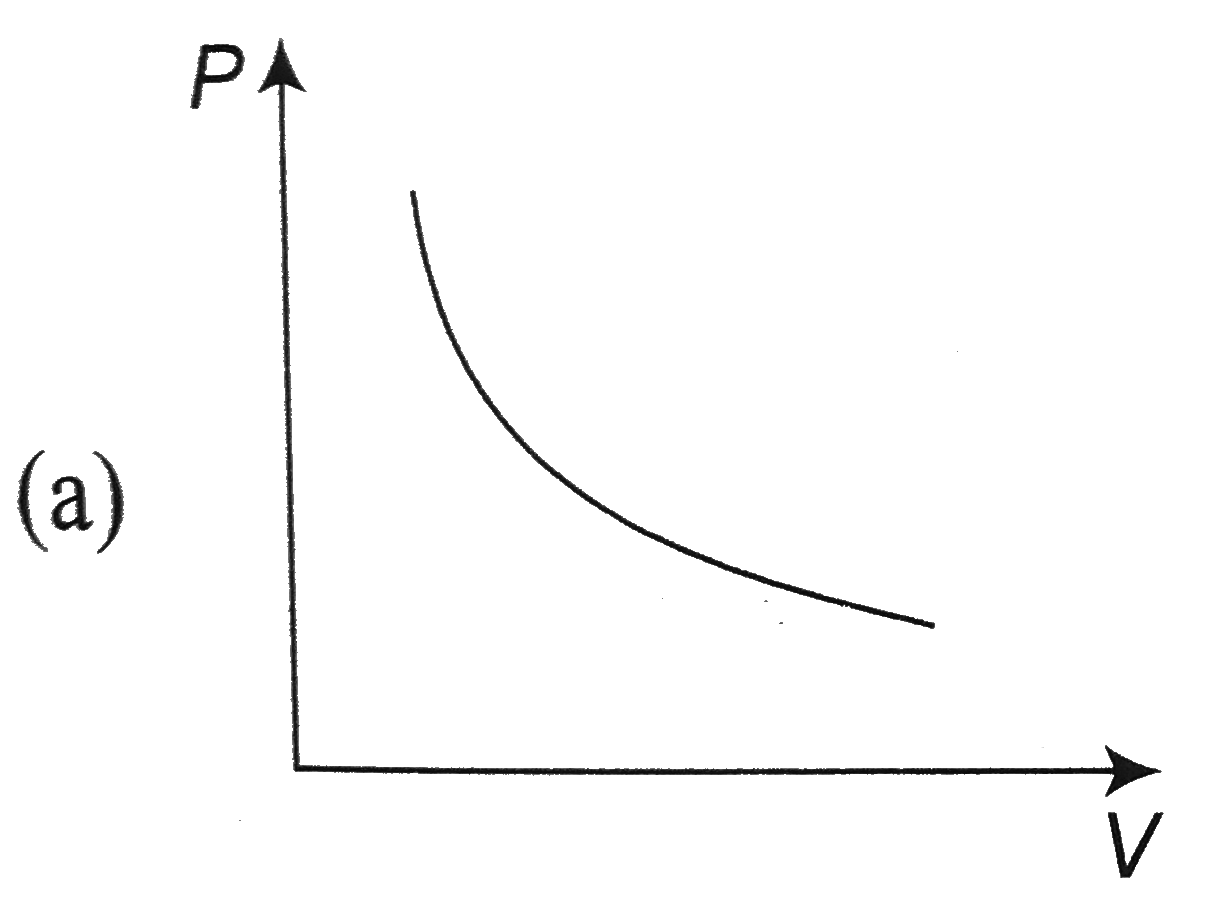 B
B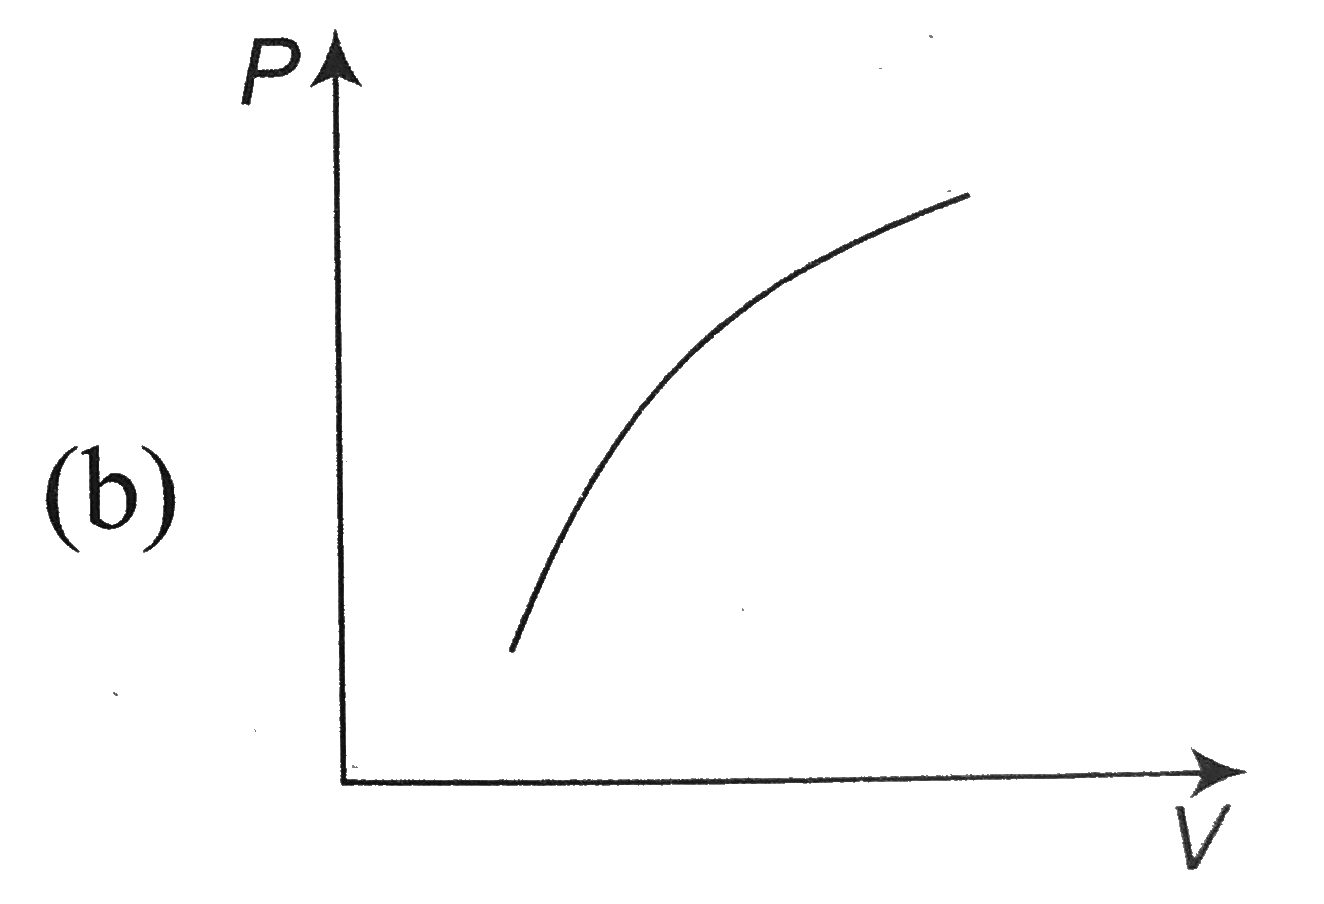 C
C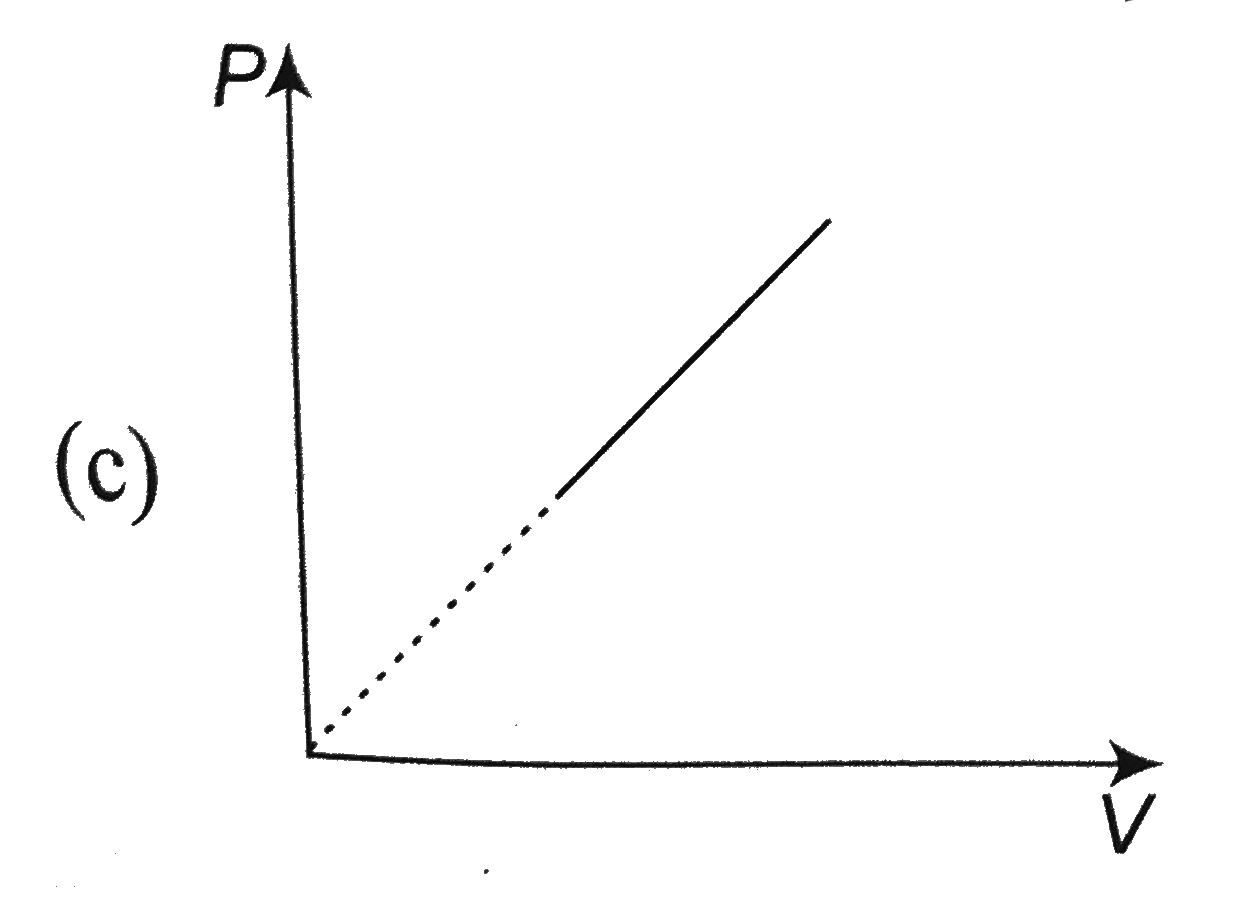 D
D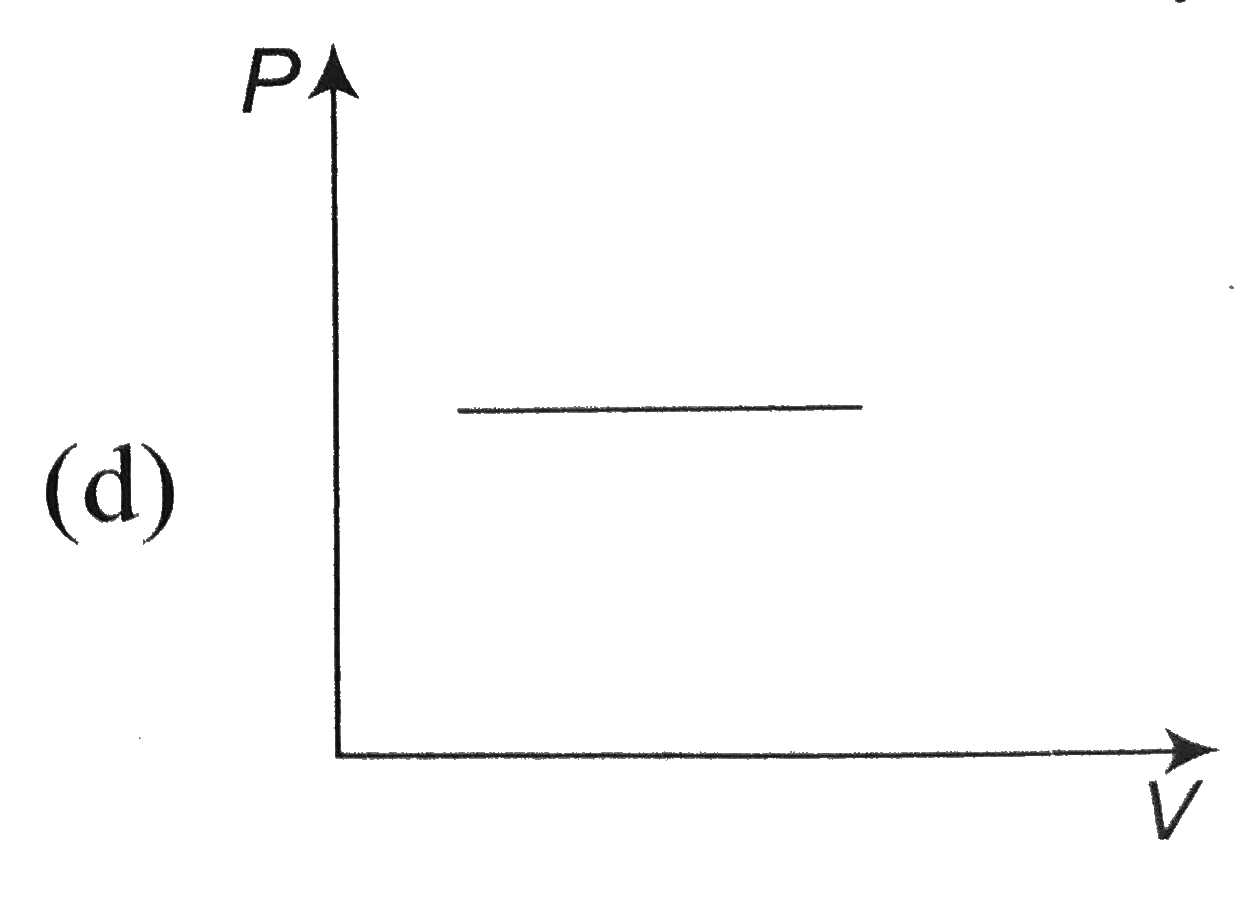
Which Indifference Curve represents the highest level of satisfaction ?
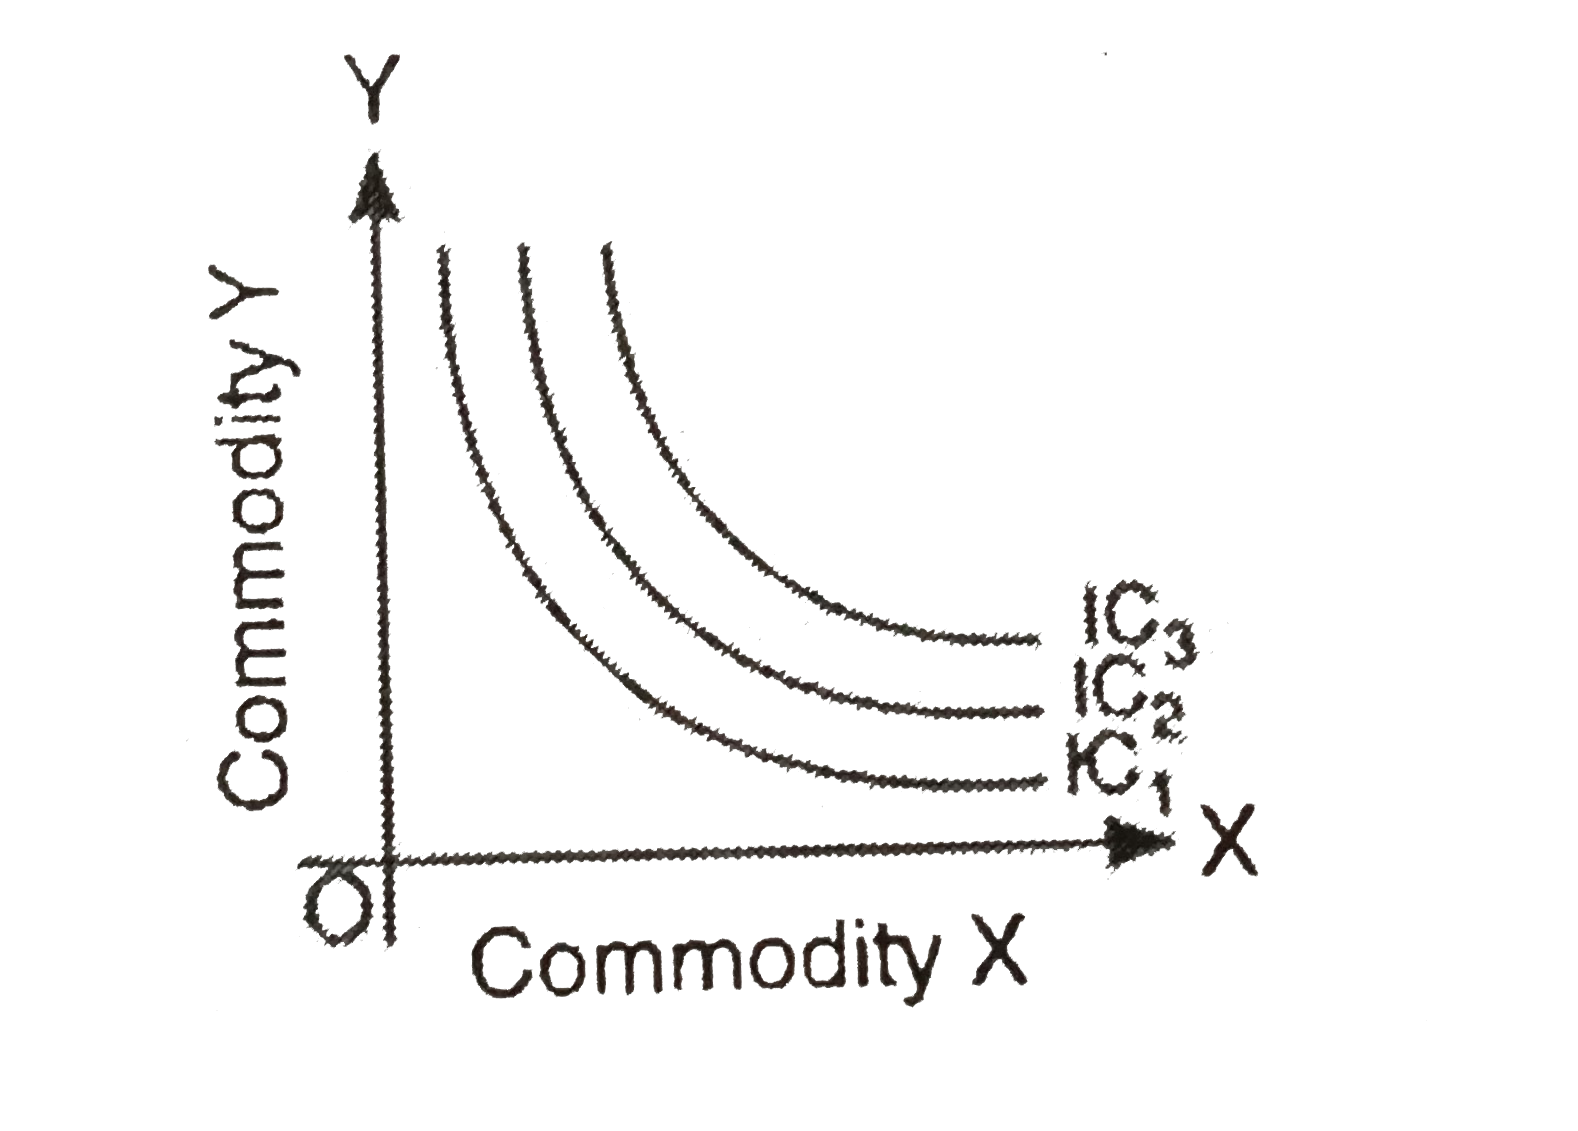 AIC1BIC2CIC3DNone of these
The given curve represents the variation of temperature as a function of volume for one mole of an ideal gas. Which of the following curves best represents the variation of pressure as a function of volume?
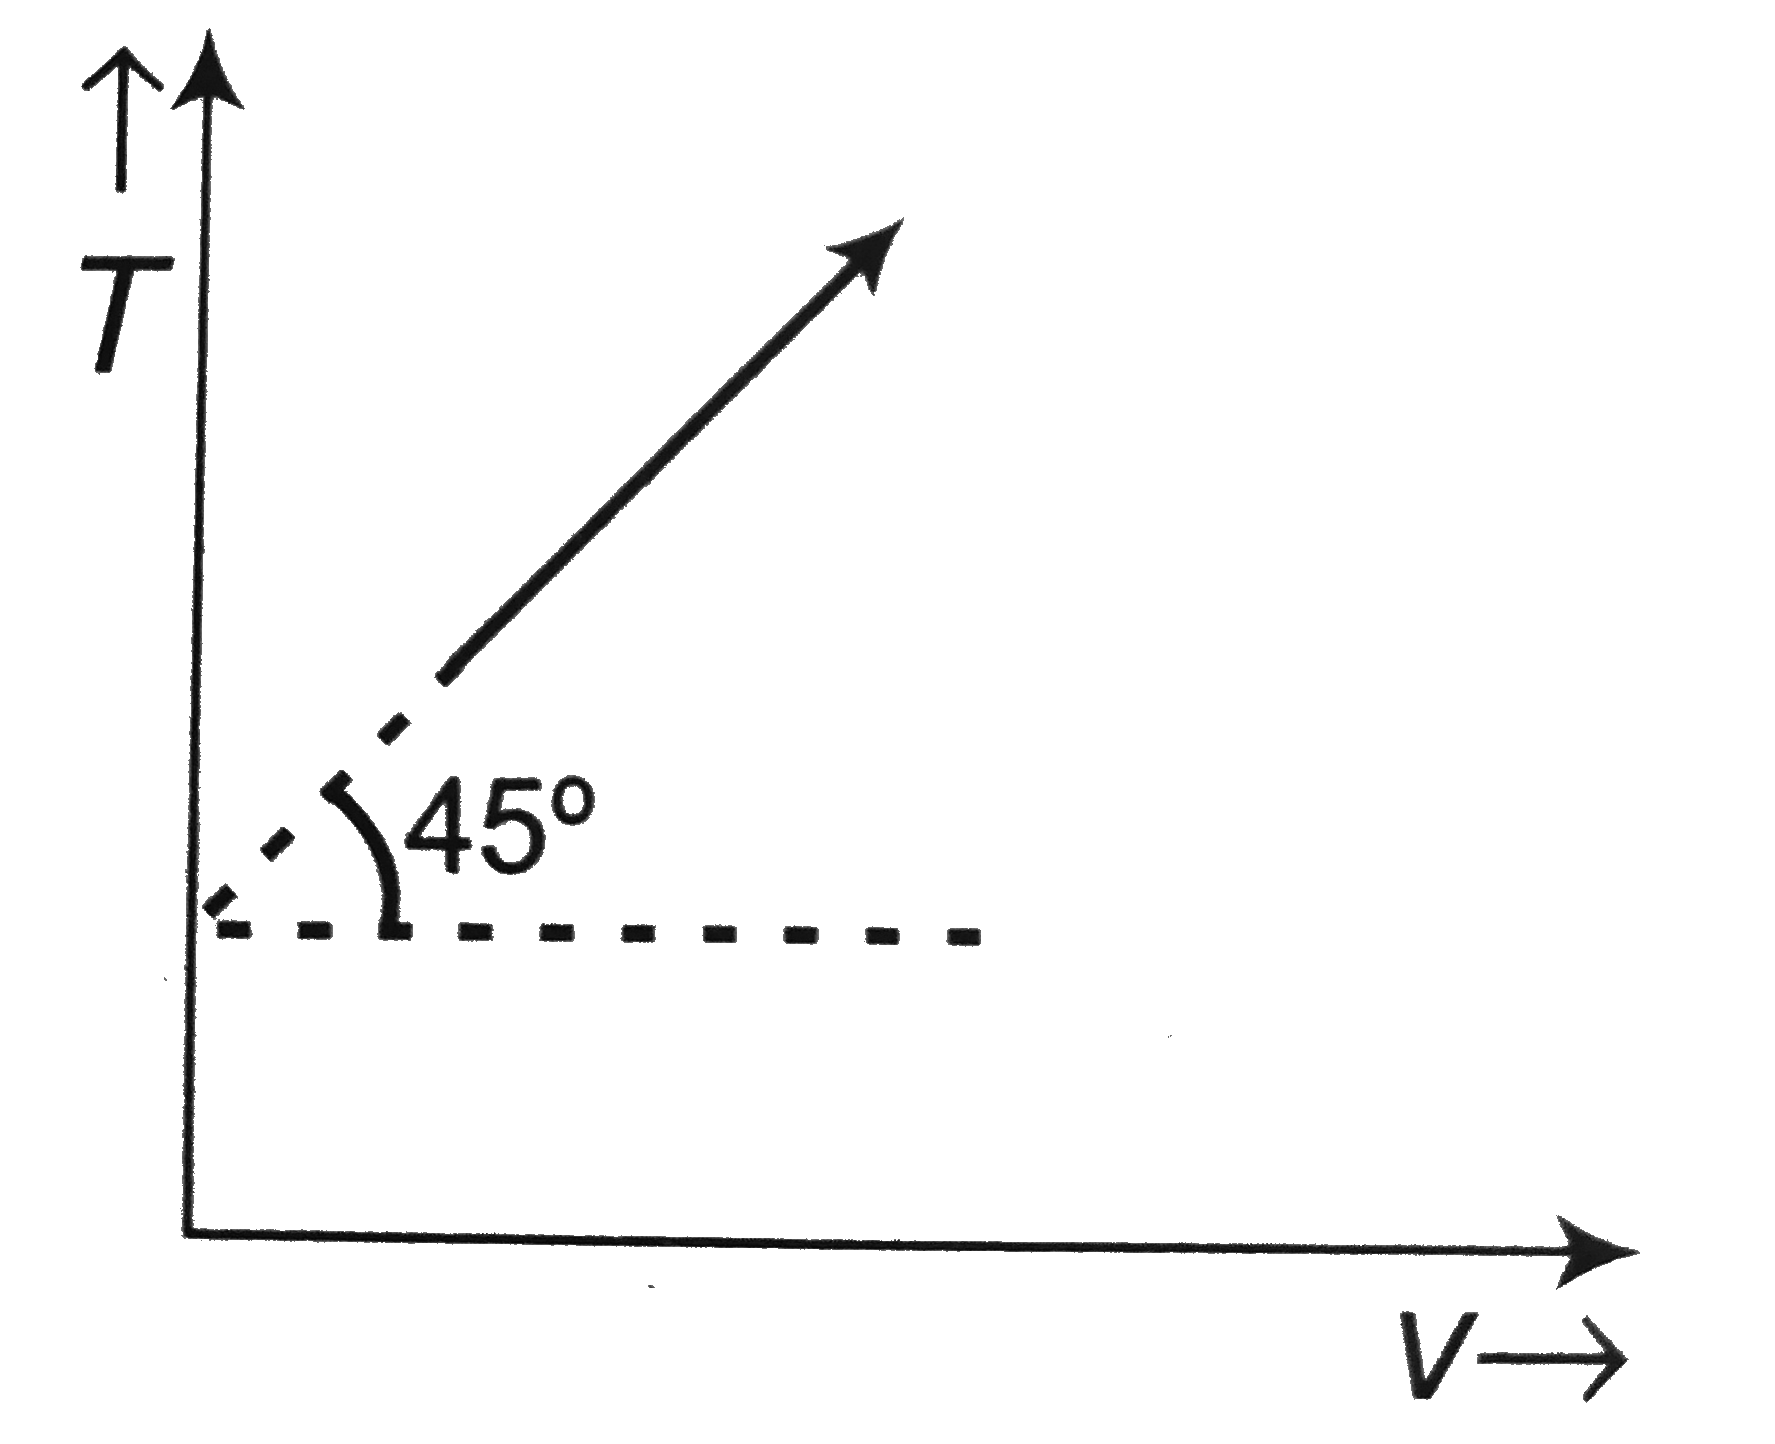
View SolutionThe given curve represents the variation of temperatue as a function of volume for one mole of an ideal gas. Which of the following curves best represents the variation of pressure as a function of volume ?
 .
.
View SolutionThe given curve represents the variation of temperatue as a function of volume for one mole of an ideal gas. Which of the following curves best represents the variation of pressure as a function of volume ?
 .
.
View SolutionThe given curve represents the variation of temperature as a function of volume for one mole of an ideal gas. Which of the following curves best represents the variation of pressure as a function of volume?

View SolutionWhich parts of the curve in the figure shown represent compression and rarefaction for a longitudianal wave?
View Solution

