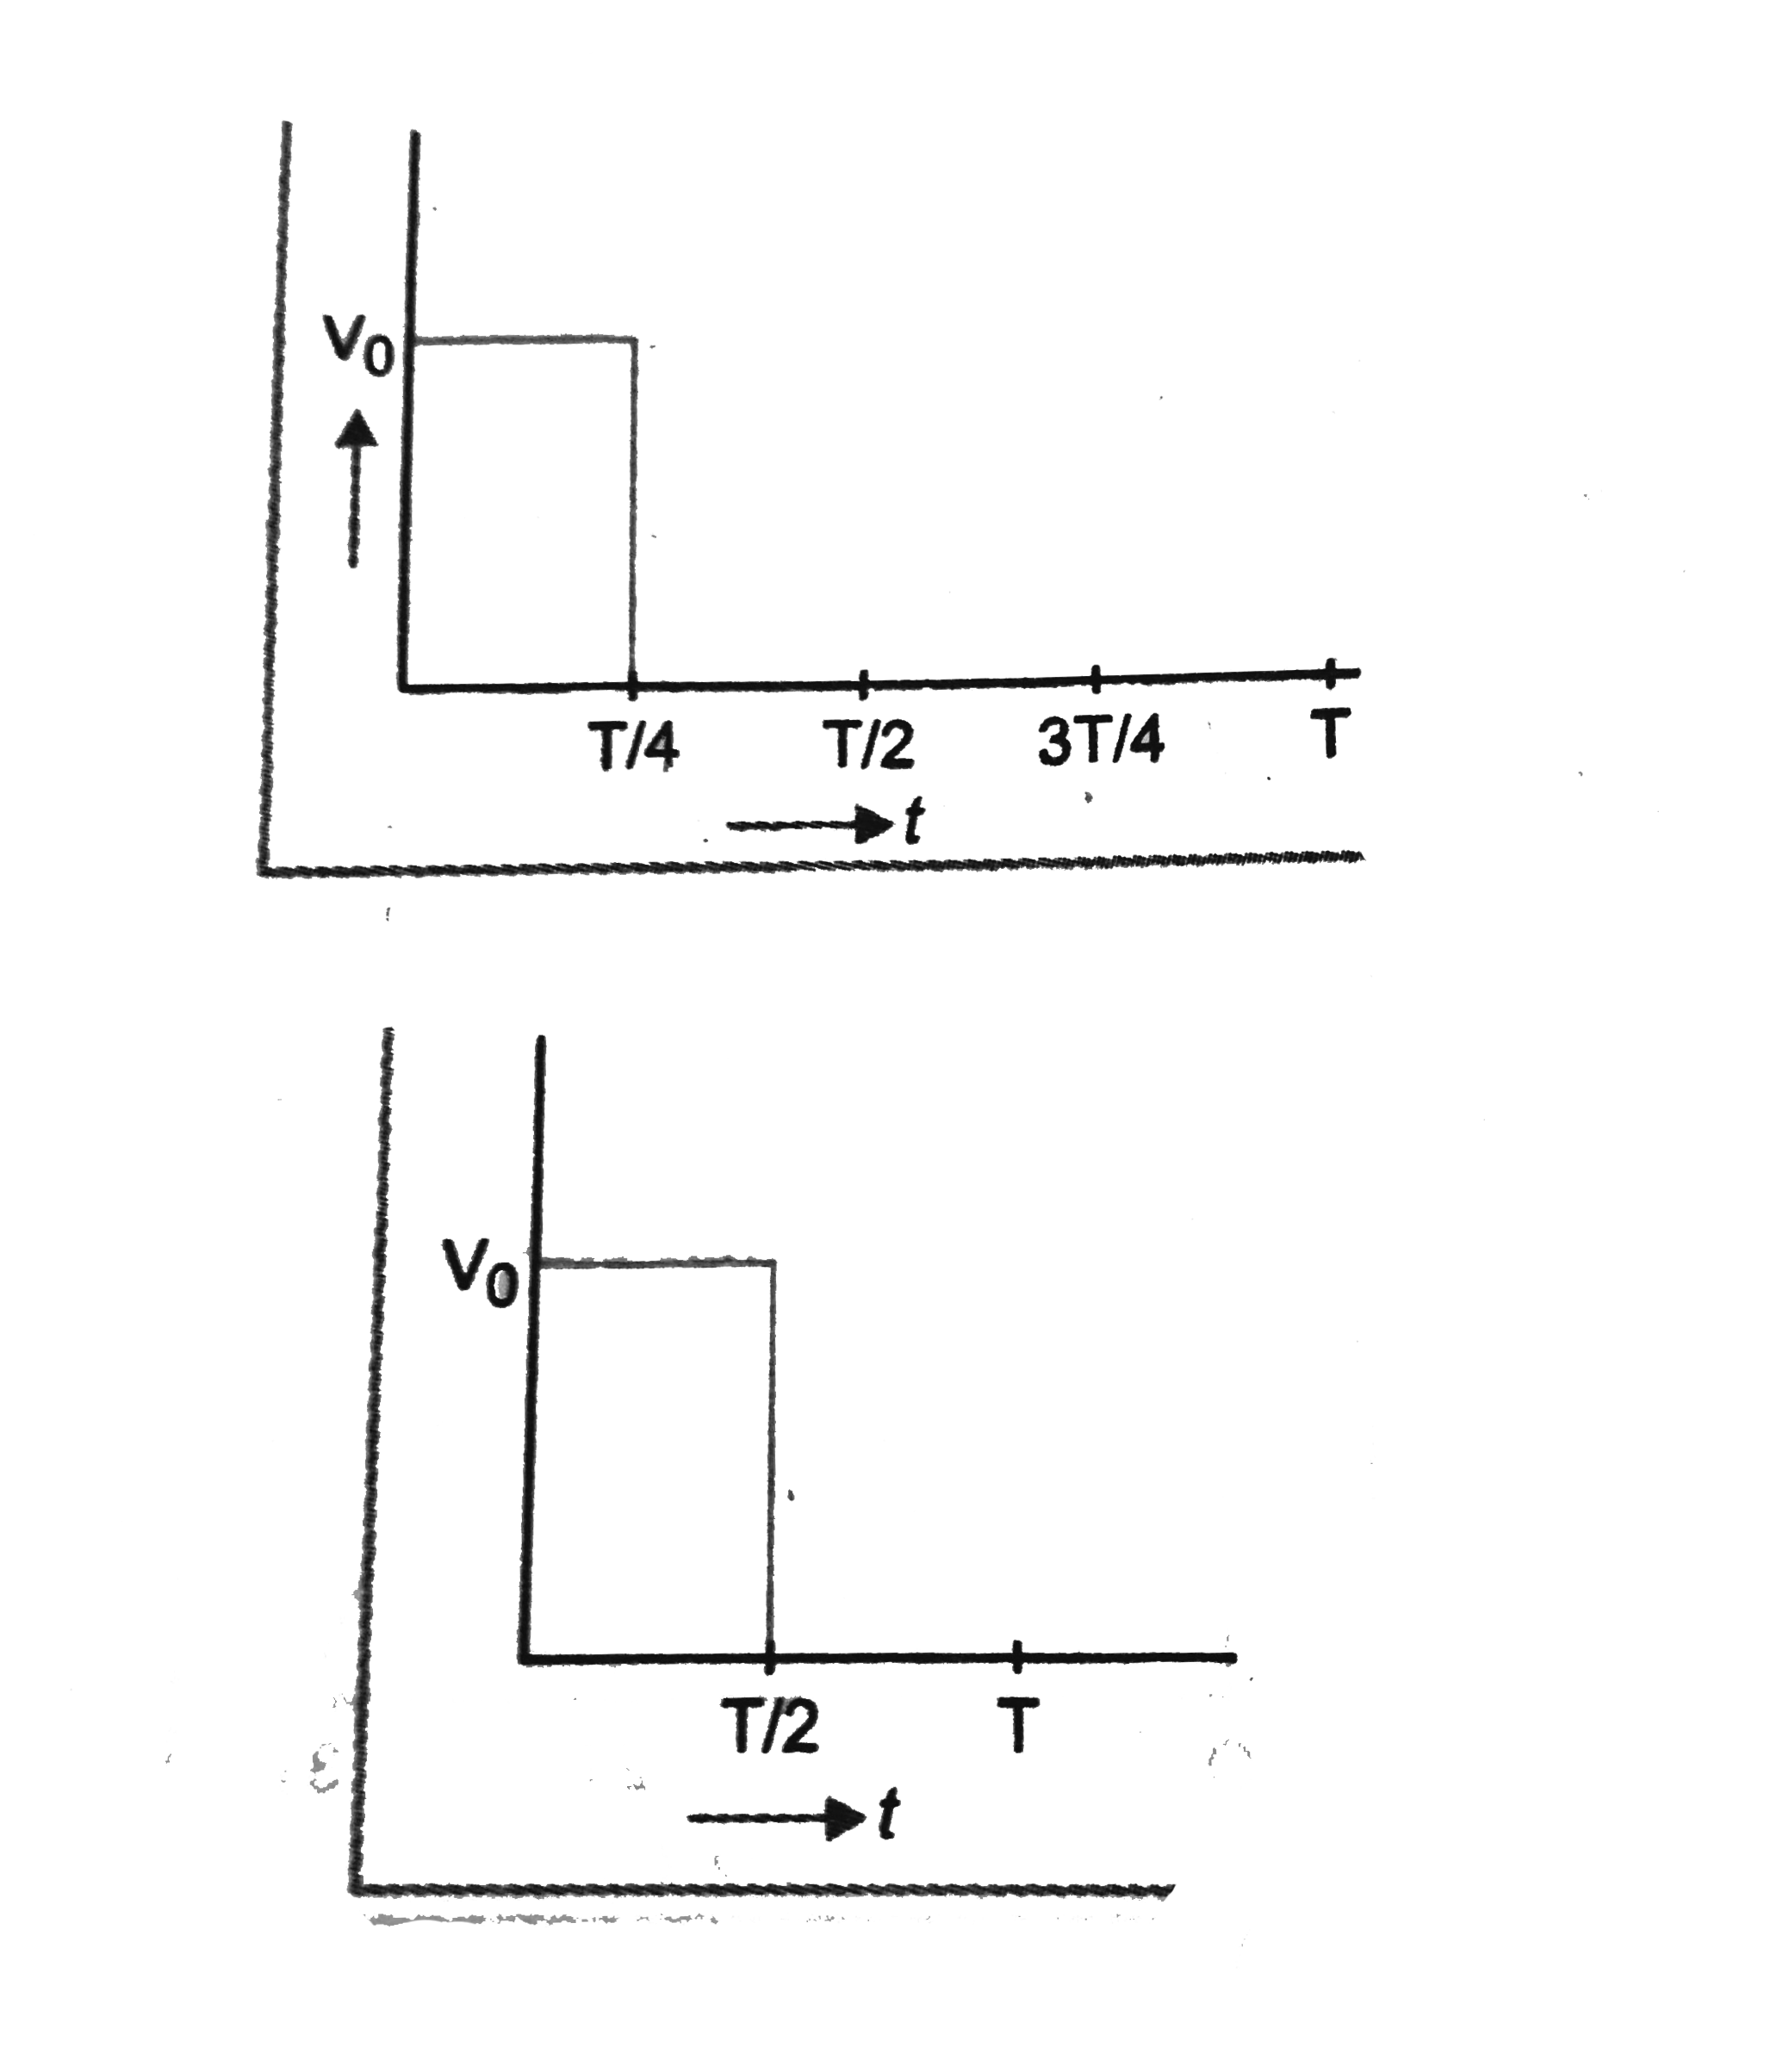
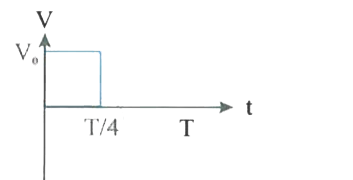
Variation of voltage with time is shown in fig
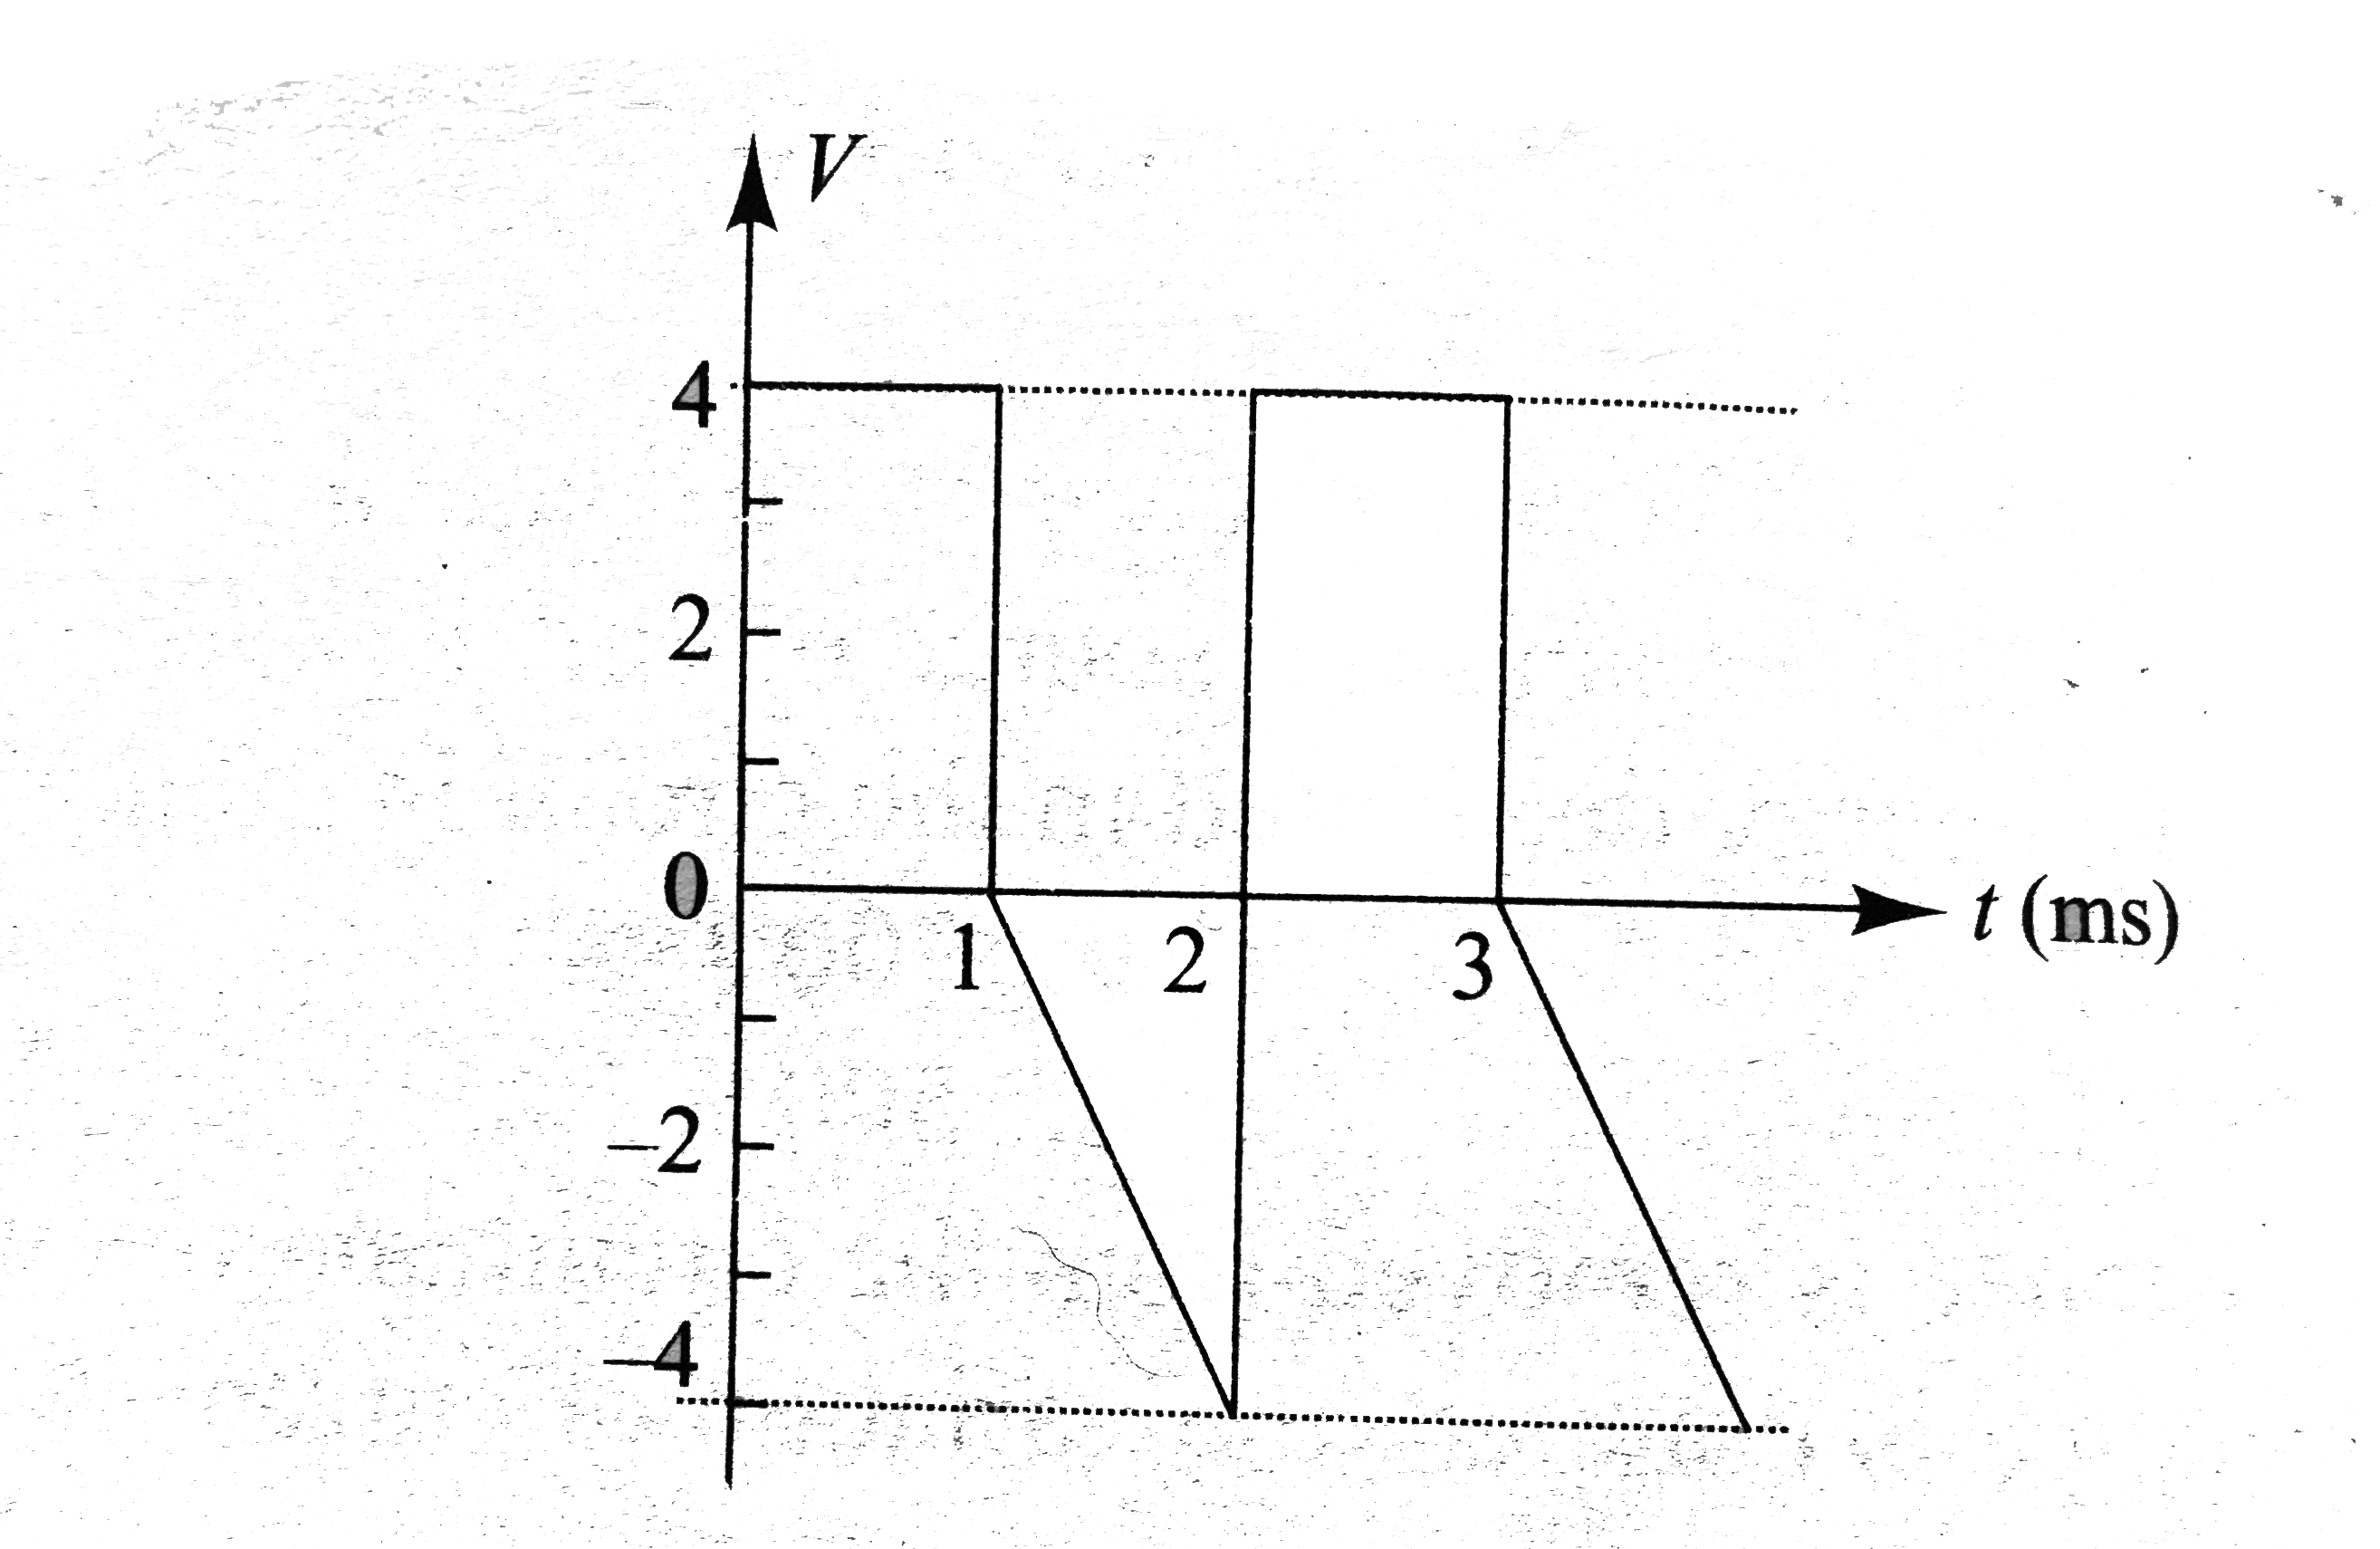
(a) The rms voltage is found to be . Find N.
Video Solution
Text Solution
The correct Answer is:(i) 4, (ii) 1
In such cases it is difficult to develop a single equation. Hence, it is usual to cosider tow equations one applicable from 0 to 1 ms and another from 1 to 2 ms.
for t lying between 0 and 1 ms . For t lying between 1 and 2 ms
(i)
.
(ii)
.
|
Updated on:21/07/2023
Topper's Solved these Questions
- BOOK - CENGAGE PHYSICSCHAPTER - ALTERNATING CURRENTEXERCISE - Archives Subjective1videos
ALTERNATING CURRENT
- BOOK - CENGAGE PHYSICSCHAPTER - ALTERNATING CURRENTEXERCISE - Archives Single Correct2videos
ALTERNATING CURRENT
- BOOK - CENGAGE PHYSICSCHAPTER - ALTERNATING CURRENTEXERCISE - Exercises Linked Comprehension25videos
ALTERNATING CURRENT
- BOOK - CENGAGE PHYSICSCHAPTER - OSCILLATIONSEXERCISE - QUESTION BANK39videos
OSCILLATIONS
- BOOK - CENGAGE PHYSICSCHAPTER - ATOMIC PHYSICSEXERCISE - ddp.4.315videos
ATOMIC PHYSICS
Similar Questions
Knowledge Check
- Question 1 - Select One
The peak voltage of an ac supply is 440 V, then its rms voltage is
A31.11VB311.1VC41.11VD411.1V - Question 2 - Select One
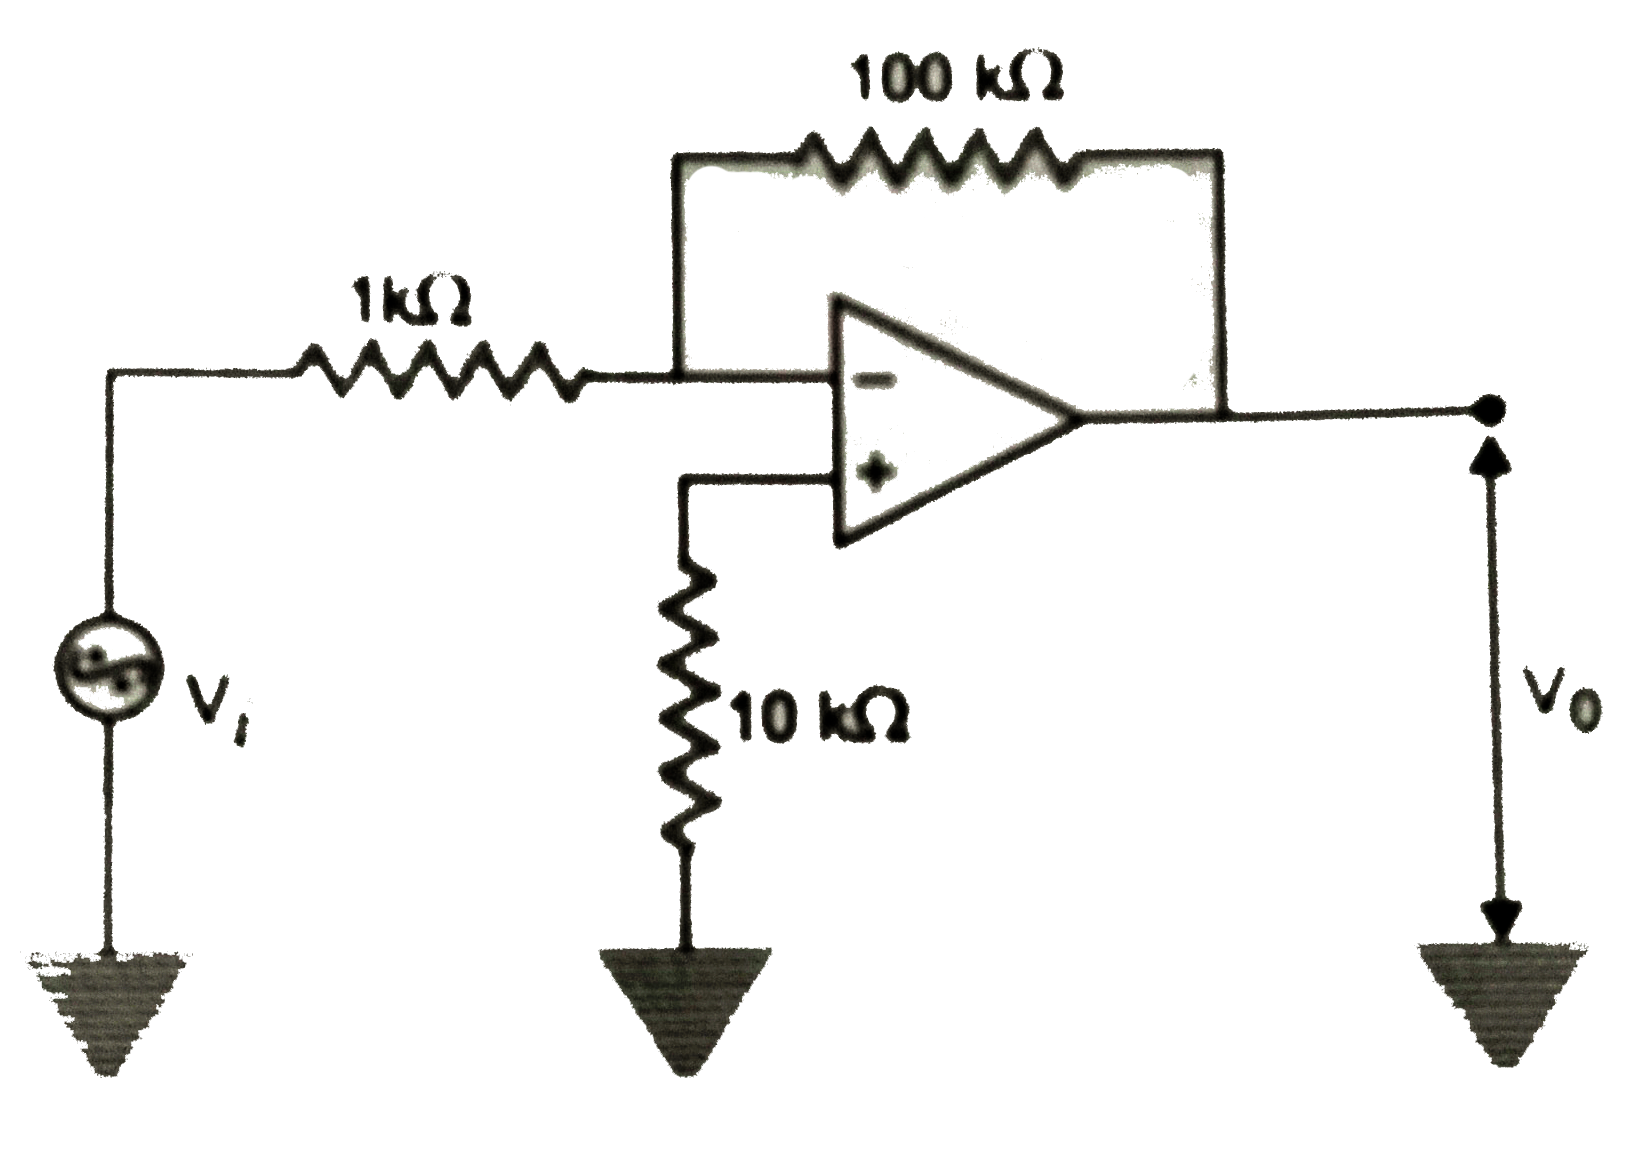
The voltage gain of the amplifier shown in Fig.is
 A10B100C1000D9.9
 - Question 3 - Select One
A alternating voltage varies with time (t) as V=100sin(50πt). The rms voltage and the frequency respectively, are
A100√2V,50HzB100V,25HzC100√2V,50HzD100√2V,25Hz
If an alternating voltage is represented asE=141sin(628t), then
(1) the rms voltage is 141V
(2) the rms voltage is 100V
(3) the frequency is 50Hz
(4) the frequency is 100HzView SolutionThe r.m.s voltage of the wave from shown is:
 View Solution
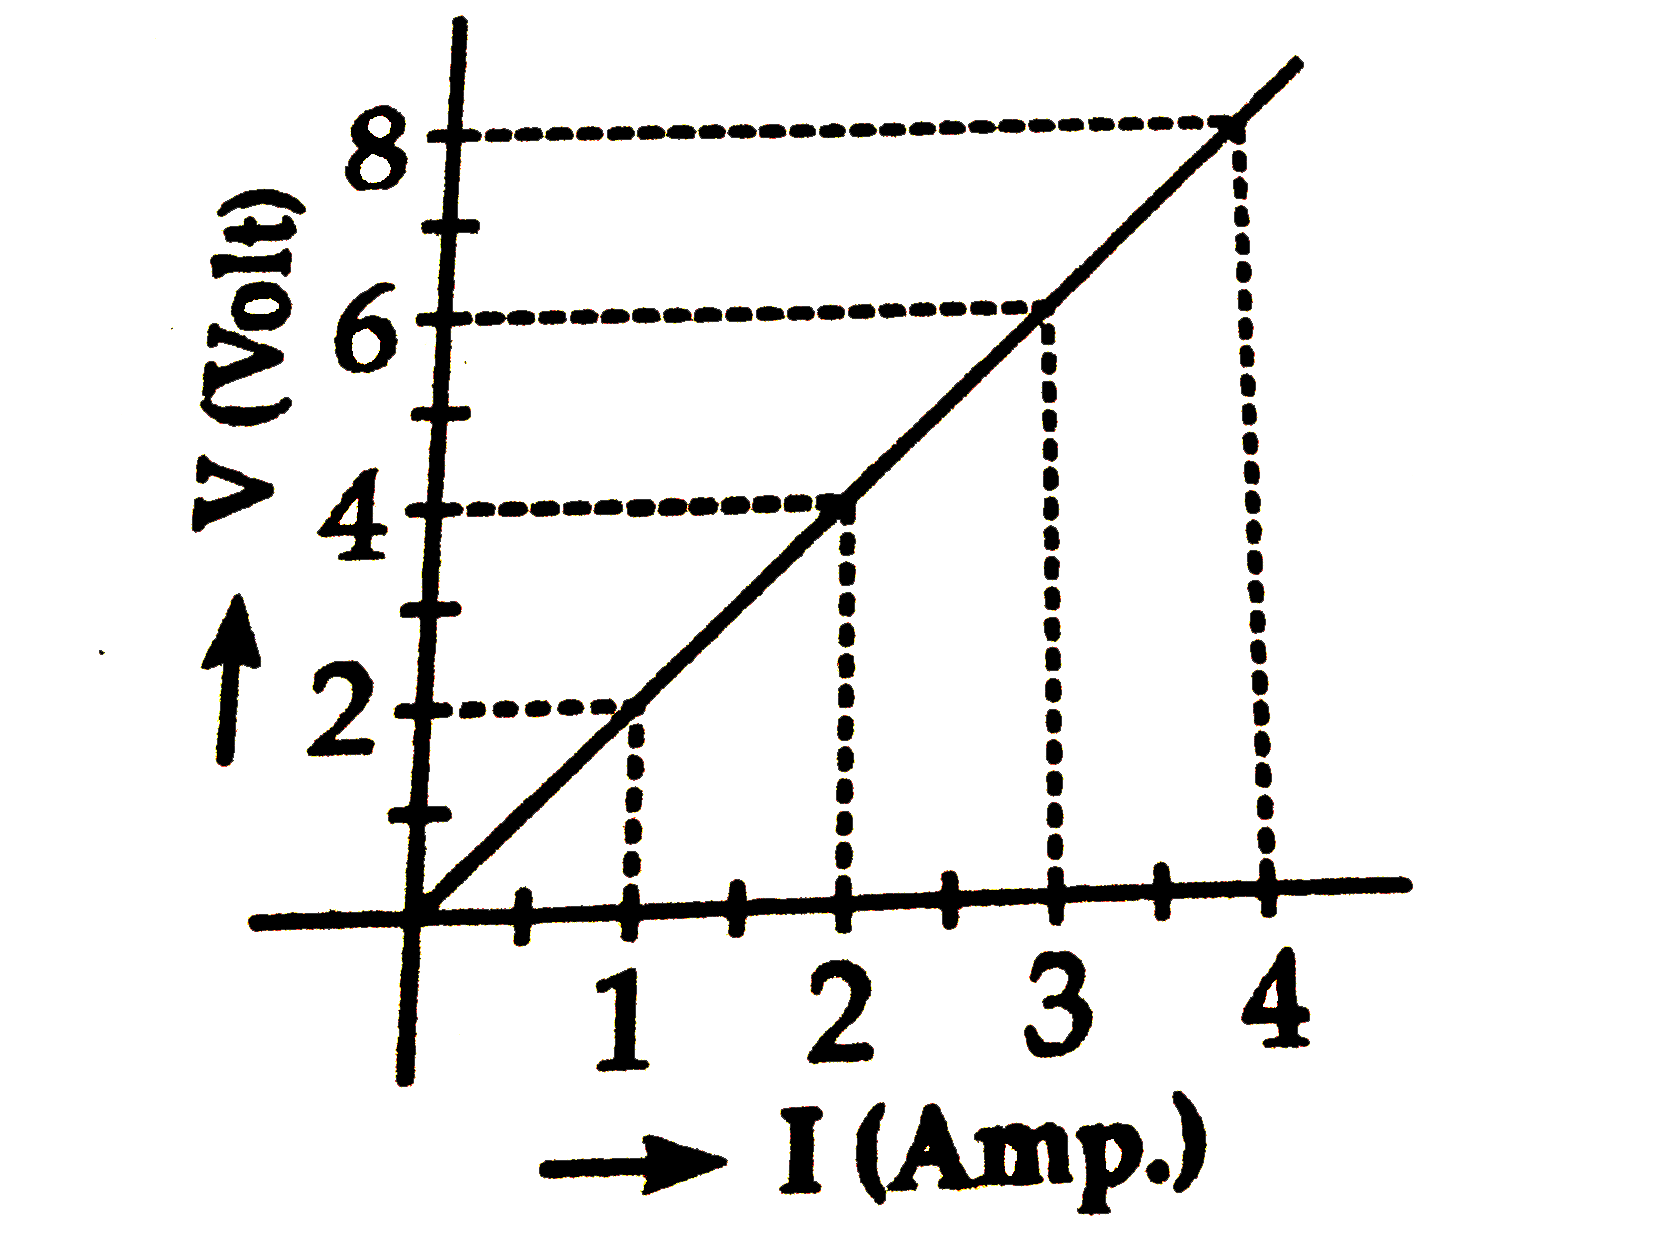
Variation of current and voltage in a conductor is shown in the adjoining figure. The resistance of the conductor is
 View Solution
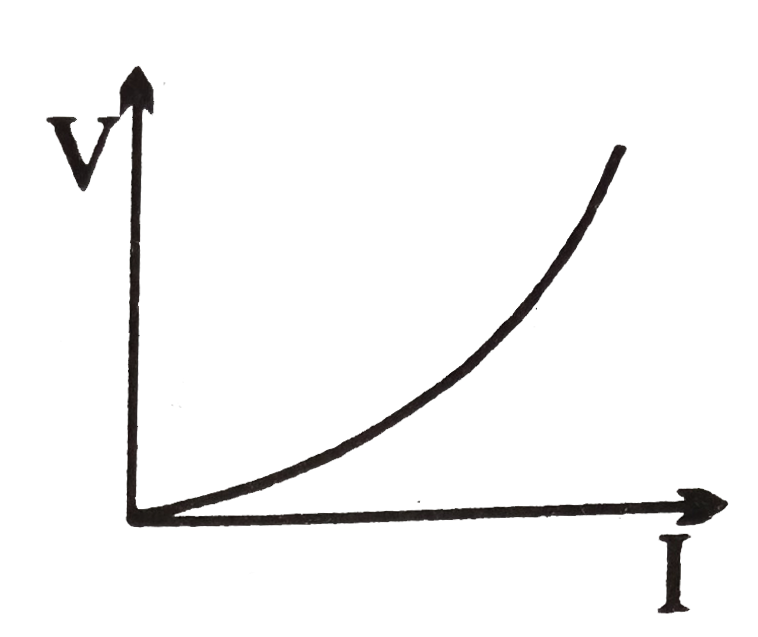
The variation of current (I) and voltage (V) is as shown in figure A. The variation of power P with current I is best shown by which of the following graph
 View Solution
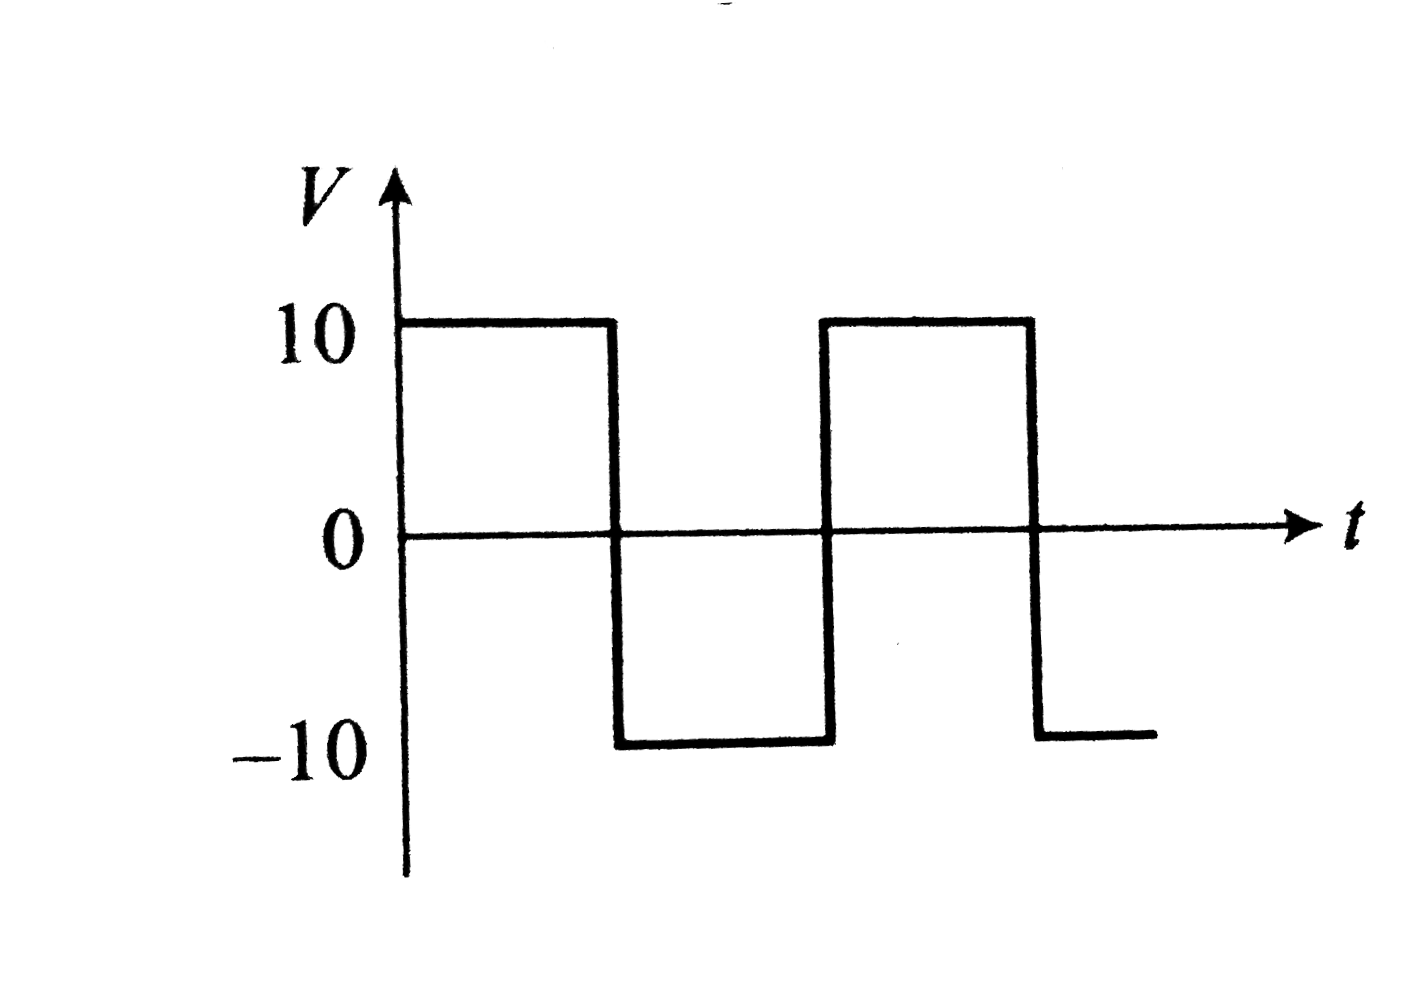
The r.m.s. voltage of the wave form shown is
 View Solution


