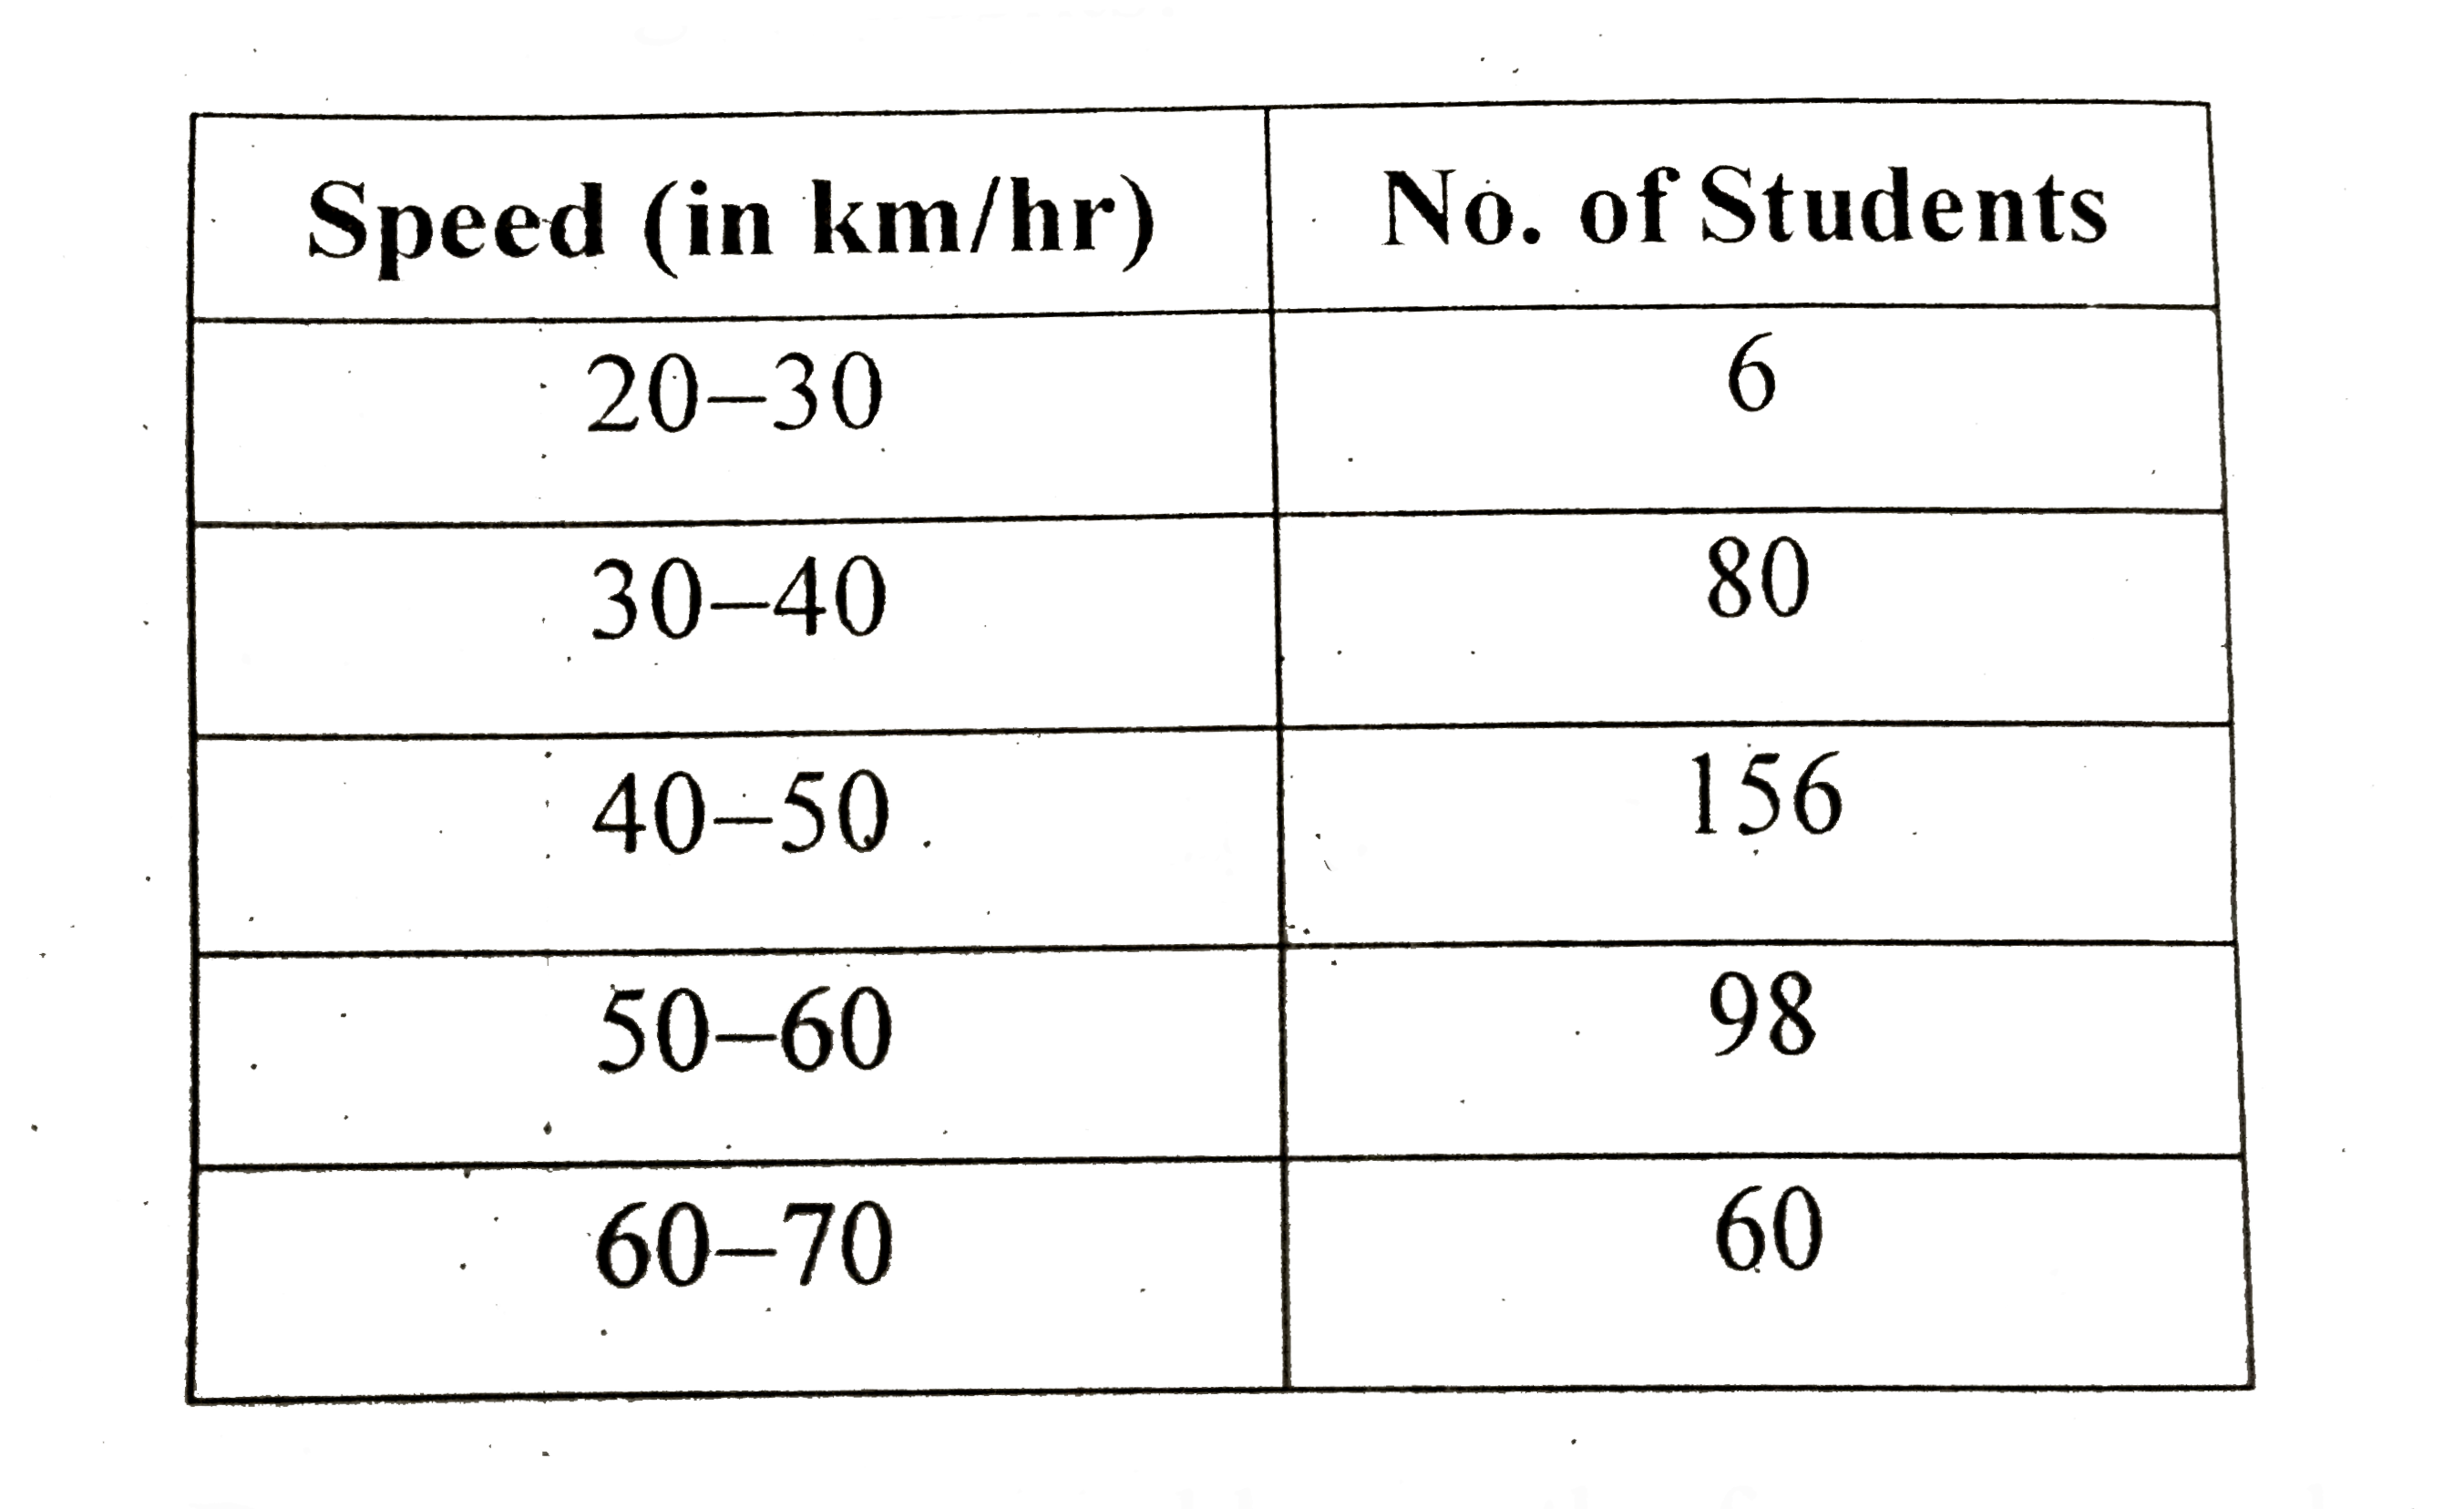
Given below is the frequency distribution of driving speeds (in km/hour) of the vehicles of 400 college students:

Draw Histogram and hence the frequency polygon for the above data.
Step by step video & image solution for Given below is the frequency distribution of driving speeds (in km/hour) of the vehicles of 400 college students: Draw Histogram and hence the frequency polygon for the above data. by Maths experts to help you in doubts & scoring excellent marks in Class 10 exams.
Updated on:21/07/2023Topper's Solved these Questions
- ALGEBRA MARCH 2015BOOK - GURUKUL PUBLICATION - MAHARASHTRA PREVIOUS YEAR PAPERSCHAPTER - ALGEBRA MARCH 2015EXERCISE - Attempt any three of the following sub-questions:
5 Videos
- ALGEBRA JULY 2017BOOK - GURUKUL PUBLICATION - MAHARASHTRA PREVIOUS YEAR PAPERSCHAPTER - ALGEBRA JULY 2017EXERCISE - QUESTIONS
22 Videos
- ALGEBRA MARCH 2016BOOK - GURUKUL PUBLICATION - MAHARASHTRA PREVIOUS YEAR PAPERSCHAPTER - ALGEBRA MARCH 2016EXERCISE - Attempt any two of the following subquestions :
3 Videos
Similar Questions
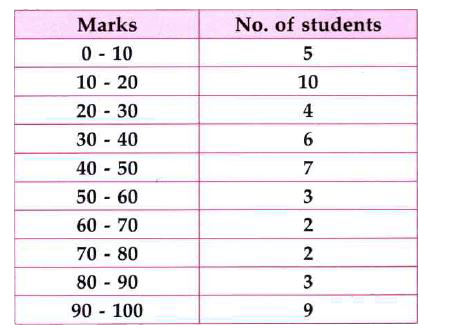
Prepare histogram and frequency polygon from the following data :

View SolutionDraw histogram and frequency polygon for the following distribution :

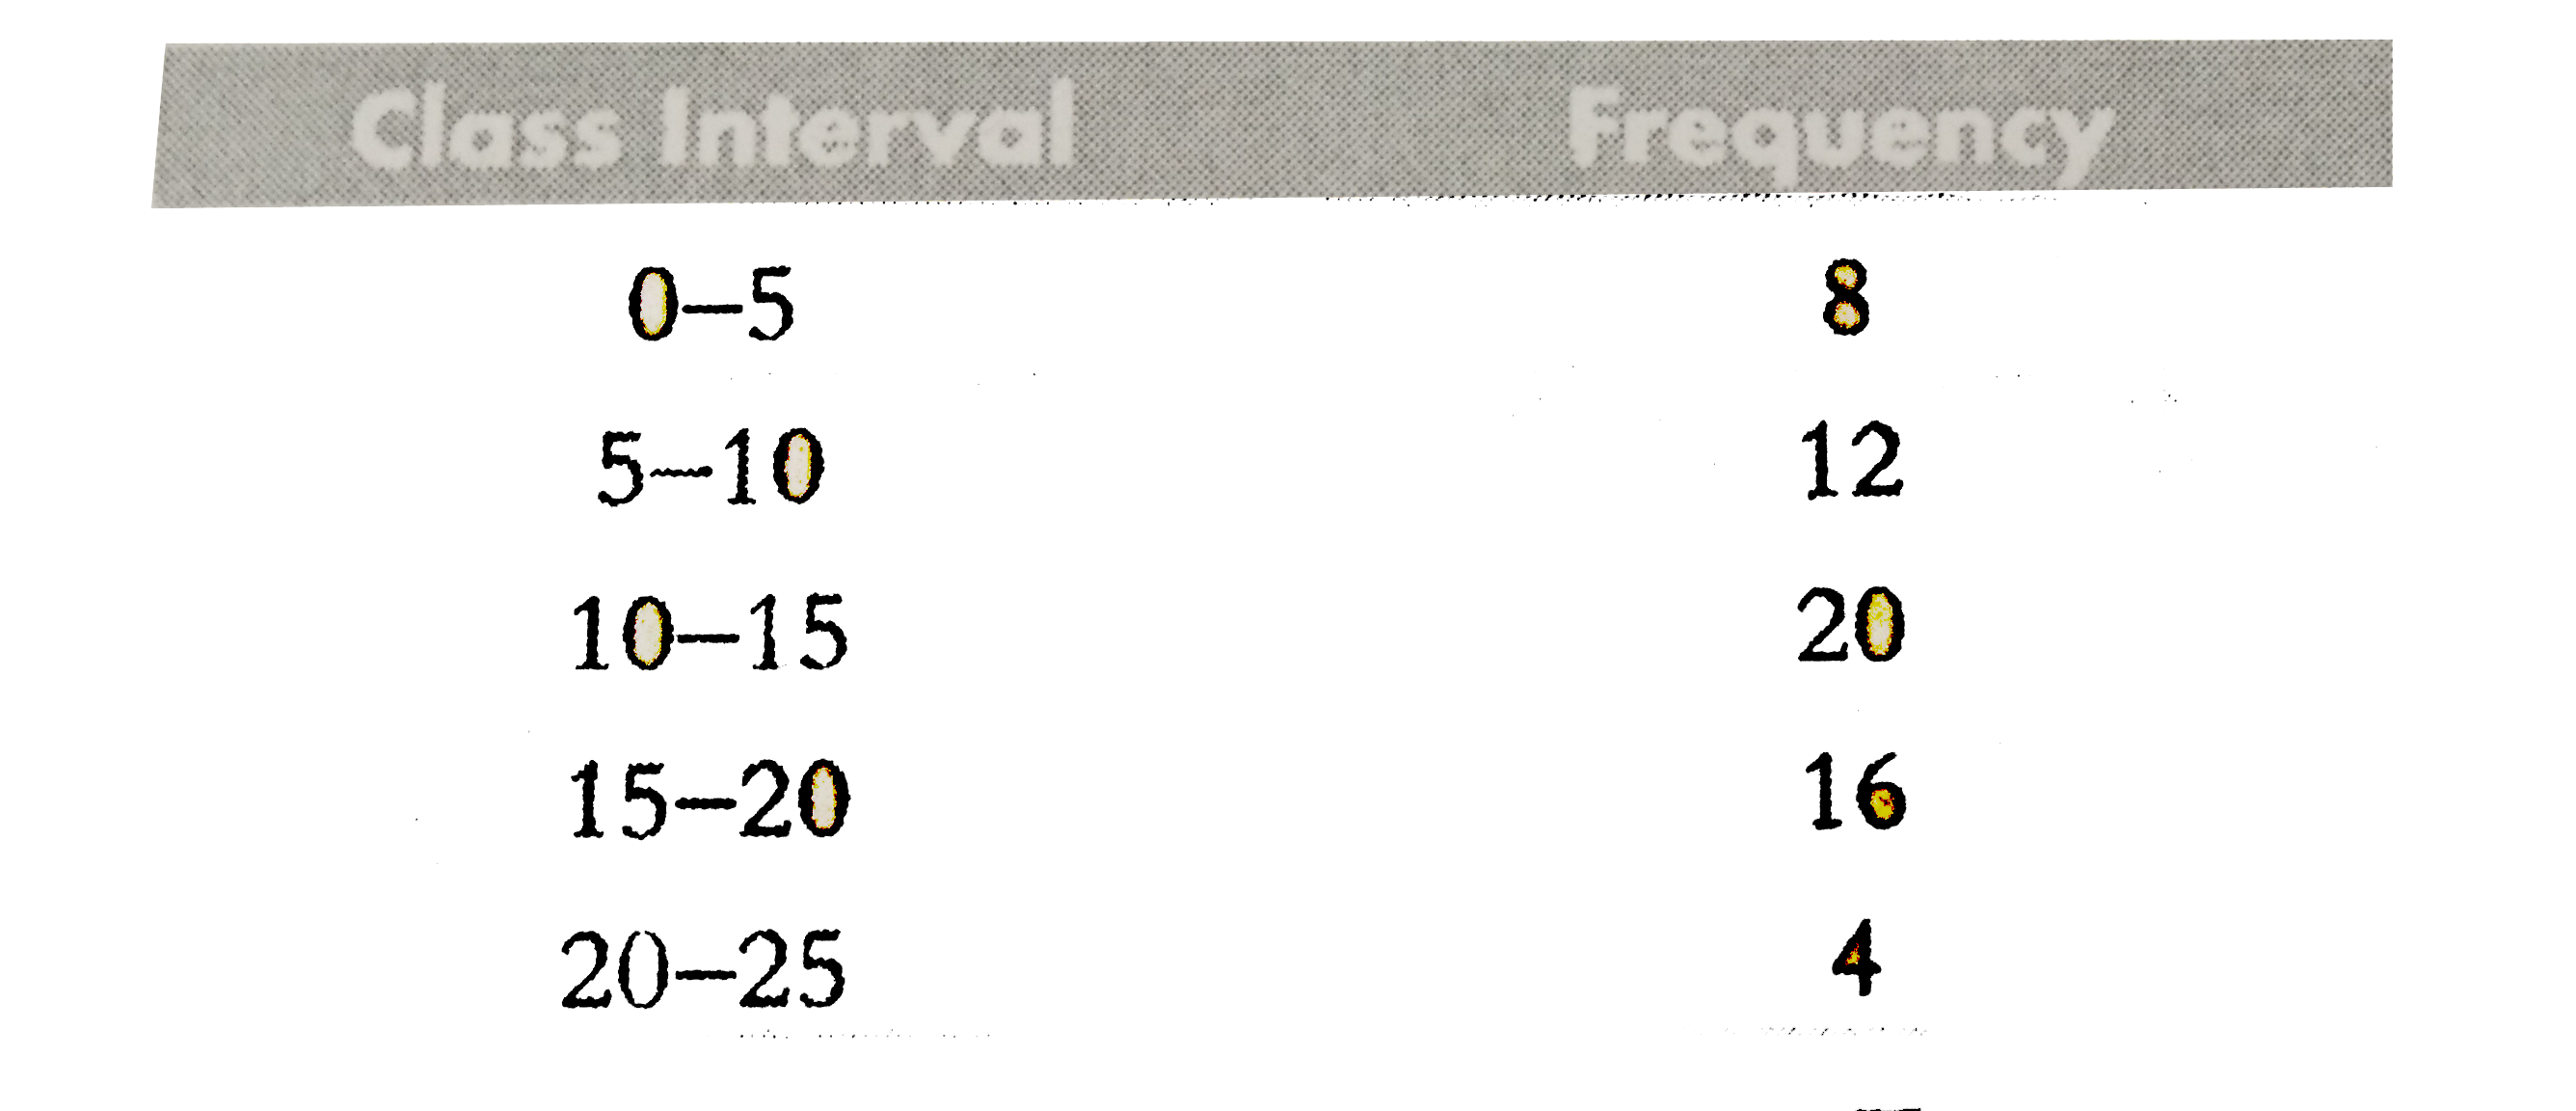
View SolutionDraw the frequency polygon to represent the following data.

View SolutionDraw a frequency polygon to represent the following data.

View SolutionFor the following data, draw a histogram and a frequency polygon

View SolutionDraw a histogram for the frequency distribution of the following data:

View SolutionDraw a histogram for the frequency distribution of the following data:

View SolutionDraw the frequency polygon for the following distribution :

View SolutionFollowing table shows a frequency distribution for the speed of cars passing through at a particular spot on a high way.

Draw a histogram and frequency polygon representing the data above.
View SolutionDraw a histogram, a frequency polygon and frequency curve of the following data :

View Solution
