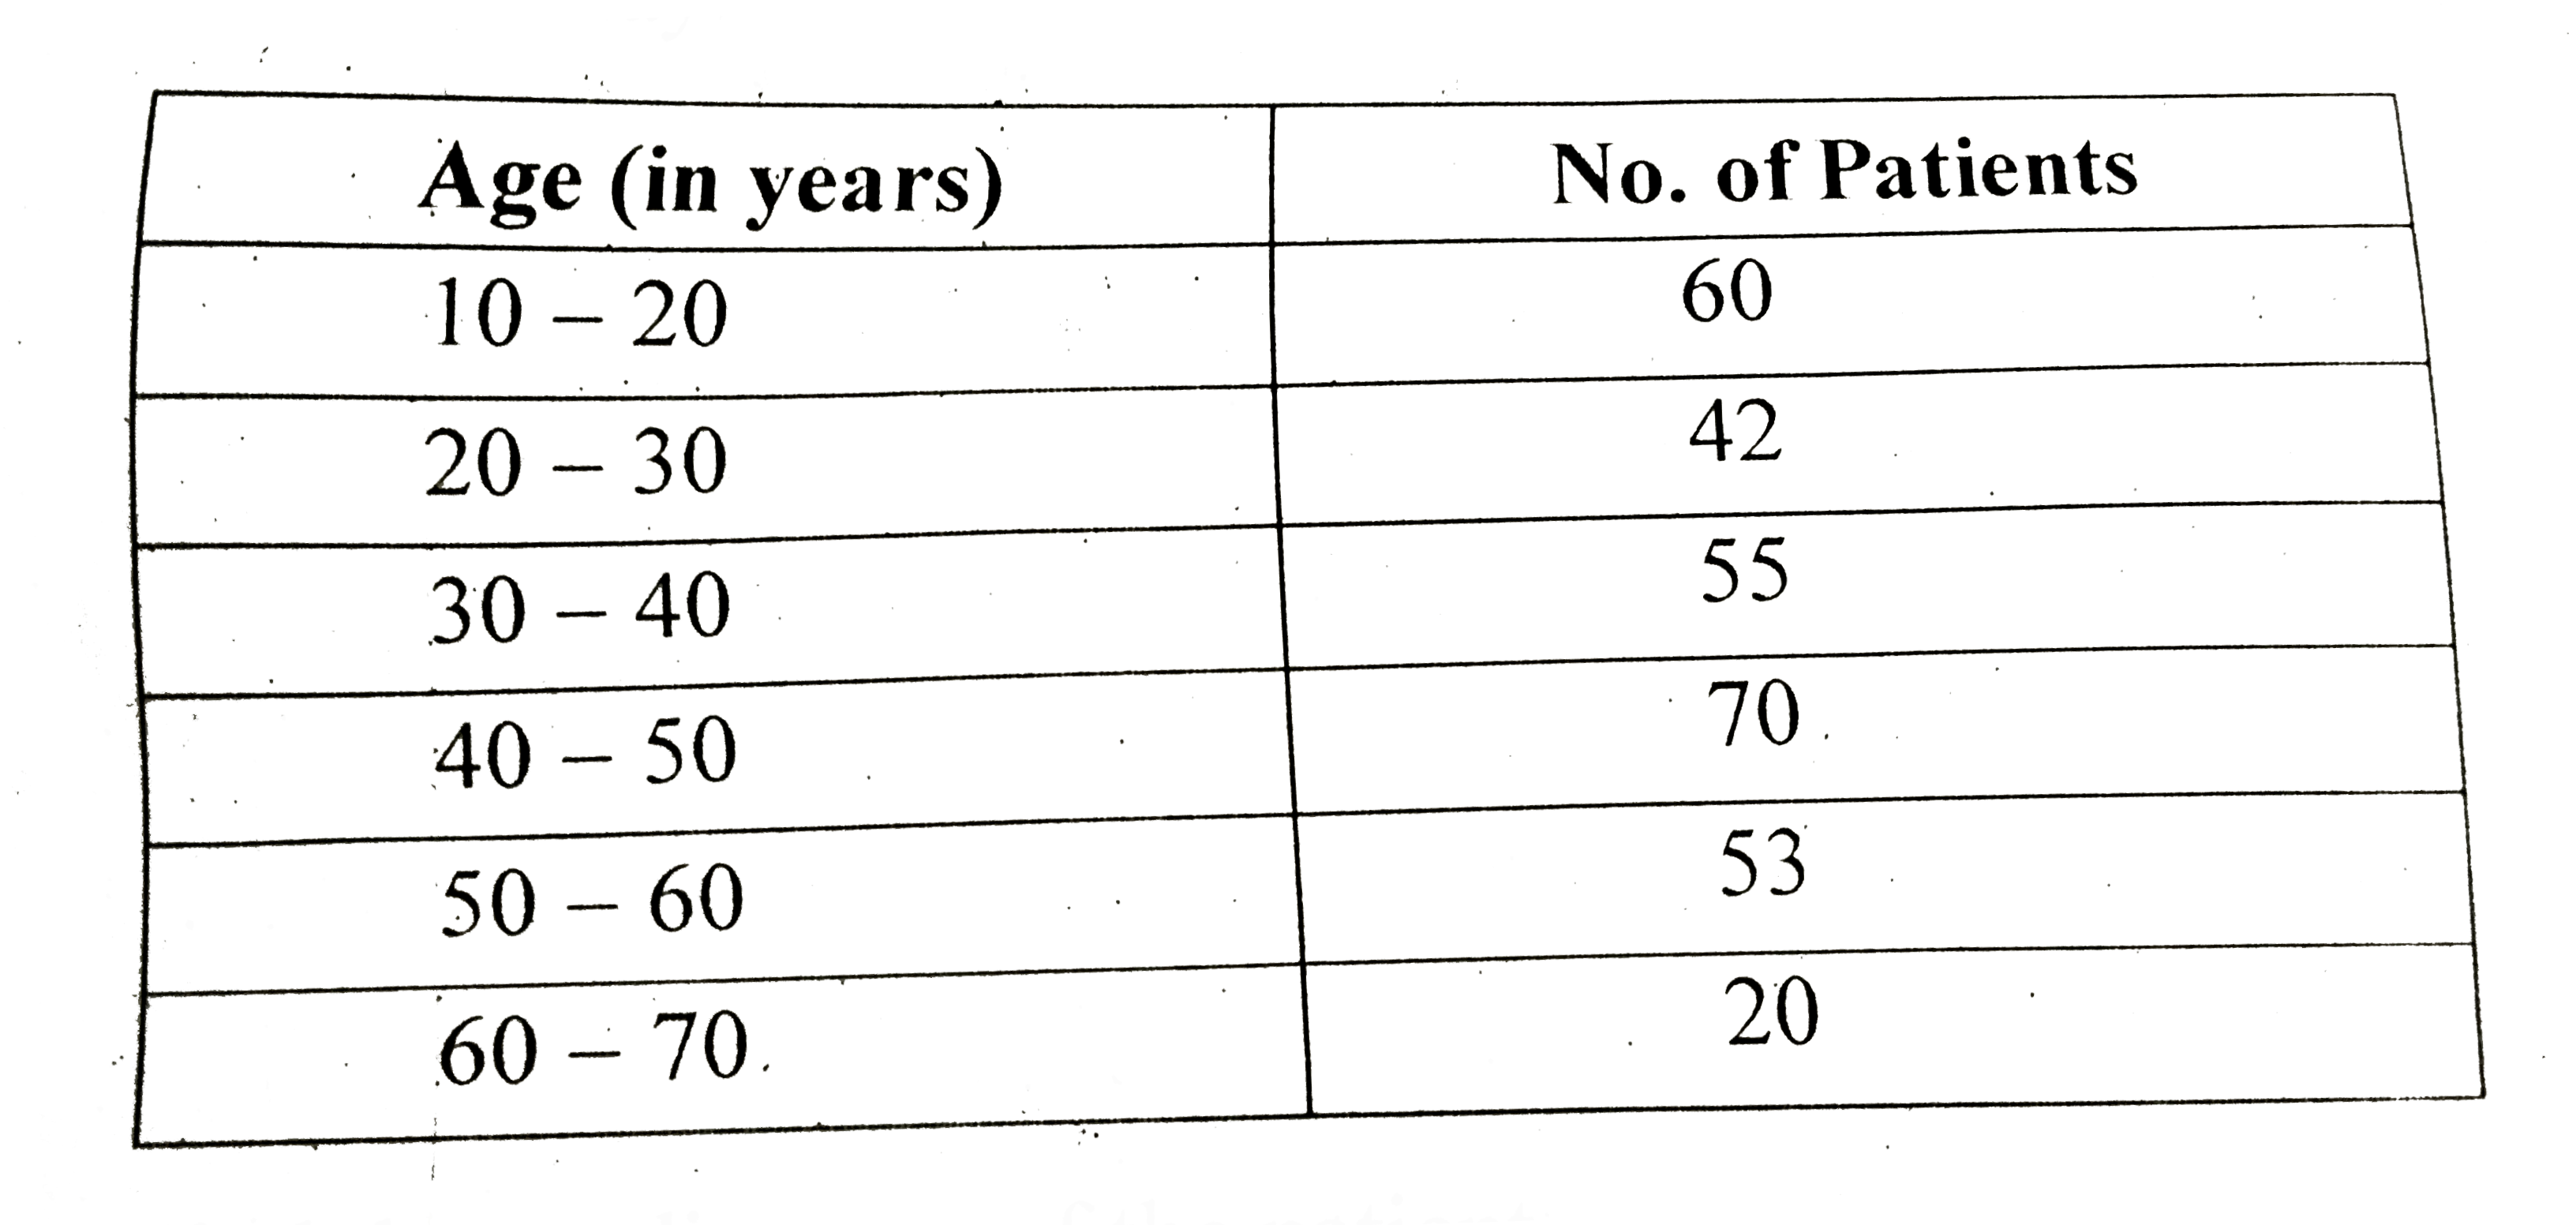
The following frequency distribution table gives the ages of 200 patients treated in a hospital in a weak. Find the mode of ages of the patients.

The correct Answer is:12.31 years
Step by step video & image solution for The following frequency distribution table gives the ages of 200 patients treated in a hospital in a weak. Find the mode of ages of the patients. by Maths experts to help you in doubts & scoring excellent marks in Class 10 exams.
Topper's Solved these Questions
- BOOK - TARGET PUBLICATIONCHAPTER - STATISTICSEXERCISE - Practise Set 6.44videos
STATISTICS
- BOOK - TARGET PUBLICATIONCHAPTER - STATISTICSEXERCISE - Practise Set 6.52videos
STATISTICS
- BOOK - TARGET PUBLICATIONCHAPTER - STATISTICSEXERCISE - Practise Set 6.24videos
STATISTICS
- BOOK - TARGET PUBLICATIONCHAPTER - SIMILARITY EXERCISE - Chapter Assessment19videos
SIMILARITY
- BOOK - TARGET PUBLICATIONCHAPTER - TRIGONOMETRY EXERCISE - Chapter Assessment18videos
TRIGONOMETRY
Similar Questions
The following frequency distribution table gives the ages of 200 patients treated in a hospital in a week. Find the mode of ages of the patients.
 View Solution
The following frequency distribution table given the ages of 200 patients treated in a hospital in a week.Find the mode of ages of the pateints.
 View Solution
The following frequency dsitribution table gives the ages of 80 patients treated in a hospital during a month. Find the mode of the ages of the patients.
 View Solution
The following table shows ages of 300 patients getting medical treatment in a hospital on a particular day:

Find the median age of the patient.View SolutionThe following table shows the ages of the patients admitted in a hospital during a year:Find the mode and the mean of the data given above. Compare and interpret the two measures of central tendency.
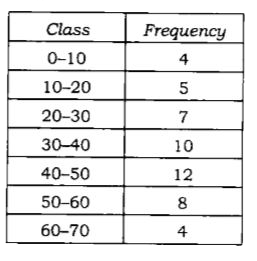
View SolutionConsider the following frequency distribution

What is the mode of the distribution?View SolutionThe following frequency distribution table shows the classification of the number of vehicles and the volume of petrol filled in them. Find the mode of the volume.
 View Solution
The ages (in years) of 360 patients treated in a hospital on a particular day are given below:

Draw a histogram for the given data.View SolutionThe mode of following frequency distribution is 36 . Find the missing frequency (f) .
 View Solution
The following table shows the number of patients of differents age groups admitted to a hospital for treatement on a day. Find the median age of the patients.
 View Solution

