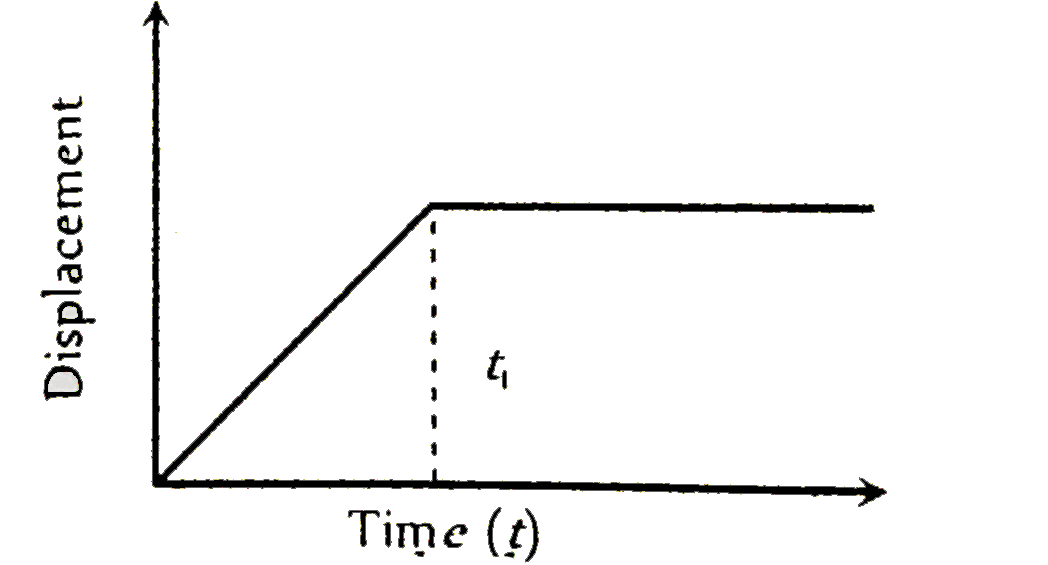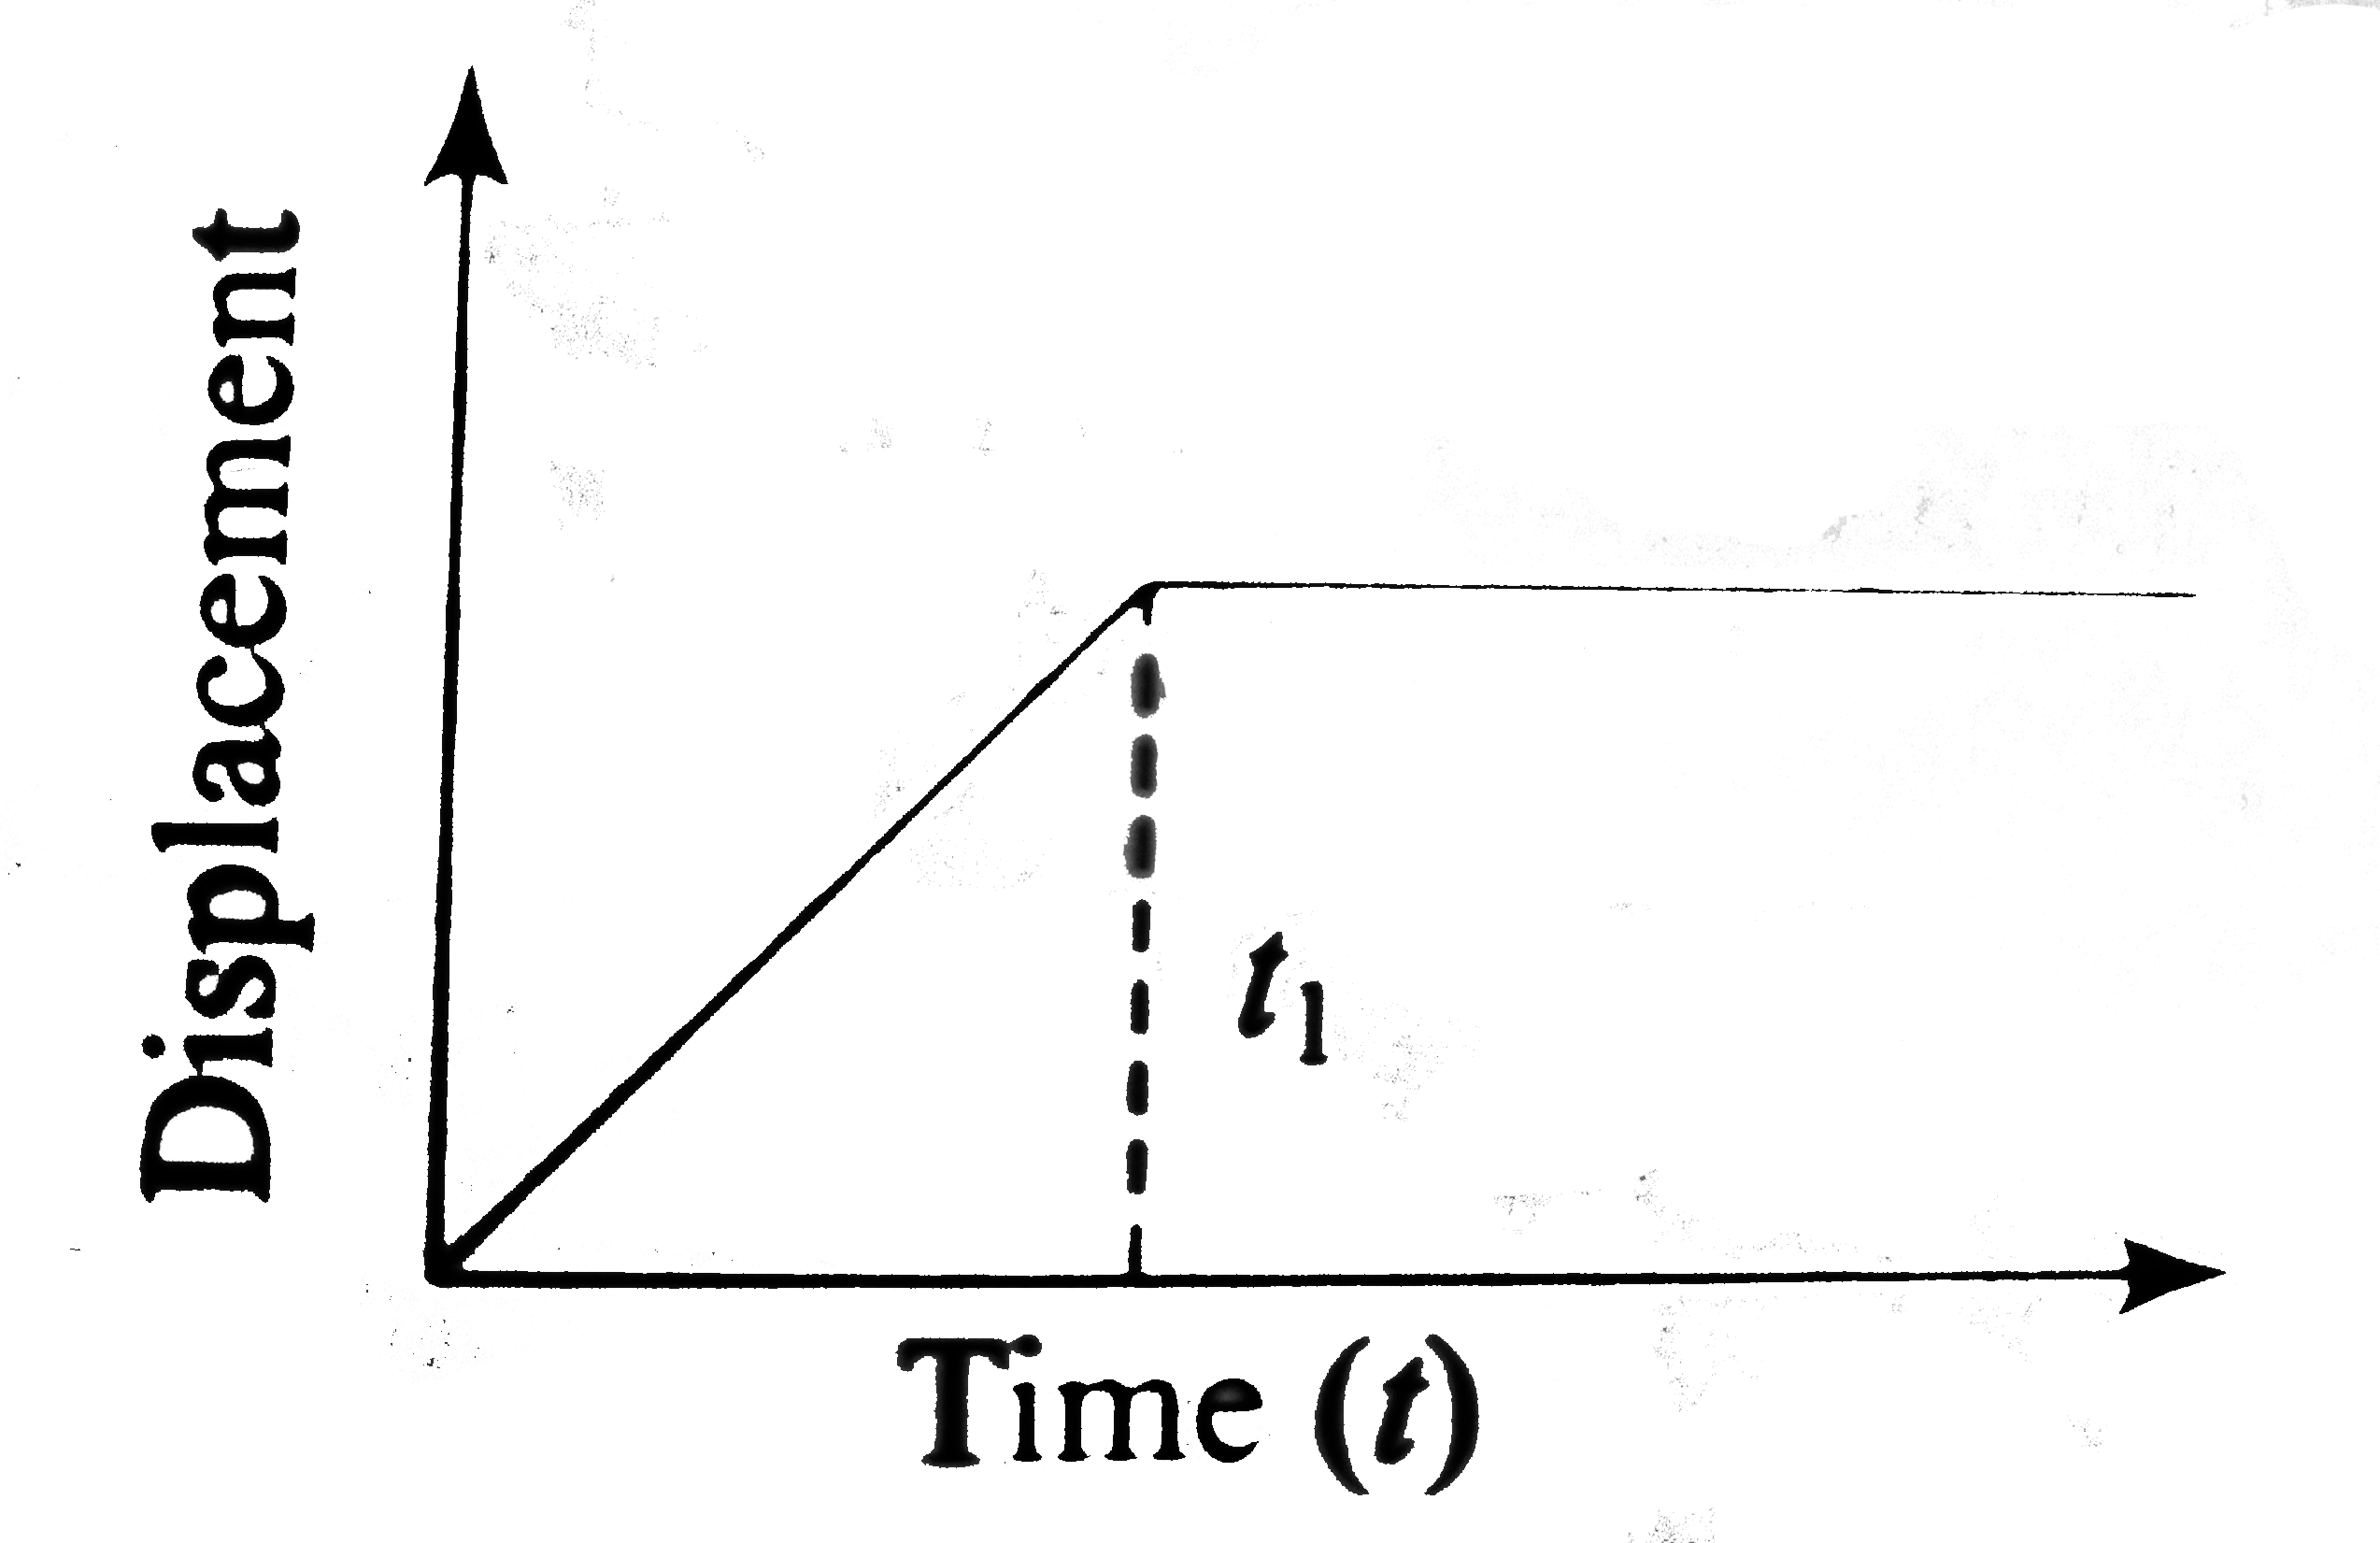
The x-t graph shoen in figure reprents
A
Constant velocity
B
velocity of the body is continuously changing
C
instantaneous velocity
D
the body travels with constant speed upto time t1 and then stops
Video Solution
Text Solution
The correct Answer is:D
up to time t1 slope of the graph is constant and after t1 slope is zero i.e. the body travels with constant speed up to time t1 and then stops.
|
Updated on:21/07/2023
Similar Questions
Knowledge Check
- Question 1 - Select One
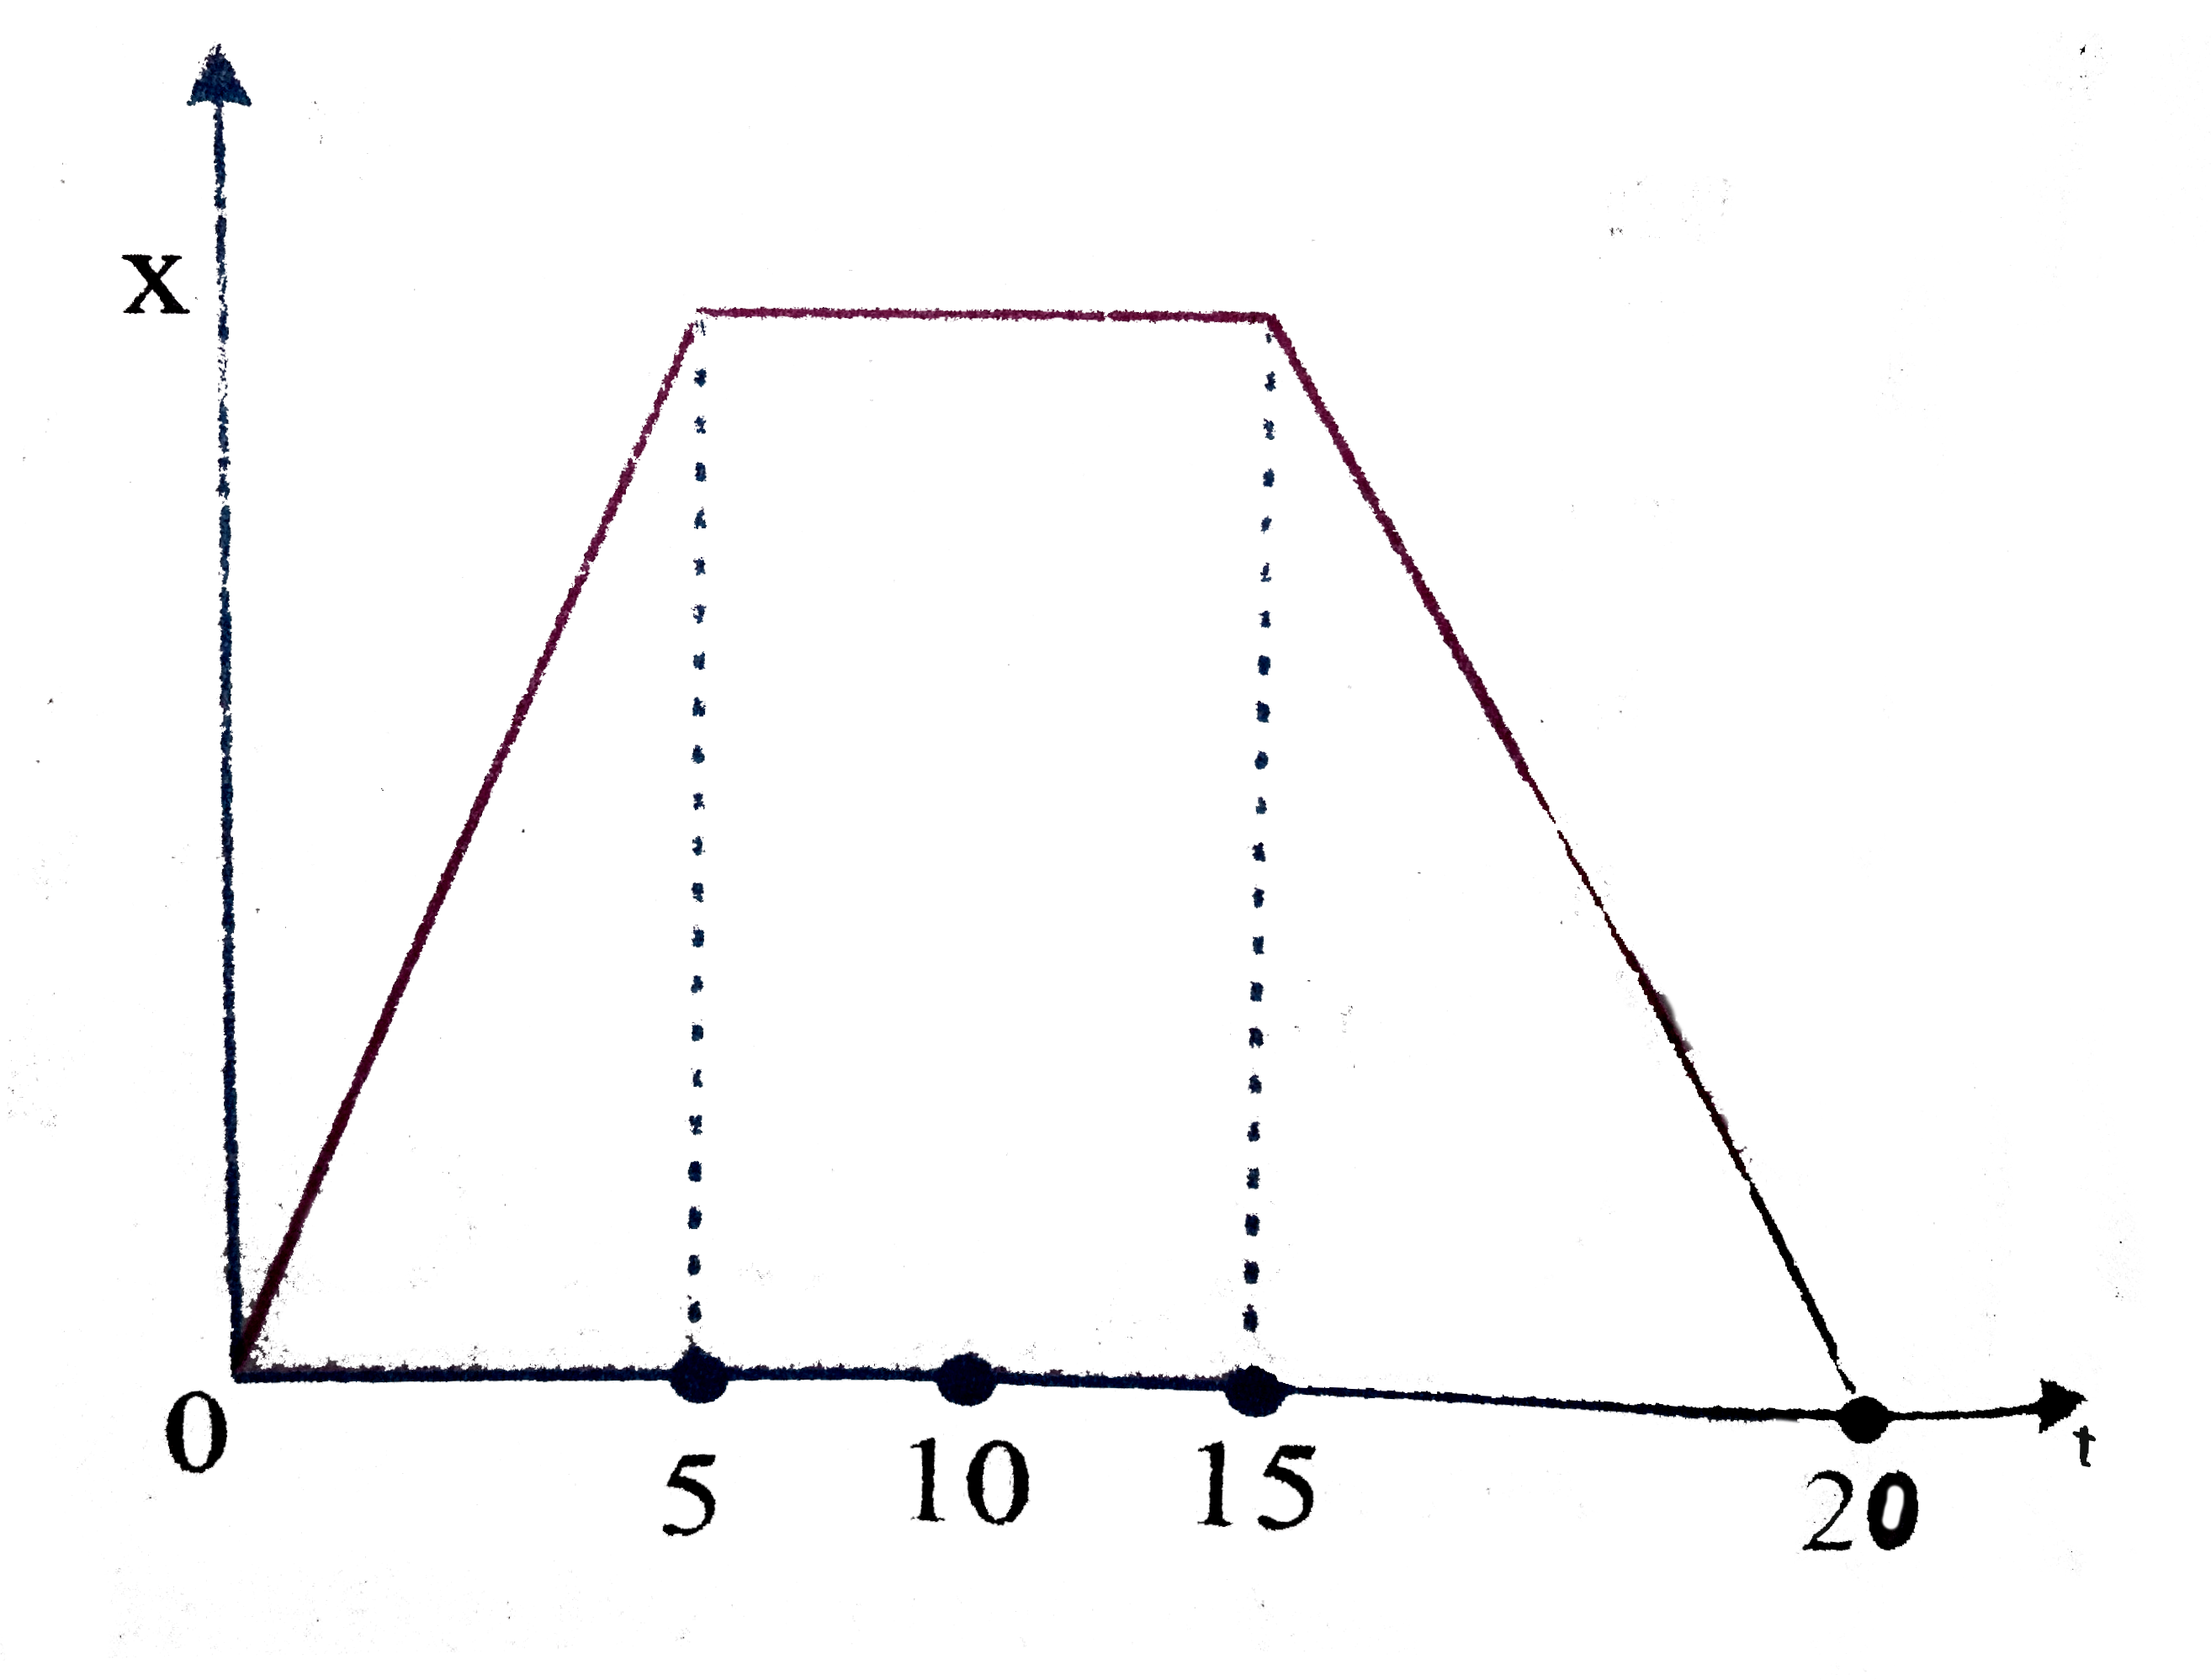
Figure shows the displacement tiime (x-t) graph of a body moving in a straight line which one of the graph shown in figure represents the velocity- time (v-t) graph of the motion of the body.A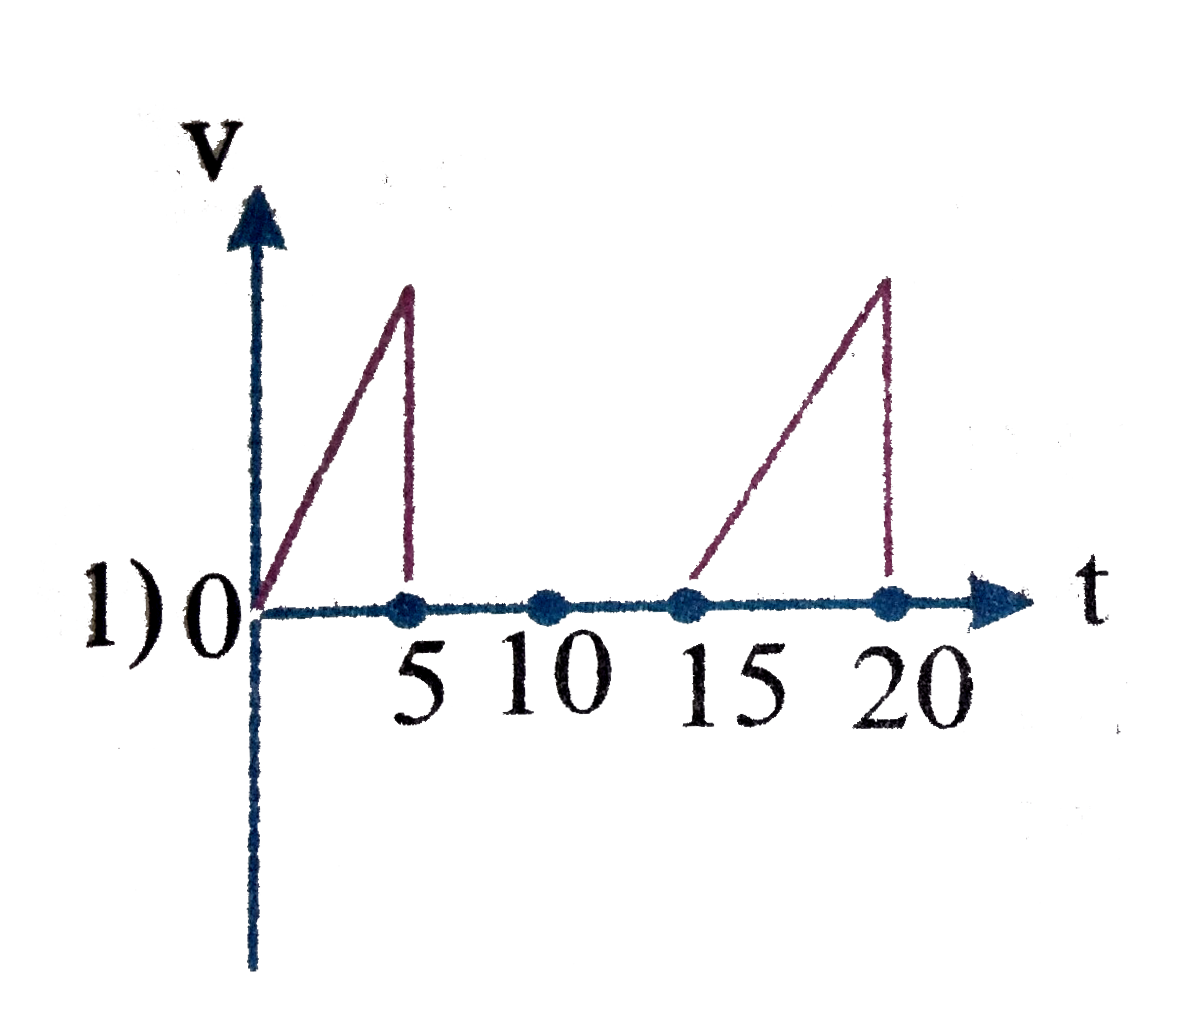 B
B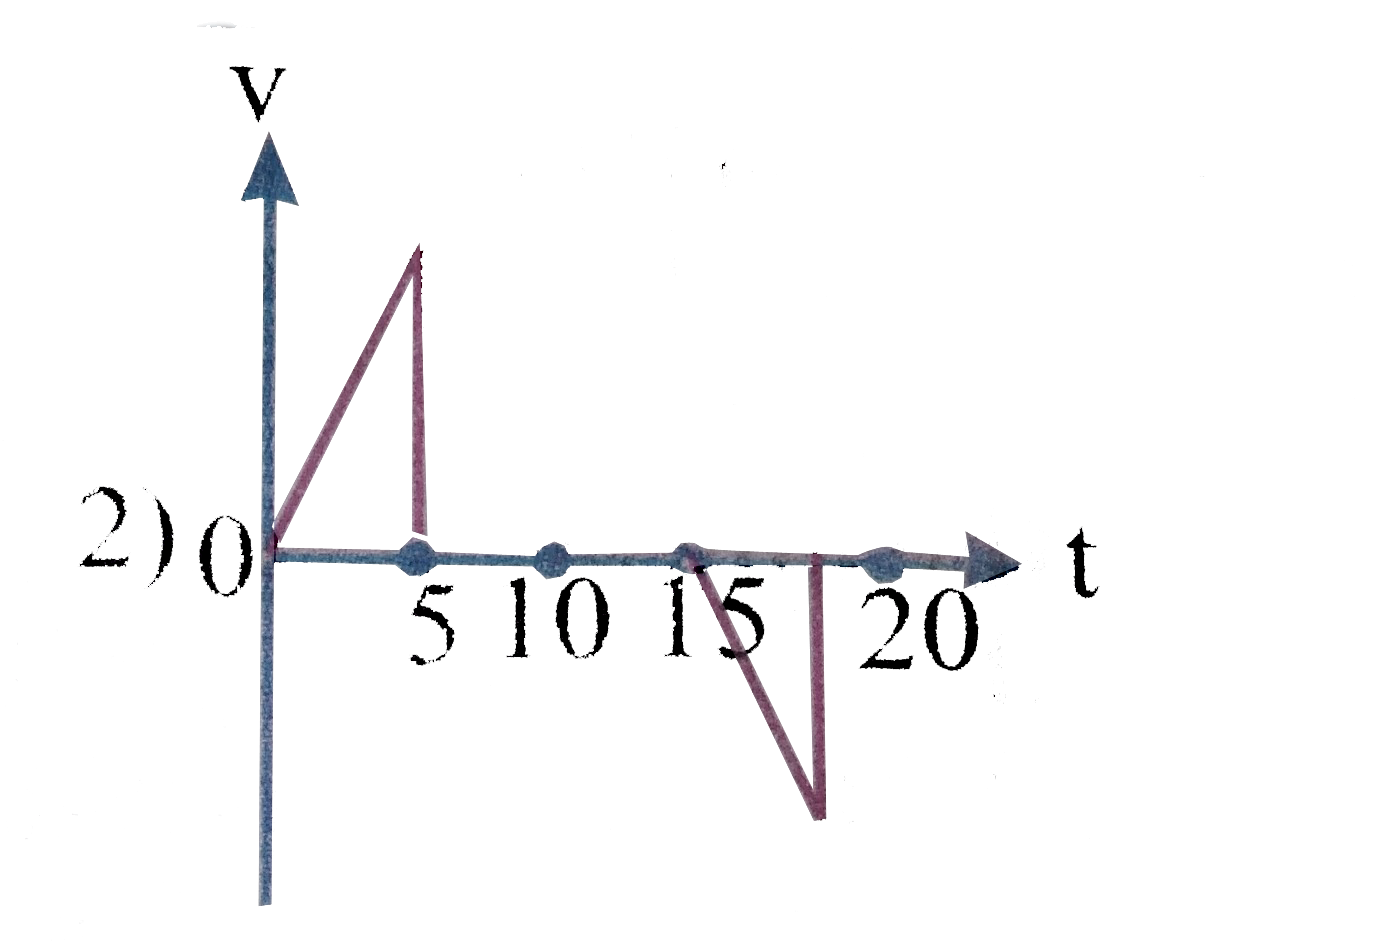 C
C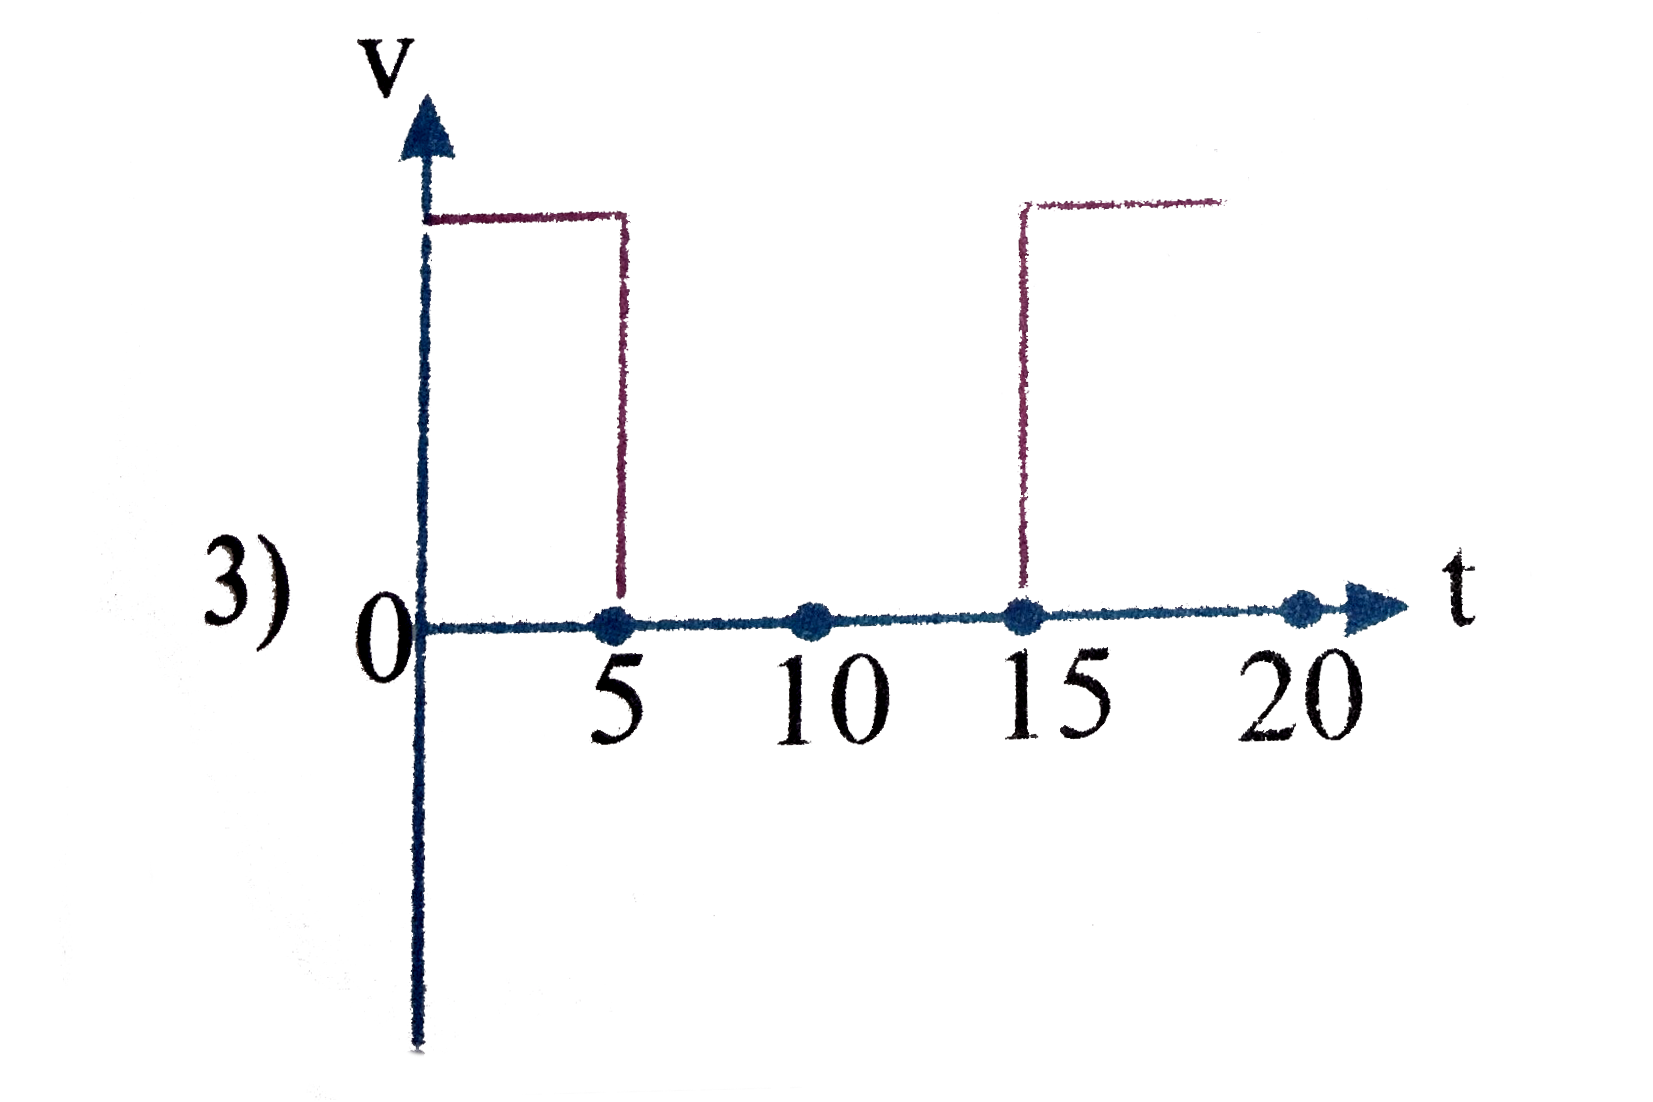 D
D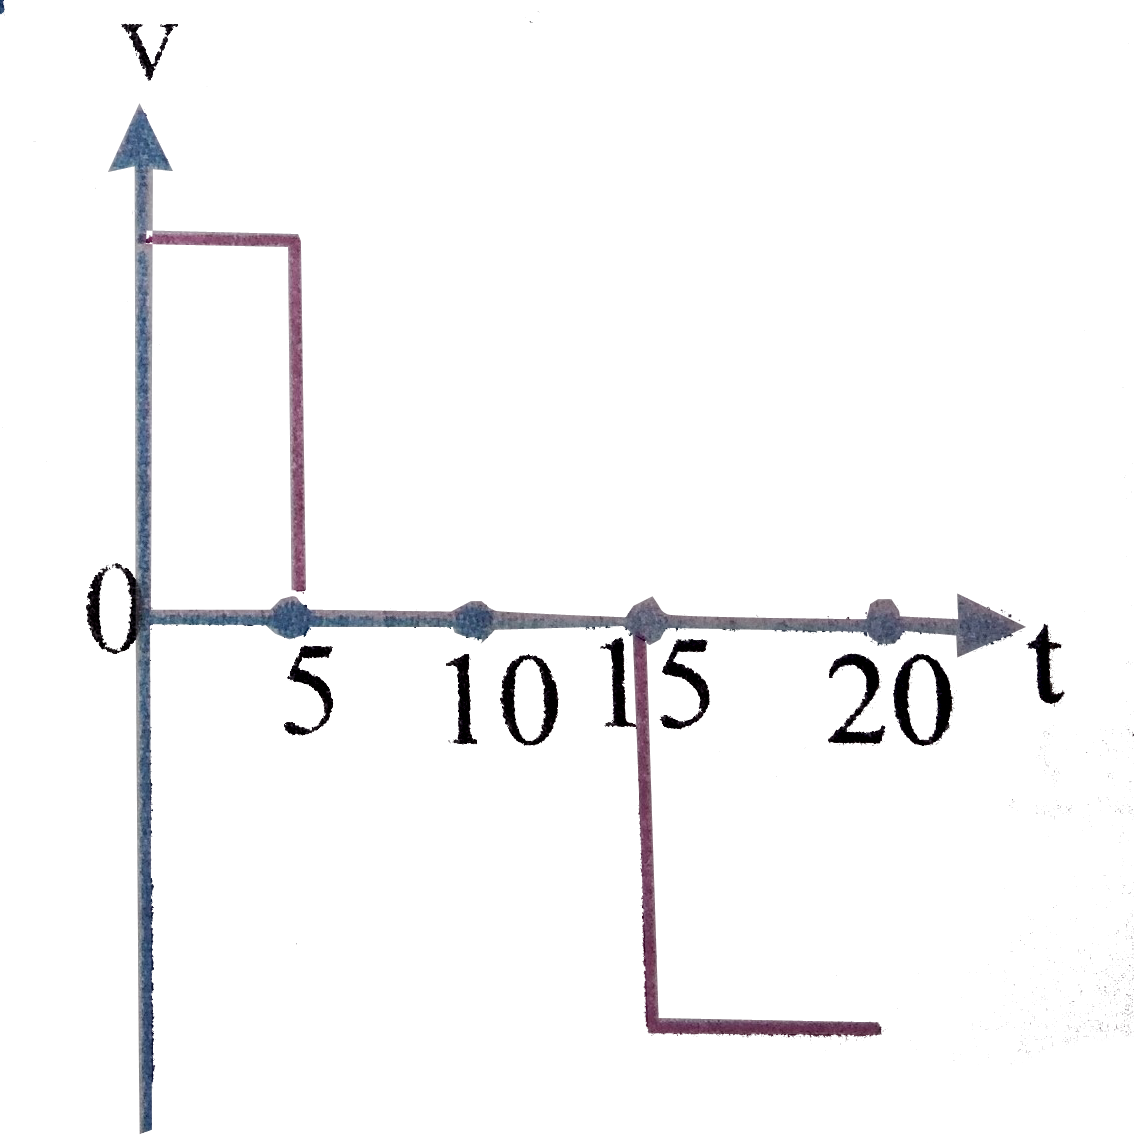
- Question 2 - Select One
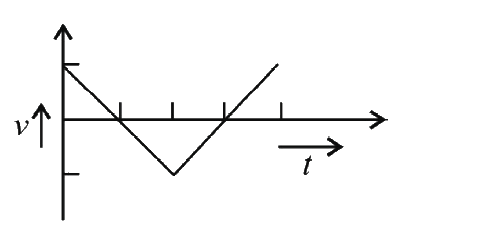
The graph in figure shows the velocity v versus time t for a body. Which of the graphs shown in figure represents the corresponding acceleration versus time graphs ?
 A
A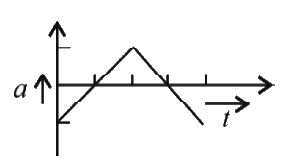 B
B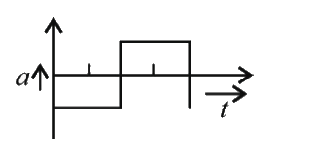 C
C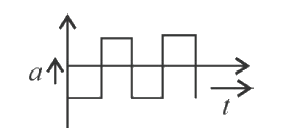 D
D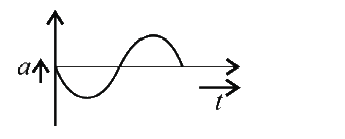
- Question 3 - Select One
Assertion : In the s-t graph as shown in figure, velocity of particle is negative and acceleration is positive.
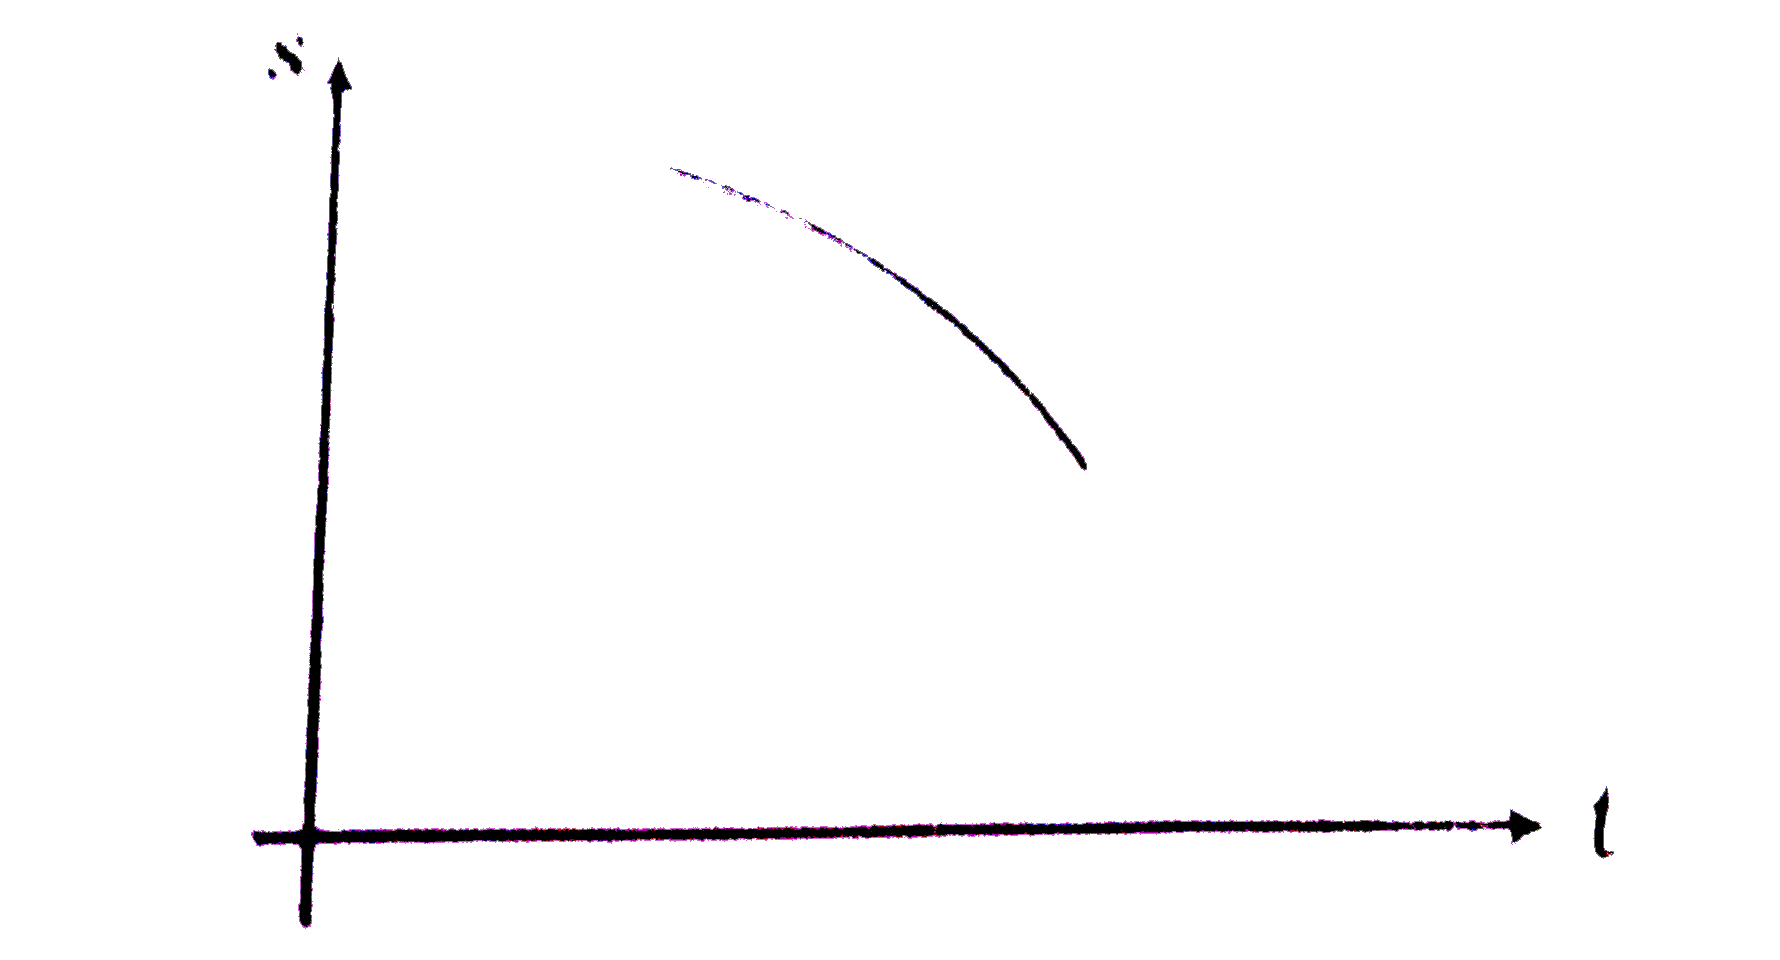
Reason : Slope of s-t graph is negative and increasing in magnitude.AIf both Assertion and Reason are correct and Reason is the correct explanation of assertion.BIf both Assertion and Reason are correct but Reason in not the correct explanation of Assertion.CIf Assertion is true but Reason is false.DIf Assertion is false but Reason is true.
In the V-T graph shown in figure match the following.
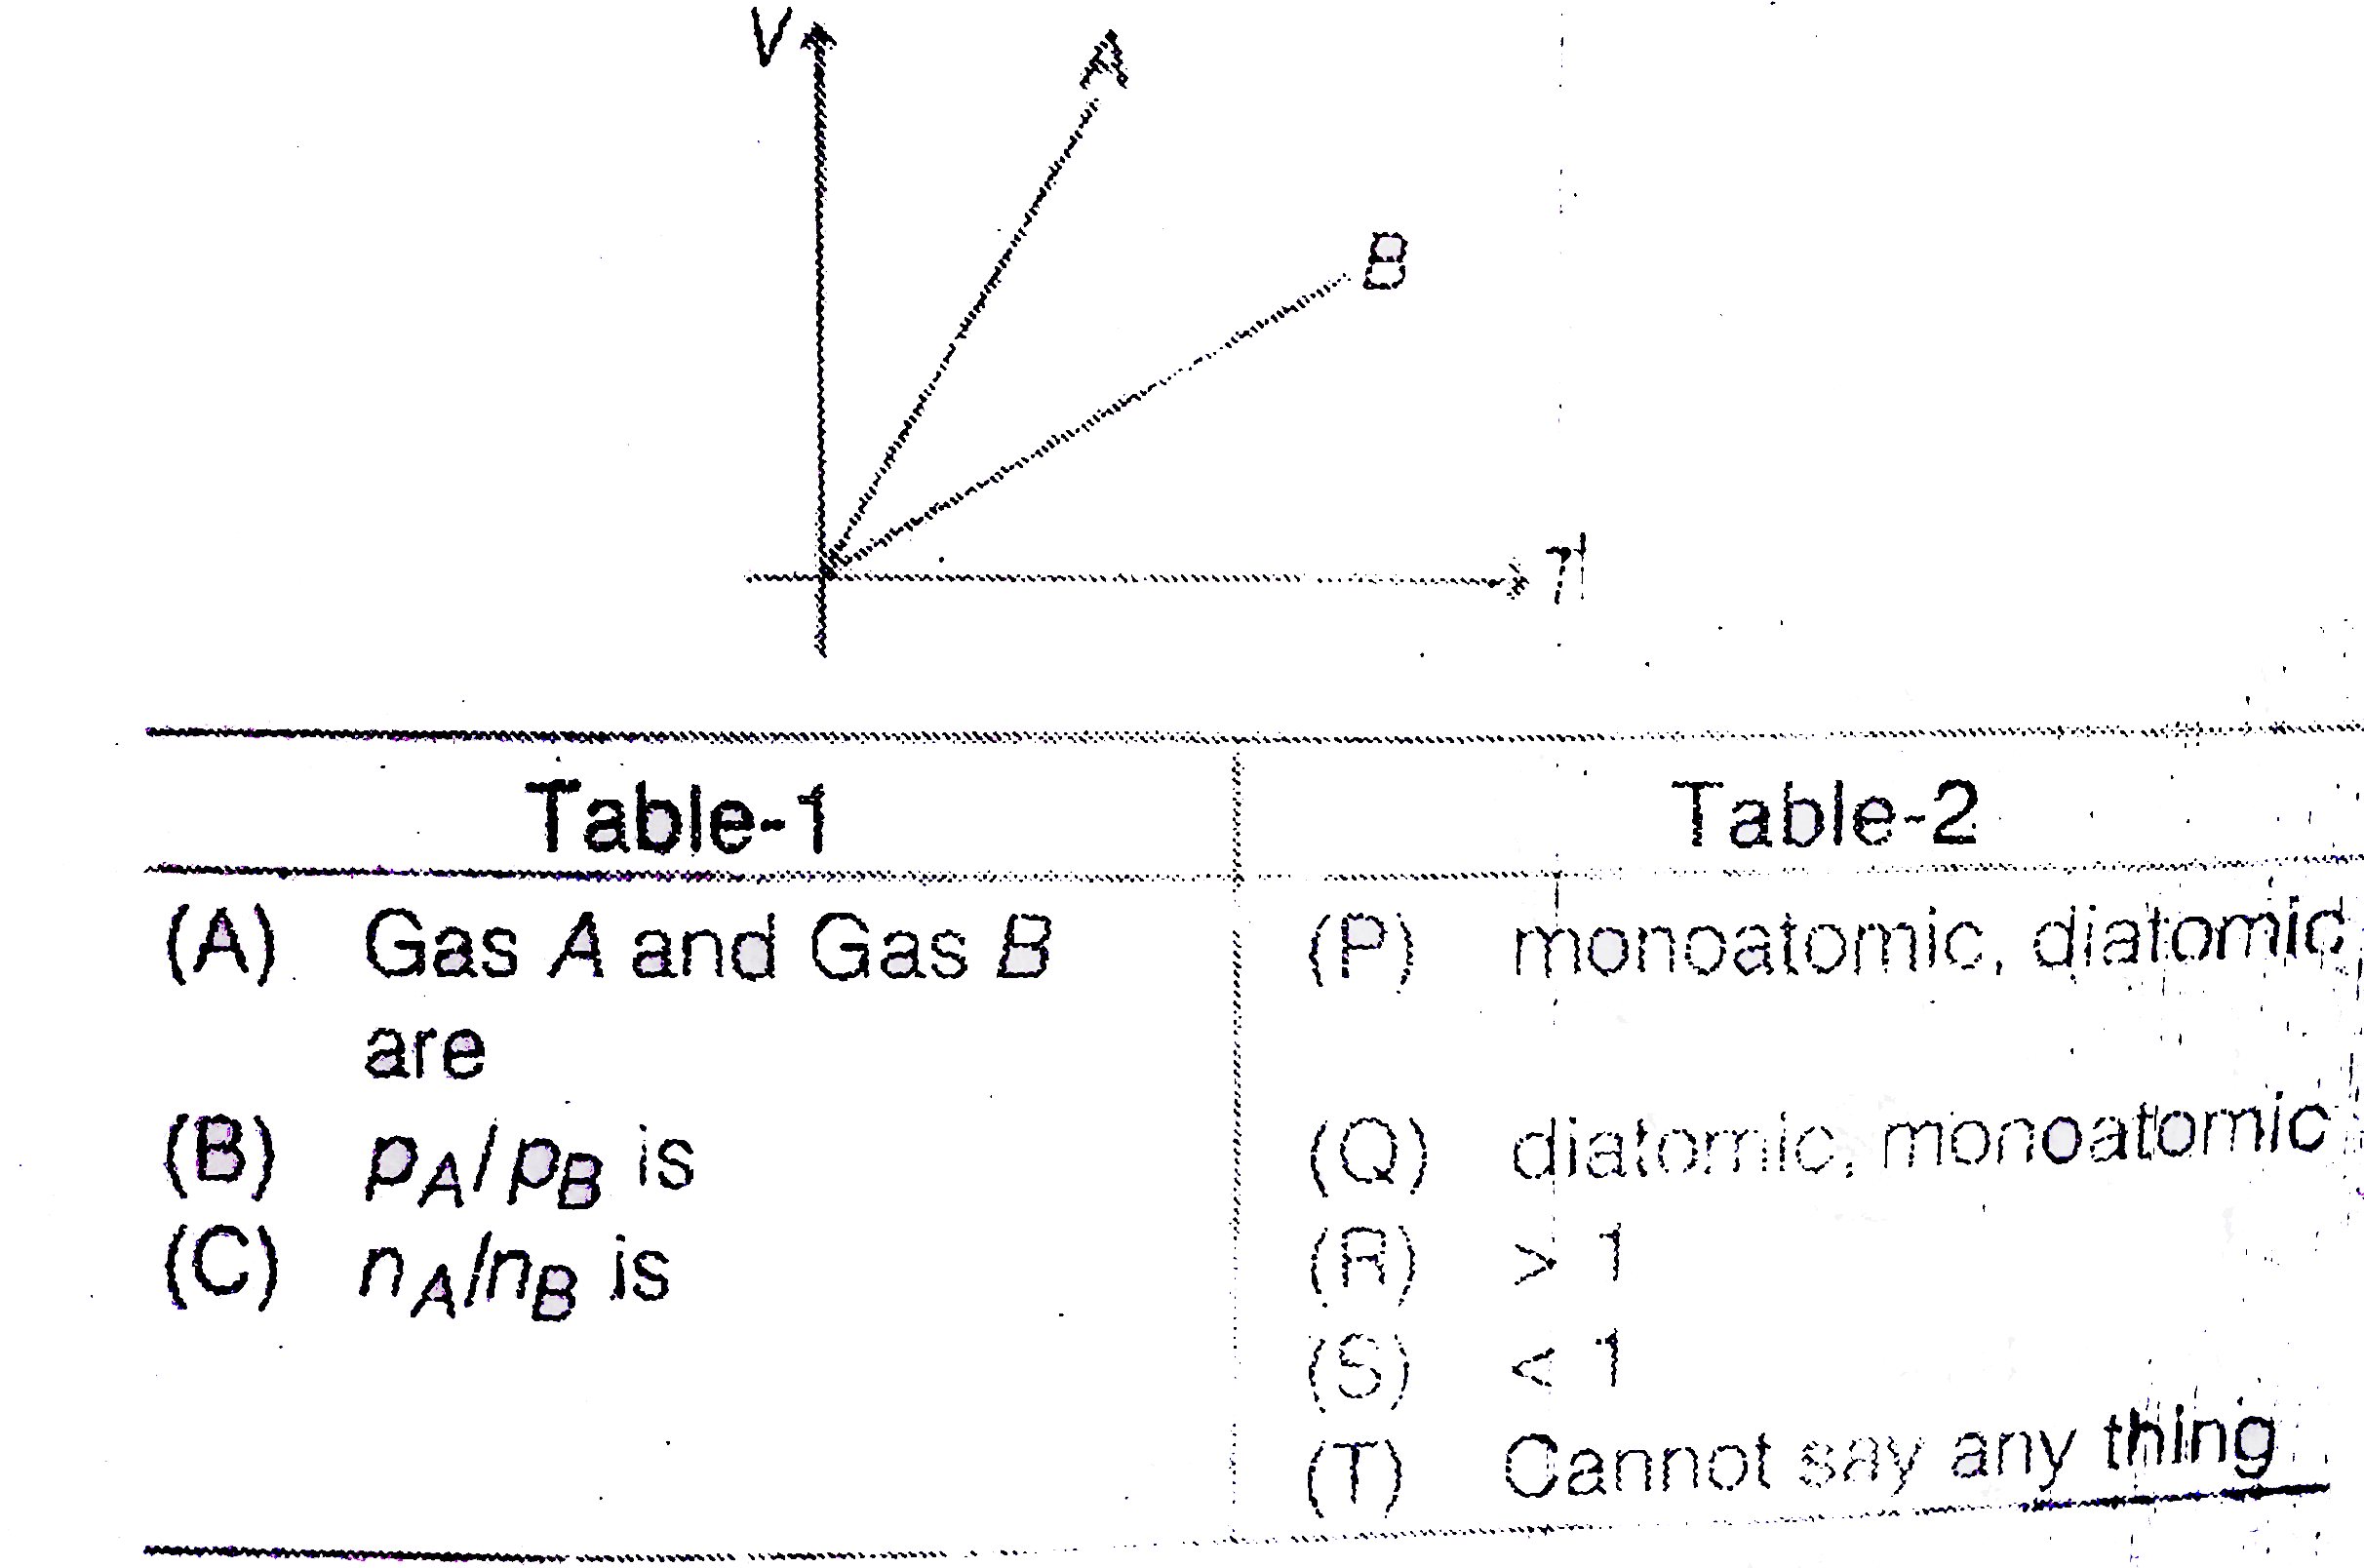 View Solution
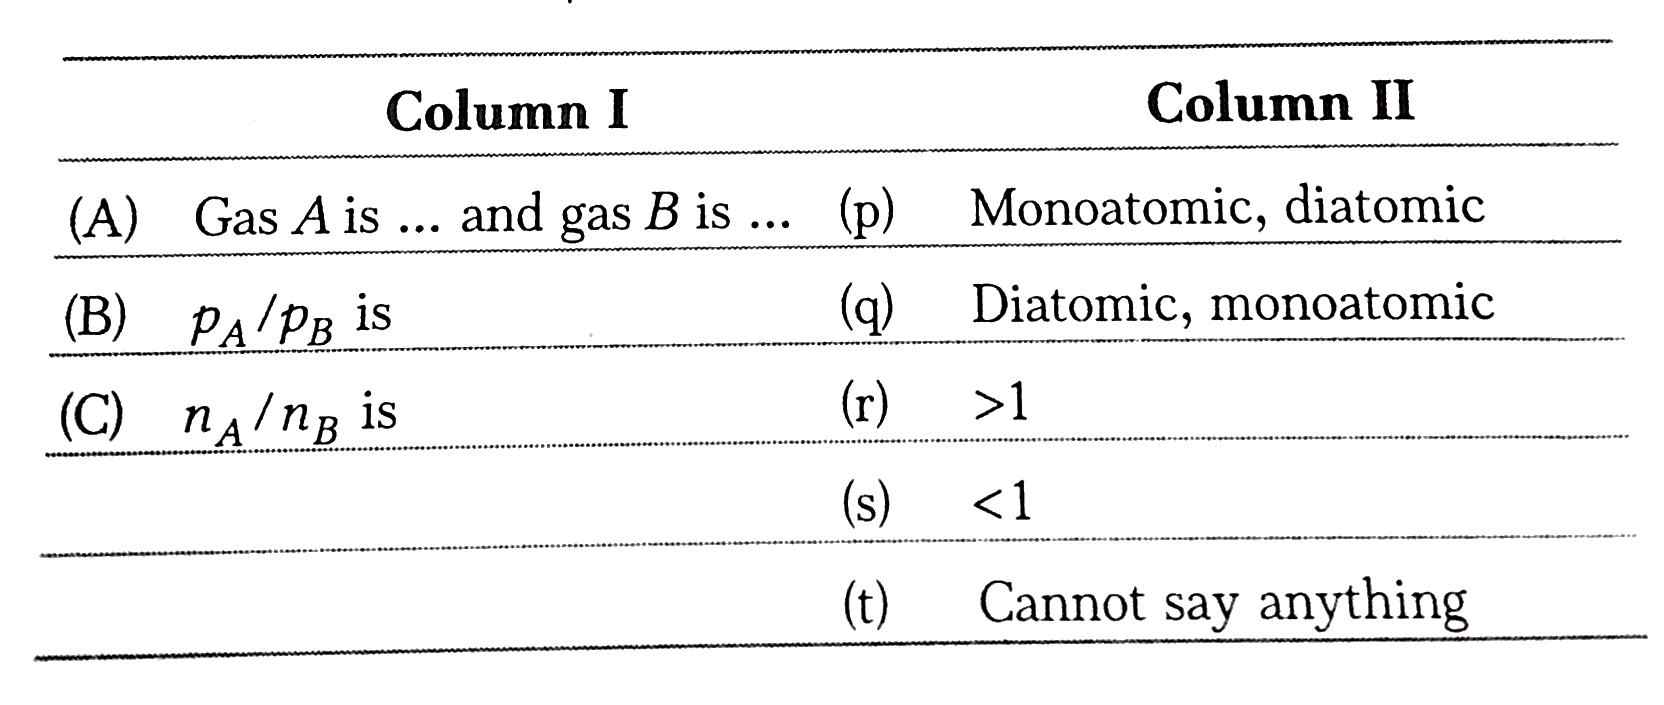
In the V-T graph shown in the figure match the following columns.
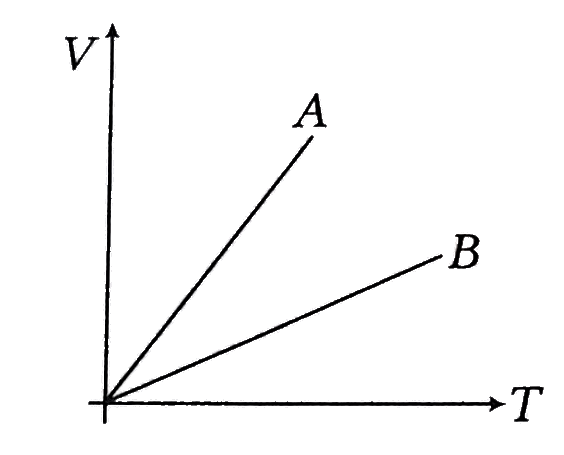
 View Solution
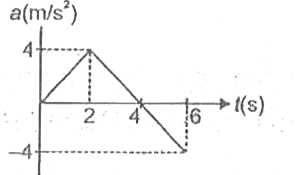
For the acceleration - time (a - t) graph shown in figure, the change in velocity of particle from t = 0 to t = 6 s is
 View Solution
The x−t graph of a particle undergoing simple harmonic motion is shown in figure. Acceleration of particle at t=4/3s is
 View Solution
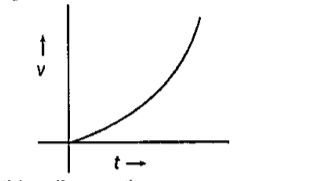
From the given v-t graph (see figure ), It can be inferred that the object is
 View Solution


