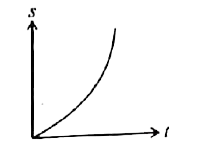
s-t graph shown in figure is a parabola. From this graph we find that :
 Solution in Tamil
the body is moving with uniform velocity
the body is moving with uniform speed
the body is starting from rest and moving with uniform acceleration
the body is not moving at all
The correct Answer is:C
Step by step video, text & image solution for s-t graph shown in figure is a parabola. From this graph we find that : by Physics experts to help you in doubts & scoring excellent marks in Class 11 exams.
Topper's Solved these Questions
- BOOK - PREMIERS PUBLISHERSCHAPTER - KINEMATICS EXERCISE - Other important questions & answers (II. Very short answer questions).112videos
KINEMATICS
- BOOK - PREMIERS PUBLISHERSCHAPTER - KINEMATICS EXERCISE - Other important questions & answers (III. Short answer questions).26videos
KINEMATICS
- BOOK - PREMIERS PUBLISHERSCHAPTER - KINEMATICS EXERCISE - Textbook questions & answers (IV. Numerical problems).48videos
KINEMATICS
- BOOK - PREMIERS PUBLISHERSCHAPTER - GRAVITATIONEXERCISE - OTHER IMPORTANT QUESTION & ANSWERS (CONCEPTUAL QUESTIONS)34videos
GRAVITATION
- BOOK - PREMIERS PUBLISHERSCHAPTER - KINETIC THEORY OF GASESEXERCISE - OTHER IMPORTANT QUESTIONS & ANSWERS (VI. Conceptual Questions.)8videos
KINETIC THEORY OF GASES
Similar Questions
What is Kinematics?
02:14View SolutionWrite note on function with example.
06:08View SolutionThe position vectors particle has length 1m and makes 30∘ with the x-axis. What are the lengths of the x and y components of the position vector?
06:08View SolutionWhy a body weighs less at the equator than at the poles?
00:46View SolutionWhen an automobile travels for a long distance , the air pressure in the tyres increases slightly . Why ?
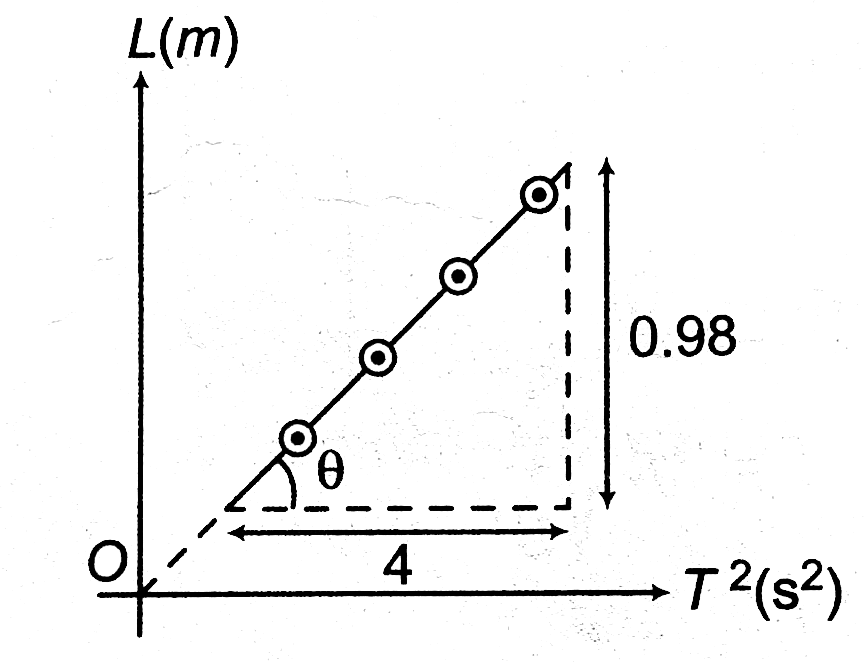
03:34View SolutionFor different values of L, we get different values of T2. The graph between L versus T2 ia as shown in figure. Find the value of 'g' from the given graph.(Take (π)2=10).
 .03:29View Solution
The x-t graph of a particle moving along a straight line is shown in figure

The v-t graph of the particle is correctly shown by02:09View SolutionThe x-t graph of a particle moving along a straight line is shown in figure The a-t graph of the particle is correctly shown by
02:27View SolutionThe x-t graph of particle moving along a straight line is shown in figure The v-t graph of the particles is correctly shown by
01:59View SolutionThe x-t graph of particle moving along a straight line is shown in figure The a-t graph of the particle is correctly shown by
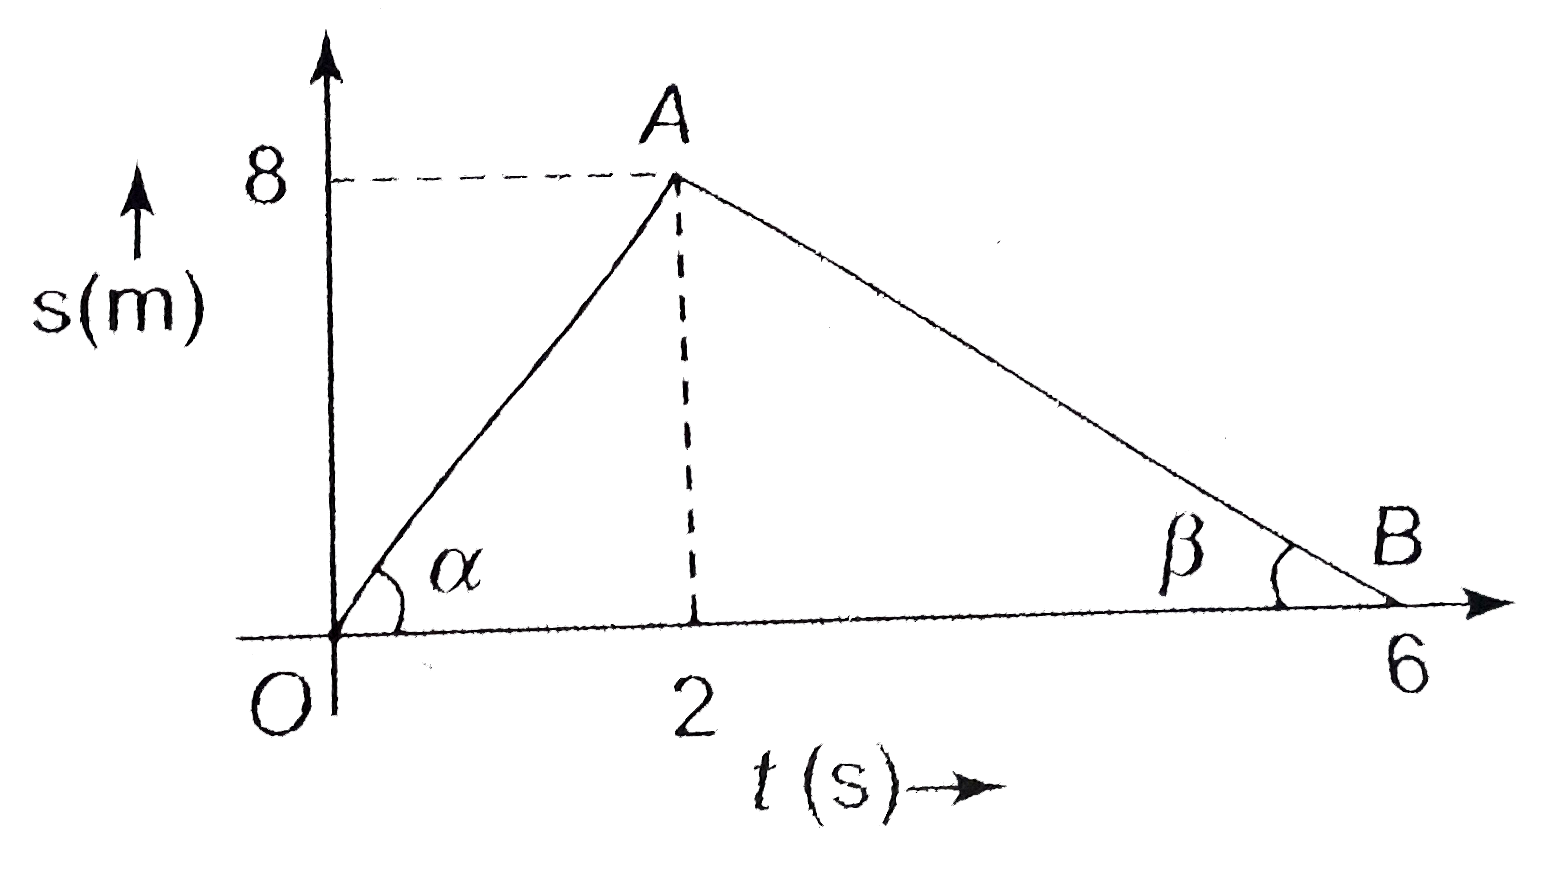
01:33View SolutionFor a particle moving in a straight line, the position-time graph is as shown in the figure. Find the velocity of the particle at time t=1s and t=4s. Also sketch the v-t graph.
 03:28View Solution
From v-t graph shown in figure. We can draw the following conclusions
02:11View SolutionAssertion : In the s-t graph as shown in figure, velocity of particle is negative and acceleration is positive.
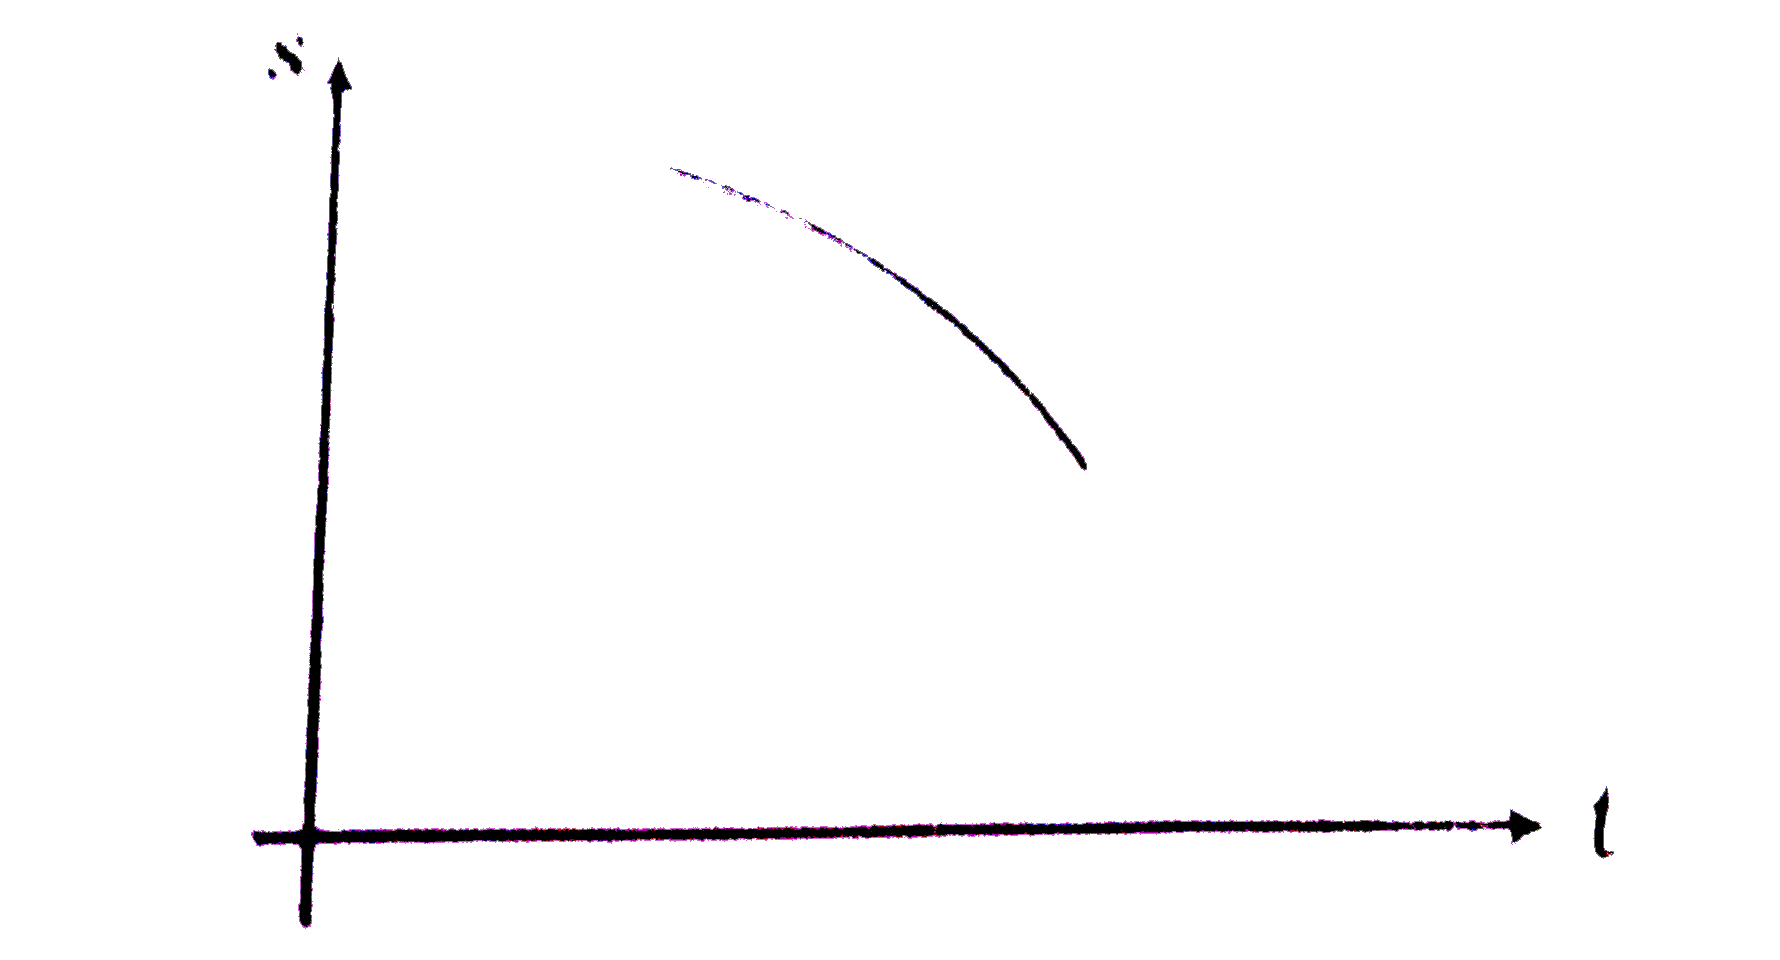
Reason : Slope of s-t graph is negative and increasing in magnitude.01:41View SolutionFor the acceleration - time (a - t) graph shown in figure, the change in velocity of particle from t = 0 to t = 6 s is
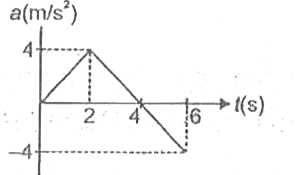 02:50View Solution
The a -t graph is shown in the figure. The maximum velocity attained by the body from rest will be
 03:14View Solution

