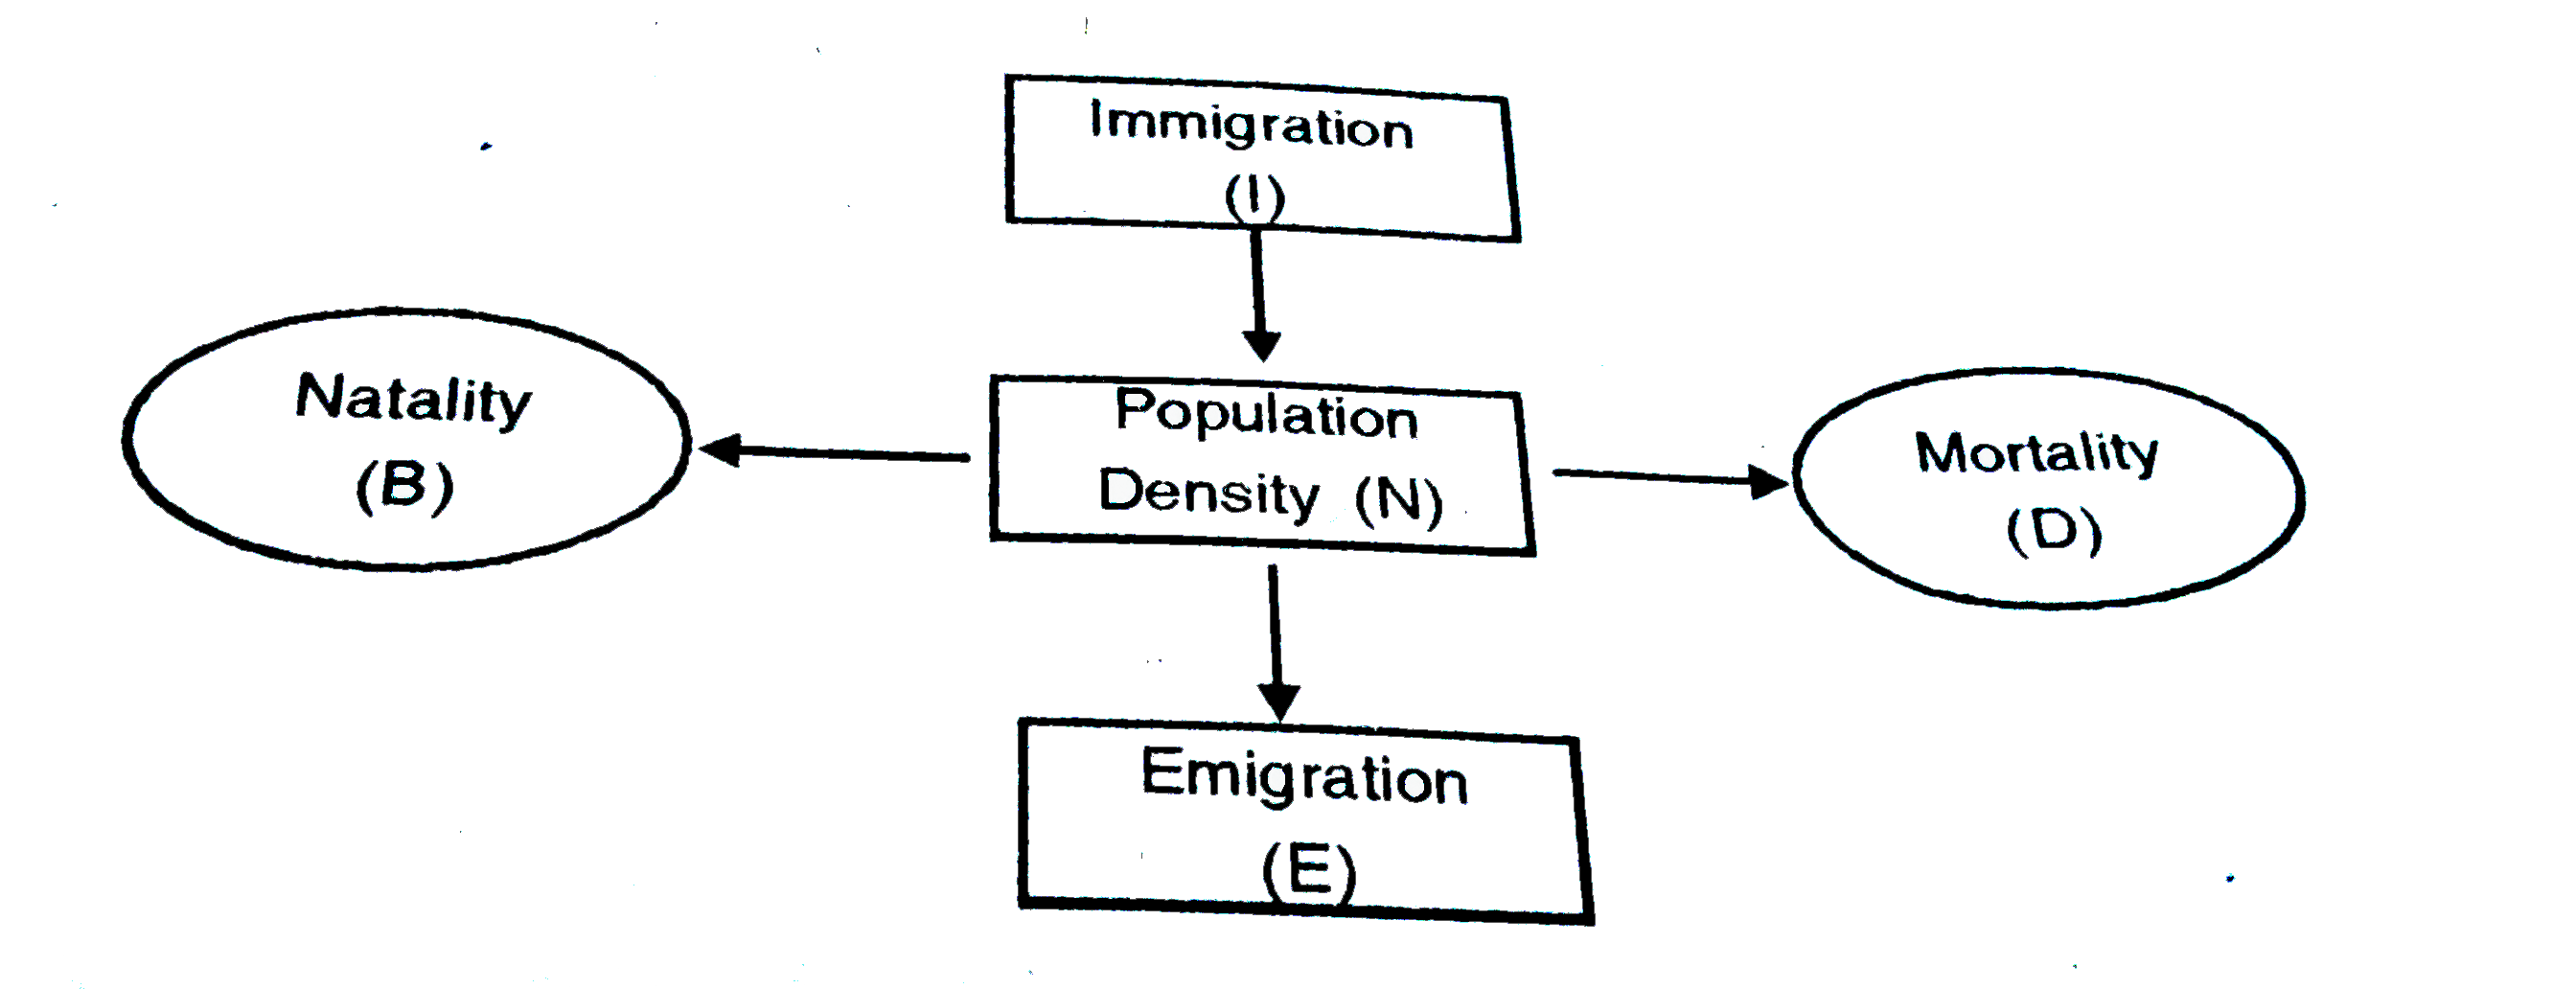
(a) Study the flow chart given below and complete the equation that follows by identifying 1, 2, 3 and 4.
(b) Mention the different ways by which the population density of different species can be measured.
(a) Nt+1=Nt+{(1+2)−(3+4)}
Nt+1=Nt+{(B+I)−(D+E)}
Nt = Population density at time t
B = Natality
I = Immigration
D = Mortality
E = Emigration
Population density will increase if the number of births plus the number of immigrains (B+I) is more than the number of deaths plus the number of emigrants (D+E), otherwise it will decrease.
(b) Population density means, number of individuals present per unit area, population density can be measured by determining the population size, the different methods to study population density are as follows :
1 Percent cover biomass : In an area with 200 parthenium plants and only one banyan tree with large canopy, the density of banyan tree is small but does not reflect its important role in the community. Here, present cover or biomass is a more meaningful method of assessing population density.
Total Number : It involves physically, counting of organisms in the given area.
3. Relative Density : In this method there is no need to count the organisms individually.
Example : The number of fishes per trap gives the measure of their total density in a given water body.
4. Indirect Assessment : The tiger census is based on pug marks and foecal pellets.
Topper's Solved these Questions
- BOOK - XII BOARDS PREVIOUS YEARCHAPTER - XII BOARDSEXERCISE - SET -I Section -A8videos
XII BOARDS
- BOOK - XII BOARDS PREVIOUS YEARCHAPTER - XII BOARDSEXERCISE - SET -I Section -B11videos
XII BOARDS
- BOOK - XII BOARDS PREVIOUS YEARCHAPTER - XII BOARDSEXERCISE - Section C31videos
XII BOARDS
- BOOK - XII BOARDS PREVIOUS YEARCHAPTER - SAMPLE PAPER 2019EXERCISE - Section E Part B3videos
SAMPLE PAPER 2019
Similar Questions
(a) List any three ways of measuring population density of a habitat.
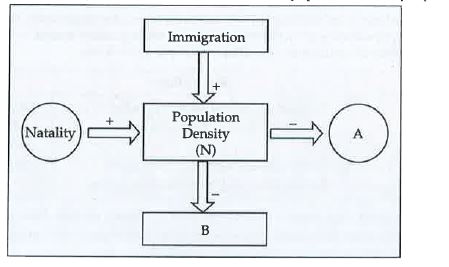
(b) Mention the essential information that can be obtained by studying the population density of an organism.View SolutionObserve flow chart given below:
(a) Name the processes represented as A and B.
(b) If 'N' , is the population density at time t, then write down the population density equation at time t+1.
 View Solution
Knowledge Check
- Question 1 - Select One
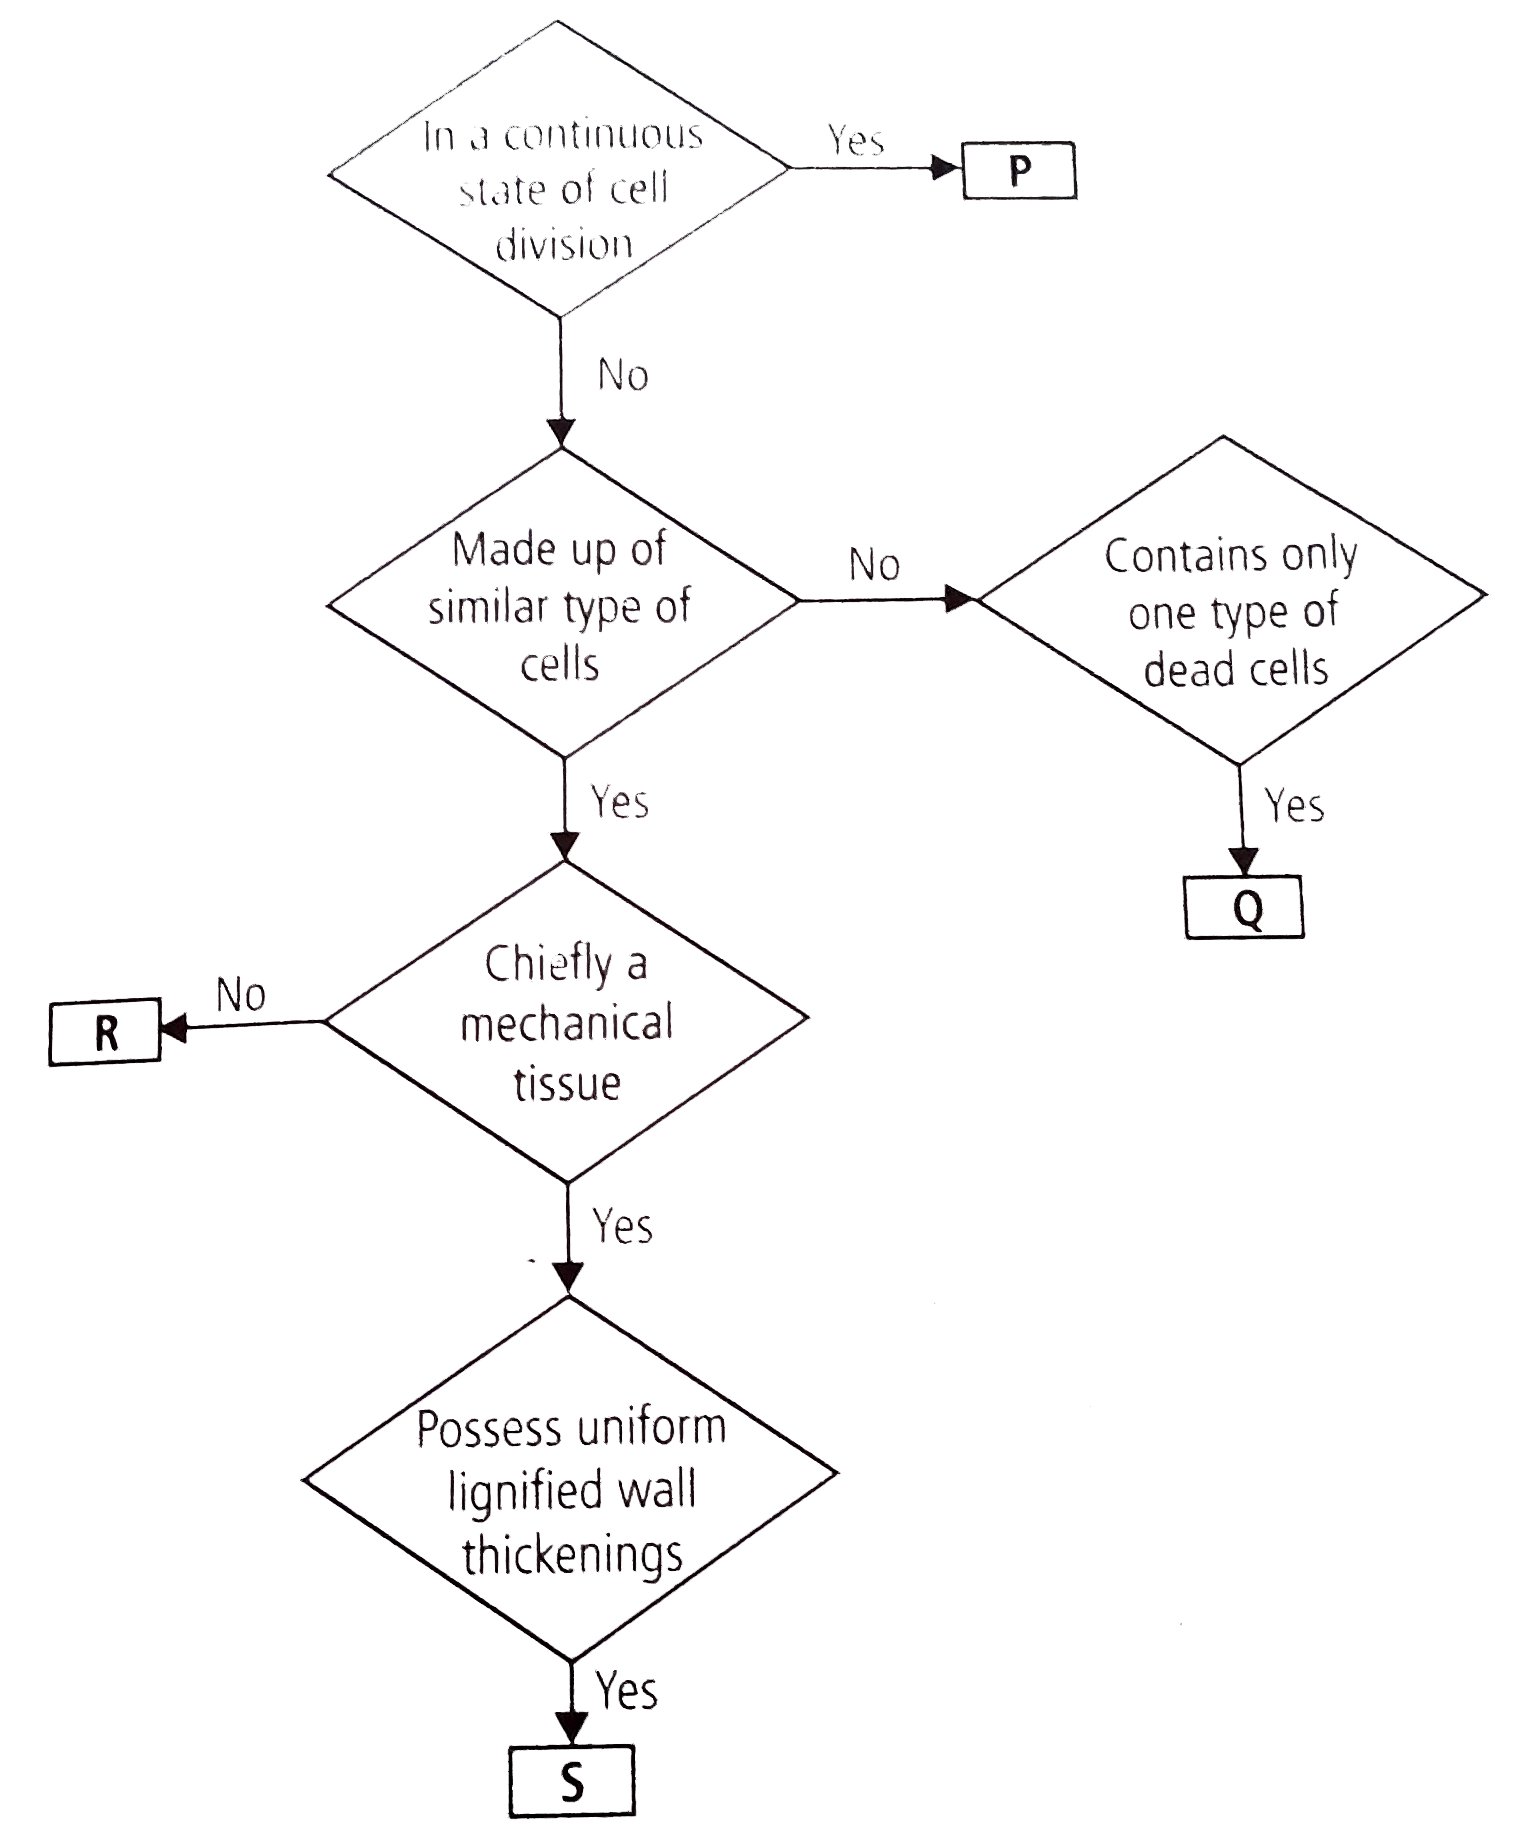
Study the flow chart given below:
Which of the following statements is incorrect regarding this?AP can be root apical meristem which is generally sub-terminal in position.BQ can be phloem which is also called bast.CR can be parenchyma which comprises of thin walled isodiametric cells.DS can be collenchyma which is a living mechanical - Question 2 - Select One
Different factors affecting population density are given below. I,B,D and E represent:
 AEmigration, immigration, natality, mortalityBImmigration , natality, mortality, emigrationCImmigration, mortality, natality, emigrationDImmigration, natality, emigration, mortality
 - Question 3 - Select One
Different factors affecting population density are given below . I ,B ,D and E represent :
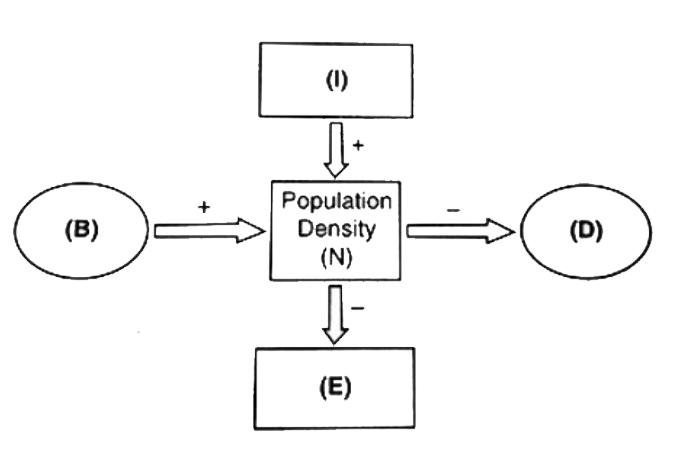 AI-Emigration , B-immigration , D-Natality , E-MortalityBI-Immigration , B-Natality , D-Mortality , E - EmigrationCI-Immigration, B-Mortality , D-Natality , E-EmigrationDI-Immigration, , B-Natality , D--Emigration, E-Mortality
Study the schematic representation given above and answer the following questions : (a)Identify A in it. (b)Identify D in it. (c)When the population density at time t is N as shown above, write the population density at time t+1 in the form of an equation using appropriate symbols.
 View Solution
Study the pie chart given below and answer the question that follows. The total amount collected for flood relief from different sources is shown in the pie chart-

What is the approximate ratio of collection from corporates to Central Government ?View SolutionStudy the set of numbers given below and answer the questions which follow:
489 541 654 953 783
If five is substracted from each of the numbers, which of the following numbers will be the difference between the second digit of the highest number?
1) Zero
2) 3
3) 1
4) 4
5) 2View SolutionStudy the figure given below and answer the questions that follows- (a) Name the stage of human embryo the figure represents.(b) Identify A and B in the figure and mention its function.(c) Where is stem cell located in this embryo?
View SolutionStudy the diagram given below and select the right options out of (a-d) , in which all the 4 items A, B, C and D are correctly identified
 View Solution

