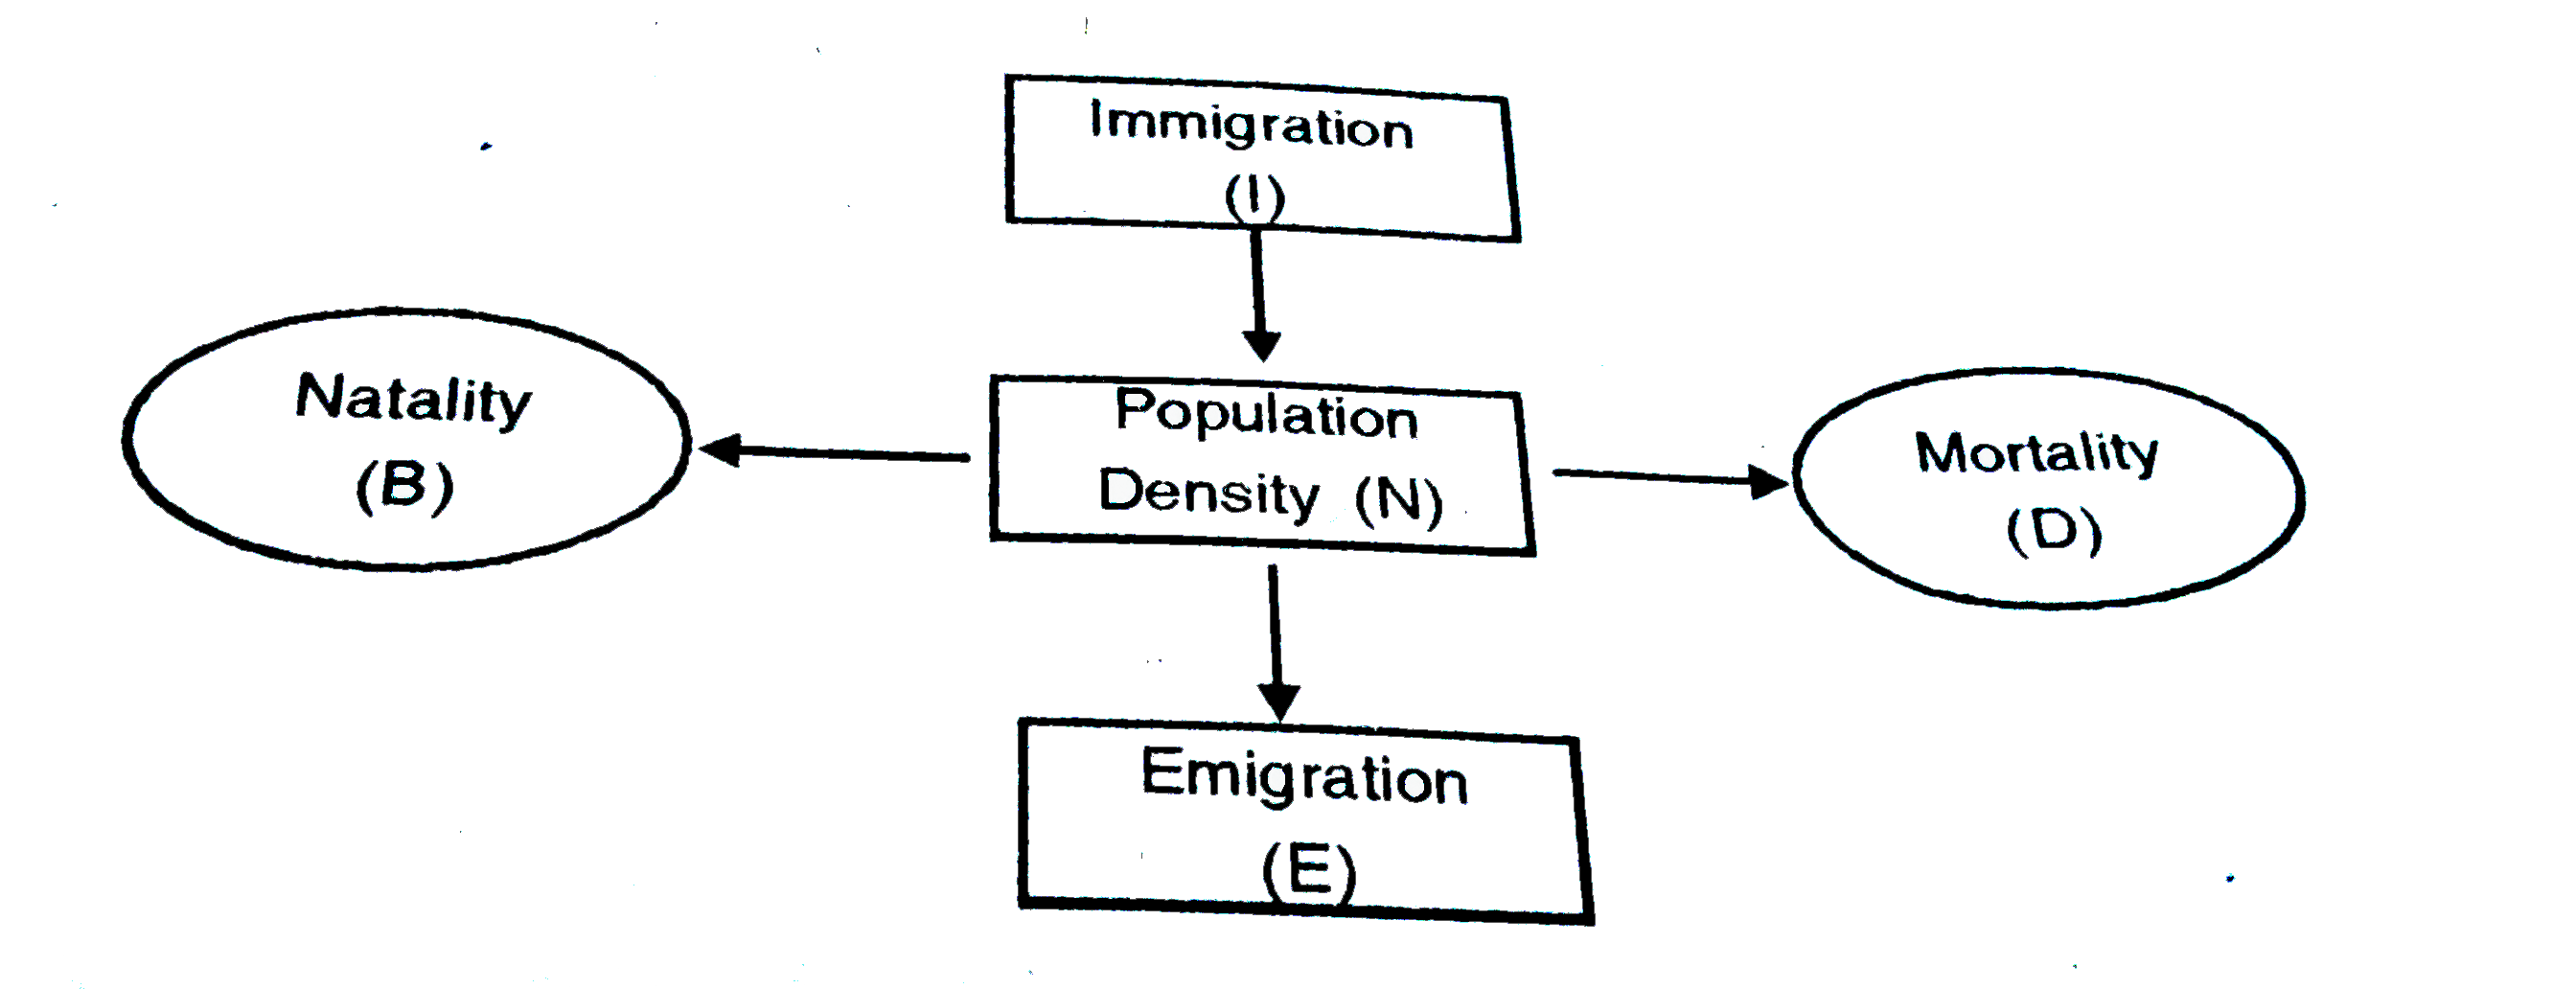
Observe flow chart given below:
(a) Name the processes represented as A and B.
(b) If 'N' , is the population density at time t, then write down the population density equation at time t+1.
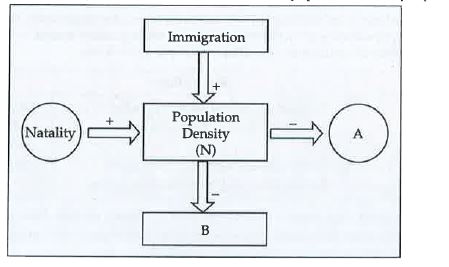
(a) A = Motality , B = Emigration.
Nt+1=Nt+(Natality + Immigration - Mortality - Emigration)
Topper's Solved these Questions
- ORGANISMS AND POPULATIONS BOOK - MODERN PUBLICATIONCHAPTER - ORGANISMS AND POPULATIONS EXERCISE - REVISION EXERCISES (III. SHORT ANSWER TYPE - I QUESTIONS) (B. QUESTIONS FROM CBSE EXAMINATIONS)
18 Videos
- ORGANISMS AND POPULATIONS BOOK - MODERN PUBLICATIONCHAPTER - ORGANISMS AND POPULATIONS EXERCISE - REVISION EXERCISES (IV. SHORT ANSWER TYPE - II QUESTIONS) (A. QUESTIONS FROM STATE BOARD EXAMINATIONS)
27 Videos
- ORGANISMS AND POPULATIONS BOOK - MODERN PUBLICATIONCHAPTER - ORGANISMS AND POPULATIONS EXERCISE - REVISION EXERCISES (II. VERY SHORT ANSWER QUESTIONS) (B. QUESTIONS FROM CBSE EXAMINATIONS)
13 Videos
- MOLECULAR BASIS OF INHERITANCE BOOK - MODERN PUBLICATIONCHAPTER - MOLECULAR BASIS OF INHERITANCE EXERCISE - CHAPTER PRACTICE TEST (Section - E)
1 Videos
- PRINCIPLES OF INHERITANCE AND VARIATIONBOOK - MODERN PUBLICATIONCHAPTER - PRINCIPLES OF INHERITANCE AND VARIATIONEXERCISE - CHAPTER PRACTICE TEST section-e(Long answer type question)
1 Videos
Similar Questions
Study the schematic representation given above and answer the following questions : (a)Identify A in it. (b)Identify D in it. (c)When the population density at time t is N as shown above, write the population density at time t+1 in the form of an equation using appropriate symbols.

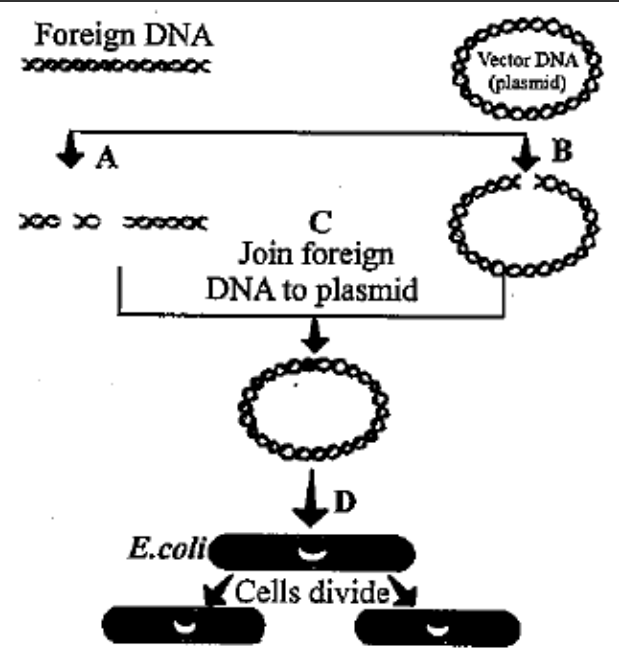
View SolutionThe flow chart given below represents the process of recombinant DNA technology. Identify A,B, C and D.
View Solution
Knowledge Check
In the graph below. where N is population size and tis time. M represents
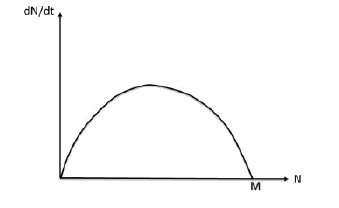 Aspecific growth rate.BMedian population sizeCcarrying capacityDminimum population size without going extinct.
The population of a city increases at the rate 3% per year. If at time t the population of city is p, then find equation of p in time t.
Ap=3100e3tBp=3e3t100Cp=ce3t100Dp=e3t100Age structure diagrams (A, B and C) for the populations are shown below. They represent:-
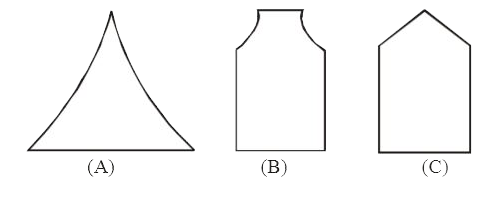 AA-Declining populations
B- Stable population
C- Growing populationBA-Growing population
B- Stationary population
C- Declining populationsCA-Exponential growth
B- Indeterminate growth
C- Stationary populationDA-Growing population
B- and C- Stable population
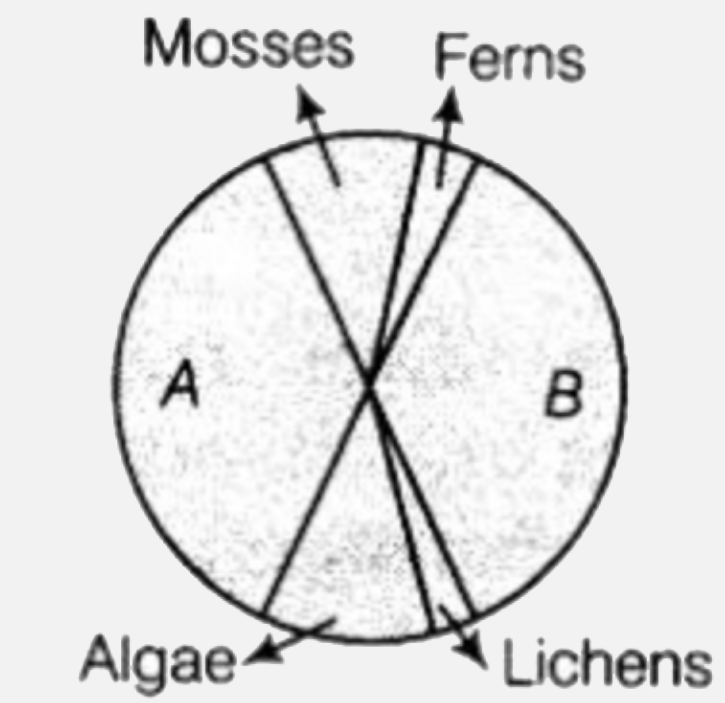
Observe the pie chart given below showing biodiversity and identify 'a' and 'b'
View SolutionIn the graph below. where N is population size and tis time. M represents

View SolutionList the different attributes that a population has and not an individual organism.
( b) What is population density? Explain any three different ways the population density can be measured ,with the help of an example each .
View Solution(a) Study the flow chart given below and complete the equation that follows by identifying 1, 2, 3 and 4.
(b) Mention the different ways by which the population density of different species can be measured.
View SolutionA⊕−−→ population density(N)T←−−B.
If A increases the population density and B decrases then identify A and B
View Solution
