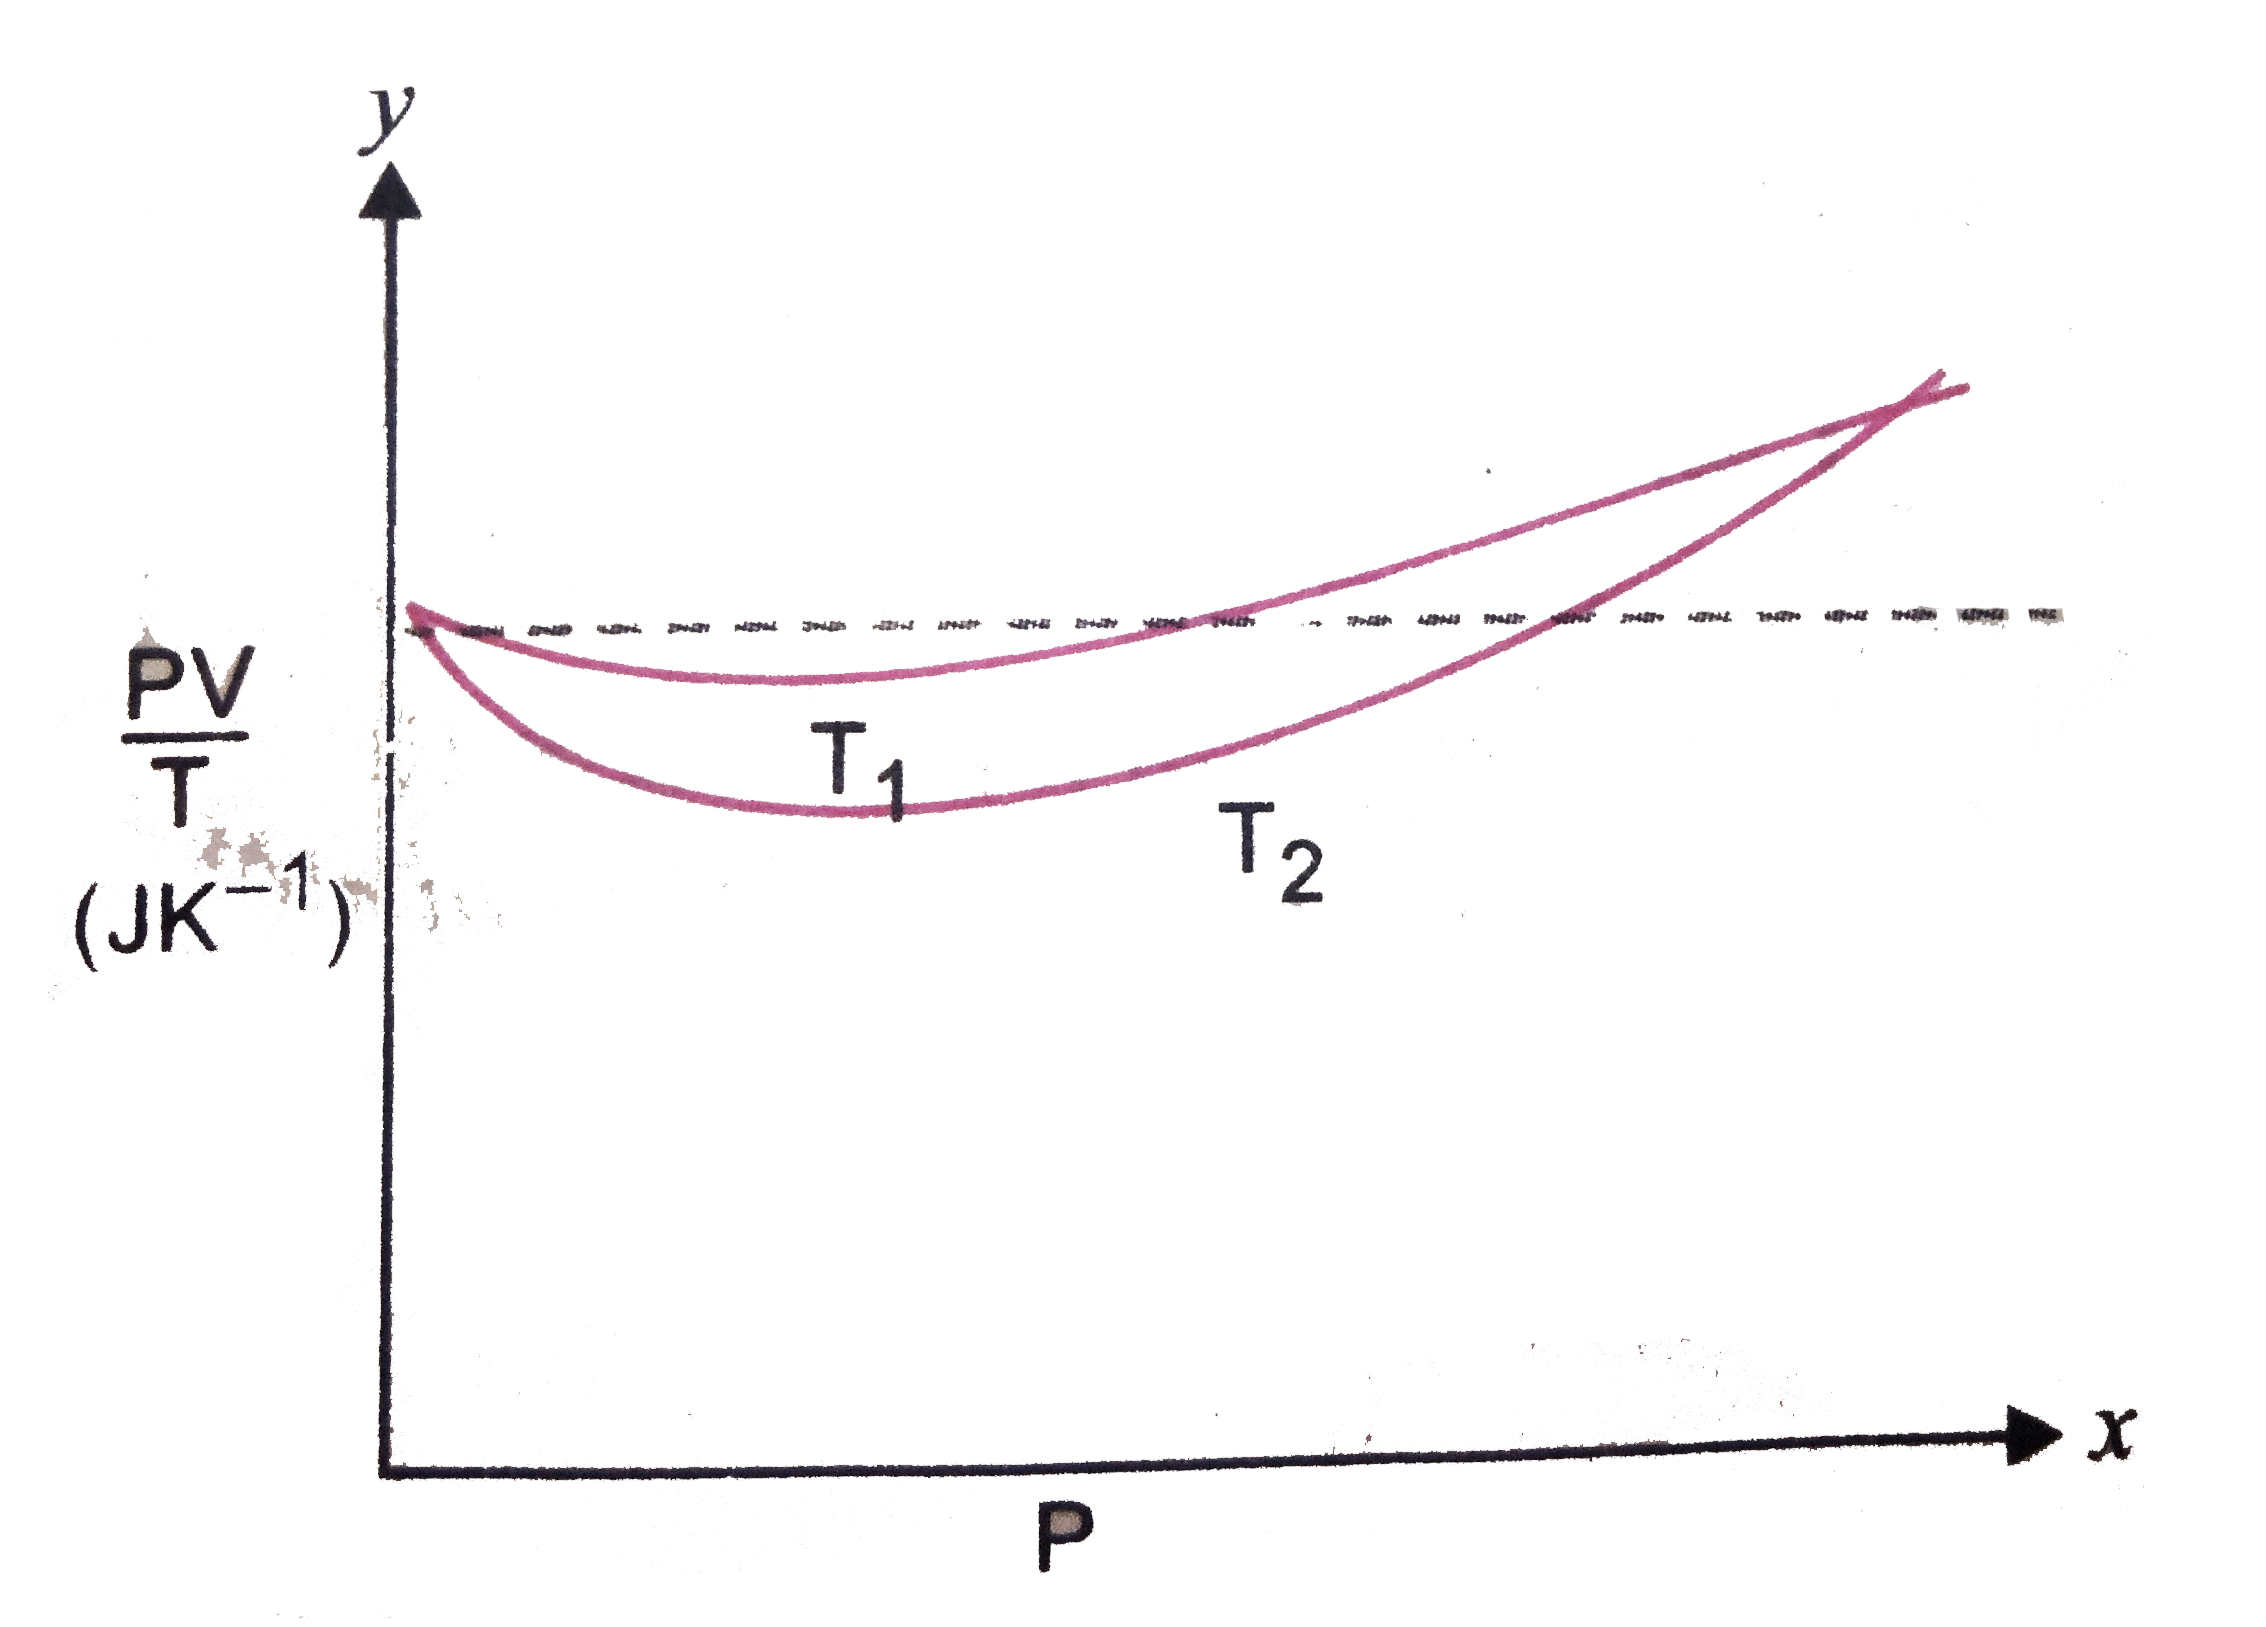
Fig shows of versus P for of oxygen gas at two different temperatures.
(a) What does the dotted plot signify ?
(b) Which is true :
( c) What is the value of where the curves meet on the Y-axis ?
(d) If we obtained similar plot for of hydrogen, would we get the same value of at the point where the curves meet on the y-axis ? If not, what mass of hydrogen yield the same value of (for low pressure high temperature region of the plot) ? (Molecular mass of , of
(i) only
(i) and (ii) only
All of the above
None of the above
The correct Answer is:C
(The dotted line in the diagram shows that there is no deviation in the value of for different temperatures and for increasing pressure so, this gas behaaves ideally. Hence, dotted line corresponds to 'ideal gas' behaviour.
(ii) At high temperature, the deviation of the gas is less and at low temperature the deviation of gas is more. In the graph,deviation fof is greater than for Thus
(iii) Since, the two curves intersect at dotted line so, the value of at that point on the y-axis is same for all gases.
Topper's Solved these Questions
- BOOK - A2ZCHAPTER - MOCK TESTEXERCISE - General Kinematics30videos
MOCK TEST
- BOOK - A2ZCHAPTER - MOCK TESTEXERCISE - Motion With Constant Acceleration15videos
MOCK TEST
- BOOK - A2ZCHAPTER - KINETIC THEORY OF GASES AND THERMODYNAMICSEXERCISE - Chapter Test29videos
KINETIC THEORY OF GASES AND THERMODYNAMICS
- BOOK - A2ZCHAPTER - MOTION IN TWO DIMENSIONEXERCISE - Chapter Test29videos
MOTION IN TWO DIMENSION
Similar Questions
Figure shows plot of PV/T versus Pfor1.00×10−3 kg of oxygen gas at two different temperatures.
(i) What does the dotted plot signify?
(ii) Which is true . T1>T2orT1<T2?
(iii) What is the value of PV/T where the curves meet on the y-axis?_E01_262_Q01.png) View Solution
View SolutionIf lines T1andT2 touch the curve y=x2−3x+2 at the points where the curve meets the X- axis, then
View Solution
Knowledge Check
- Question 1 - Select One
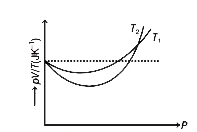
The figure shows the graph of pVT versus p for 2×10⁻⁴ kg of hydrogen gas at two different temperatures, where p,V andT represents pressure, volume and temperature respectively. Then, the value of pVT where the curve meet on the vertical axis, is
 AR5B2R3CR10DR15
 - Question 2 - Select One
If lines T1andT2 are tangent to the curve y=x2−3x+2 at the points where the curve meets the X- axes , then
AT1∣∣T2BT1⊥T2Cm∠(T1),T2=45∘Dm∠(T1),T2=60∘ - Question 3 - Select One
Shown below are the black body radiation curves at temperature T1 and T2(T2>T1). Which of the following plots is correct?
A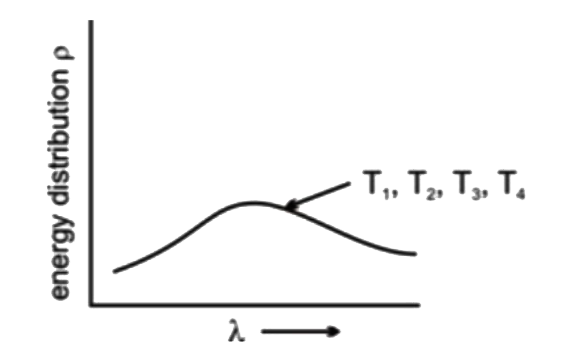 B
B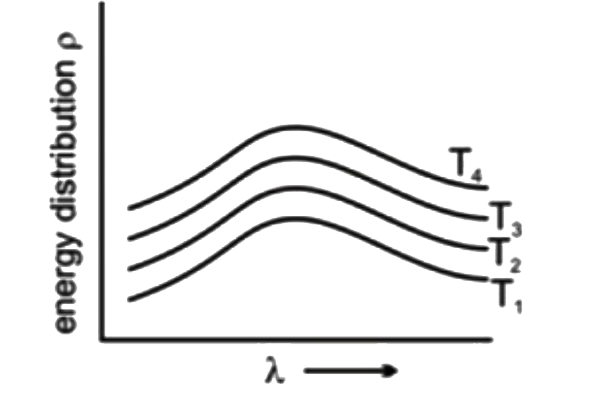 C
C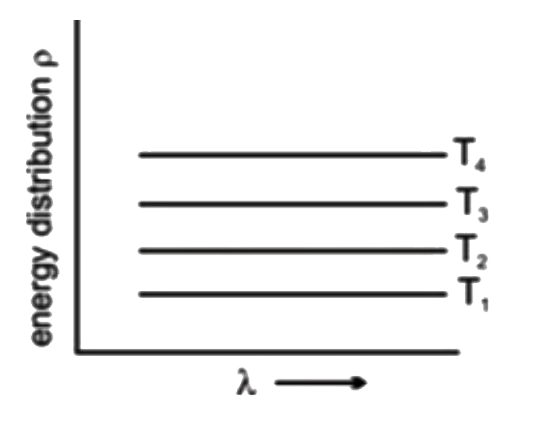 D
D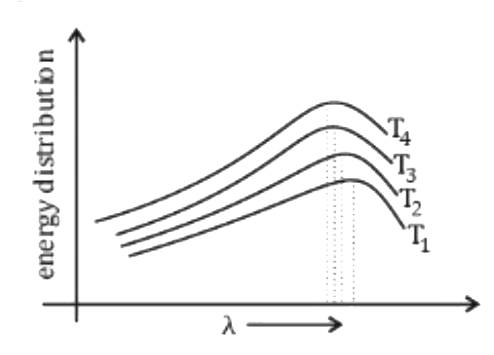
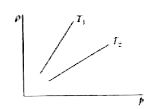
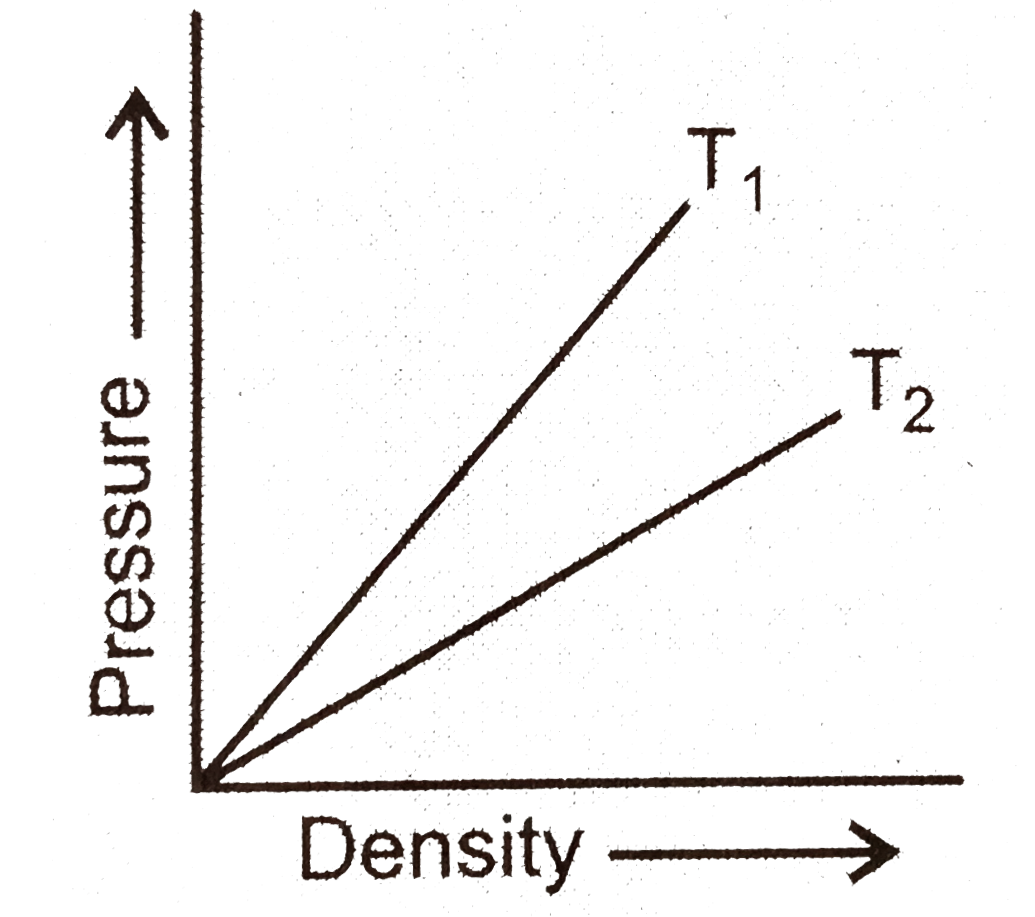
Figure shows graphs of pressure versus density for an ideal gas at two temperatures T1 and T2 Then
 View Solution
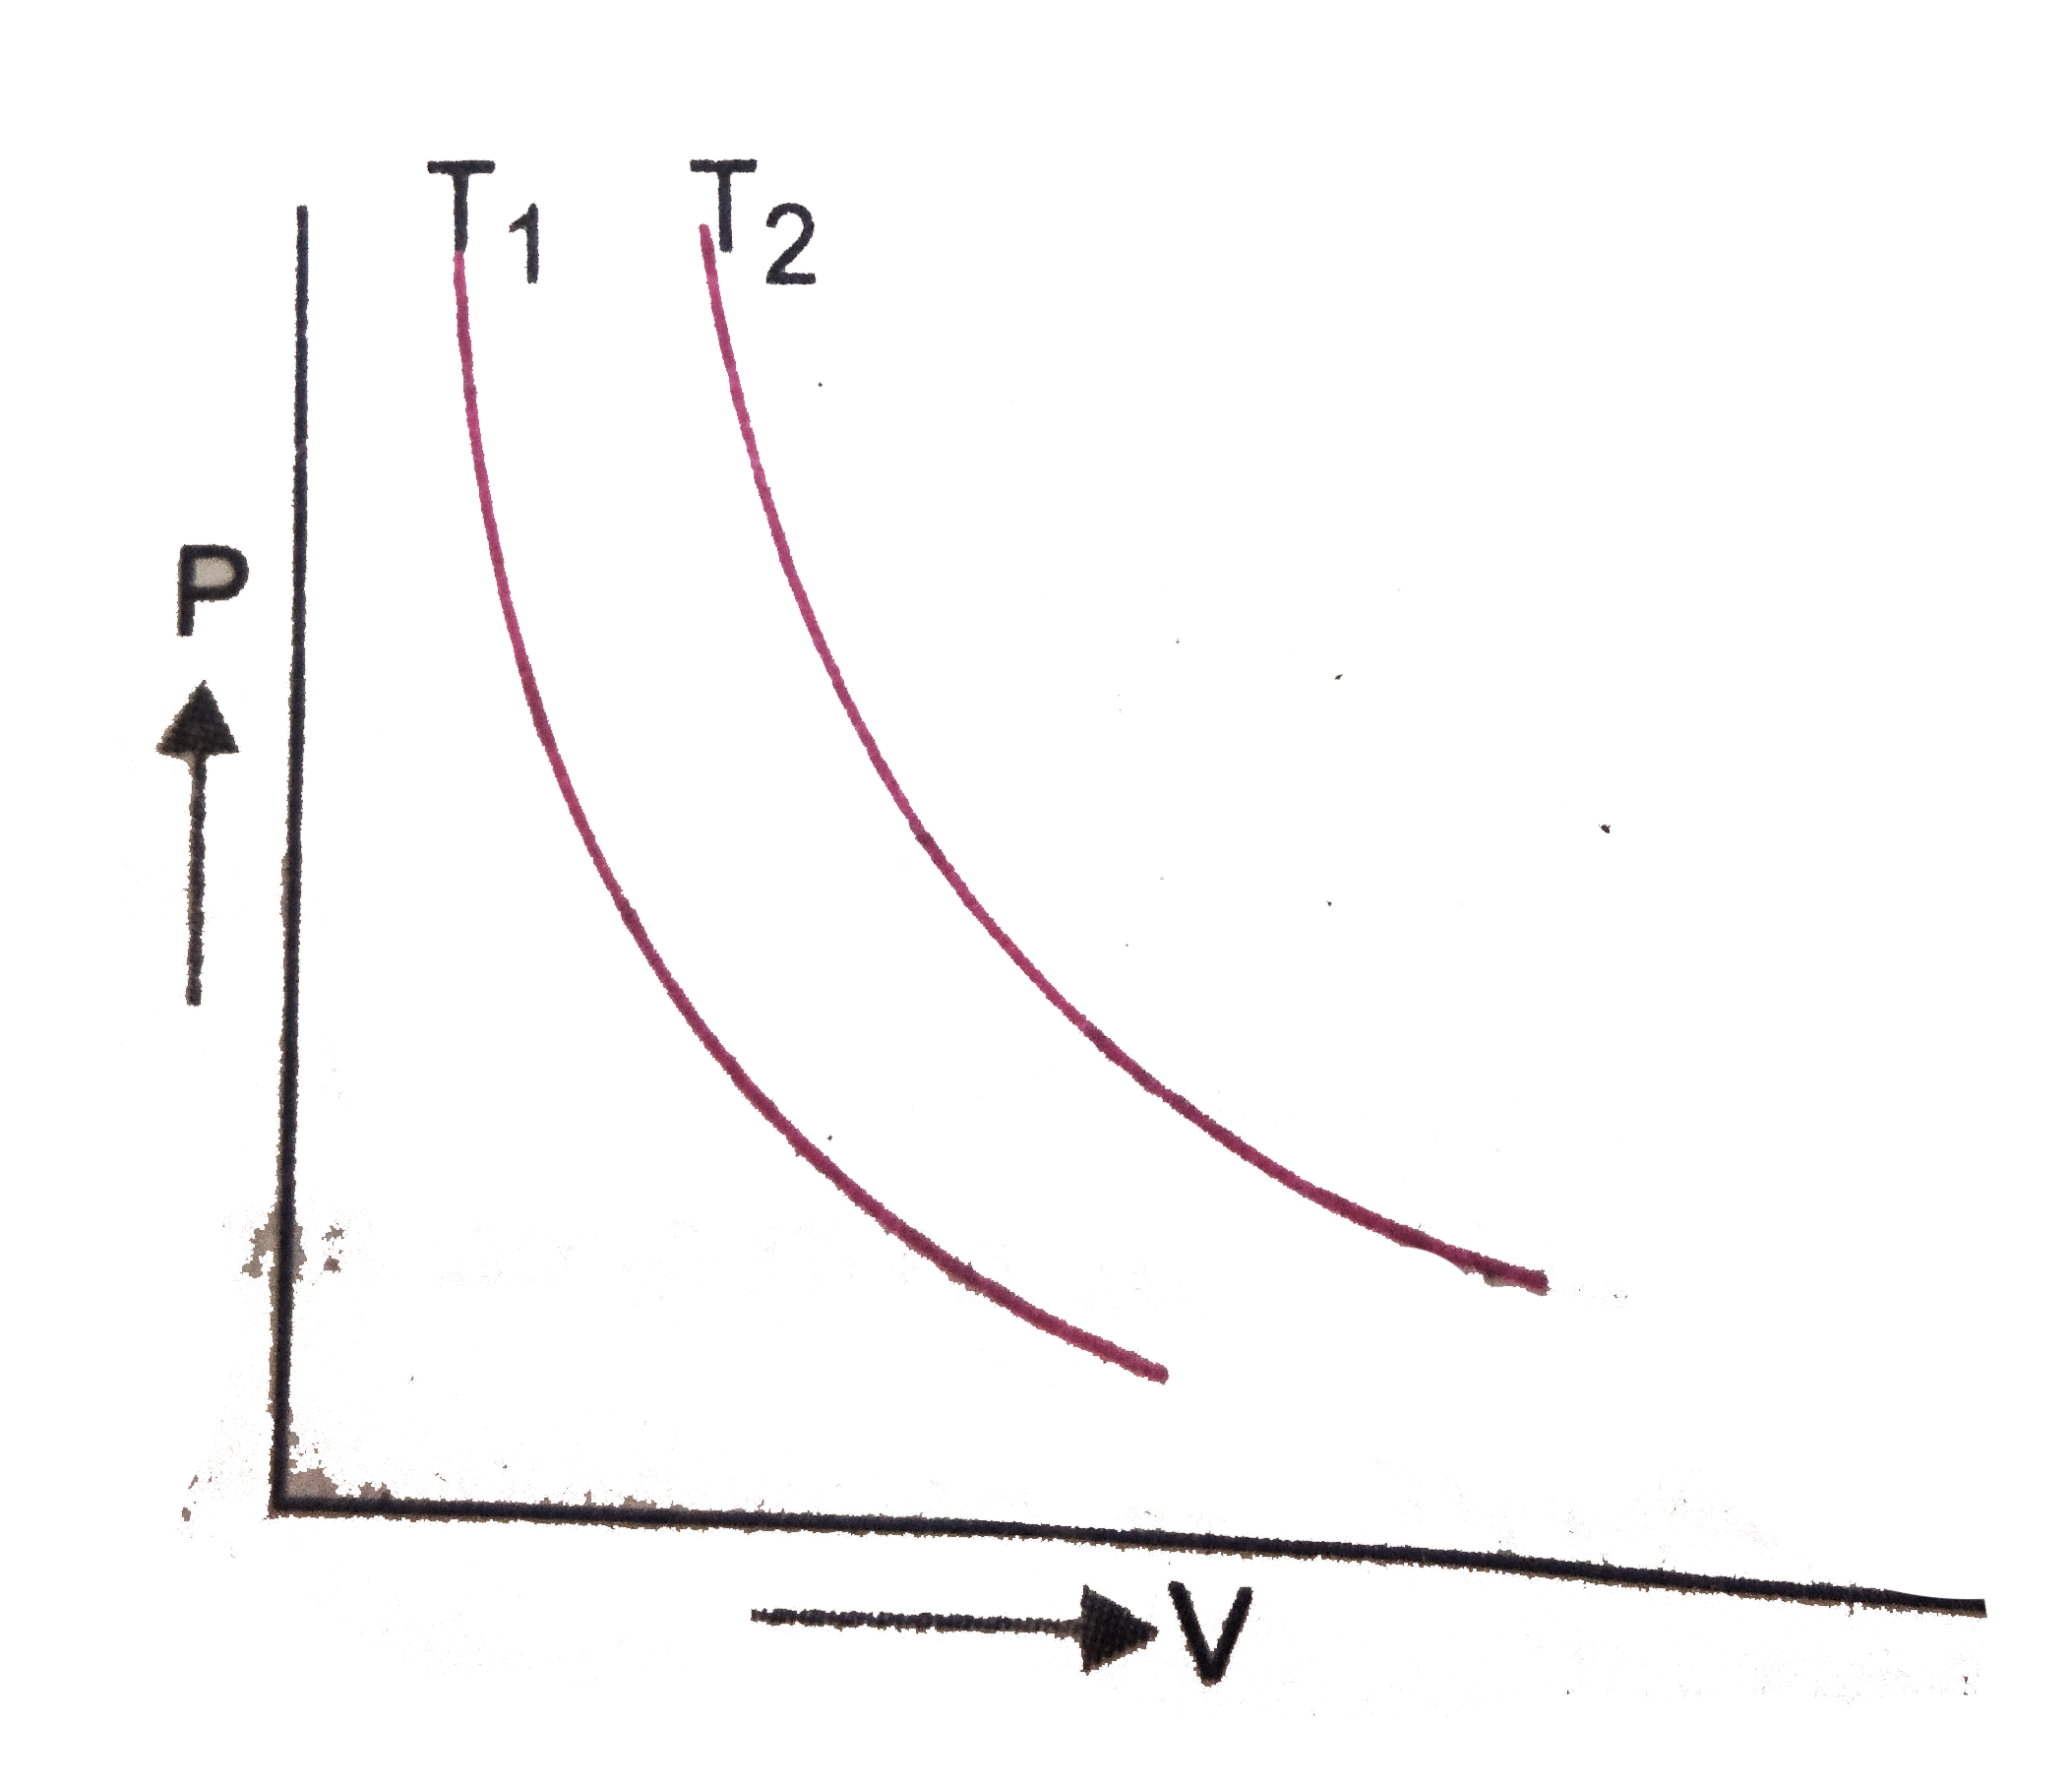
Isothermal curves for a given mass of gas are shown at two different temperture T1andT2 in Fig. State whether T1>T2orT2>T1. Justify your answer.
 View Solution
The stress-strain graph for a metallic wire is shown at two different temperature, T1 and T2 which temperature is high T1 or T2 ?
View SolutionFigure shows graphs of pressure versus density for an ideal gas at two temperatures T1 and T2 Which is correct ?
 .View Solution
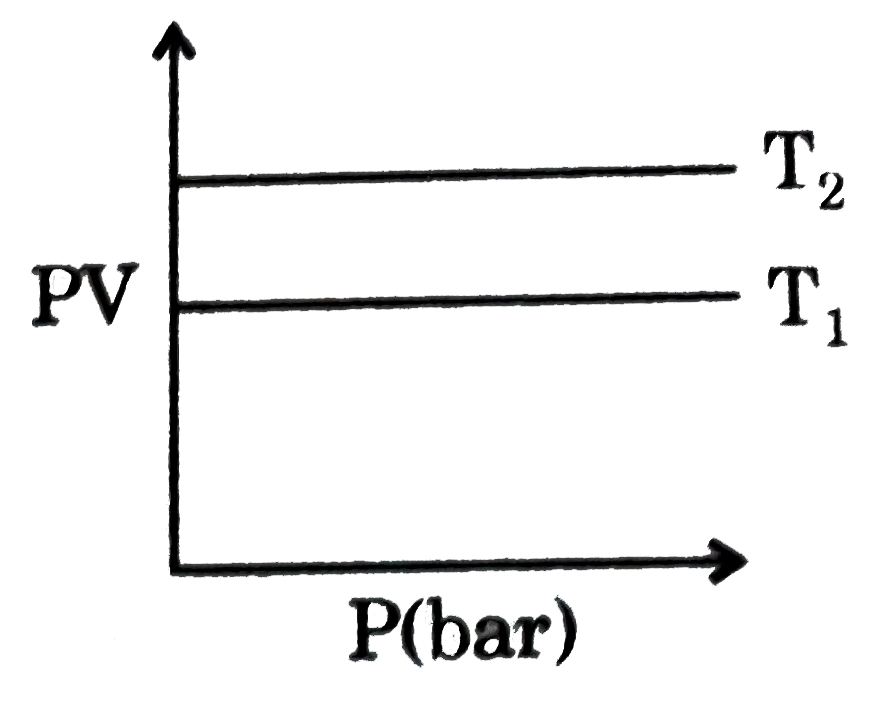
The product of PV is plotted against P at two temperatures T1 and T2 and the result is shown in figure. What is correct about T1 and T2?
 View Solution

