The product of PV is plotted against P at two temperatures T1 and T2 and the result is shown in figure. What is correct about T1 and T2?
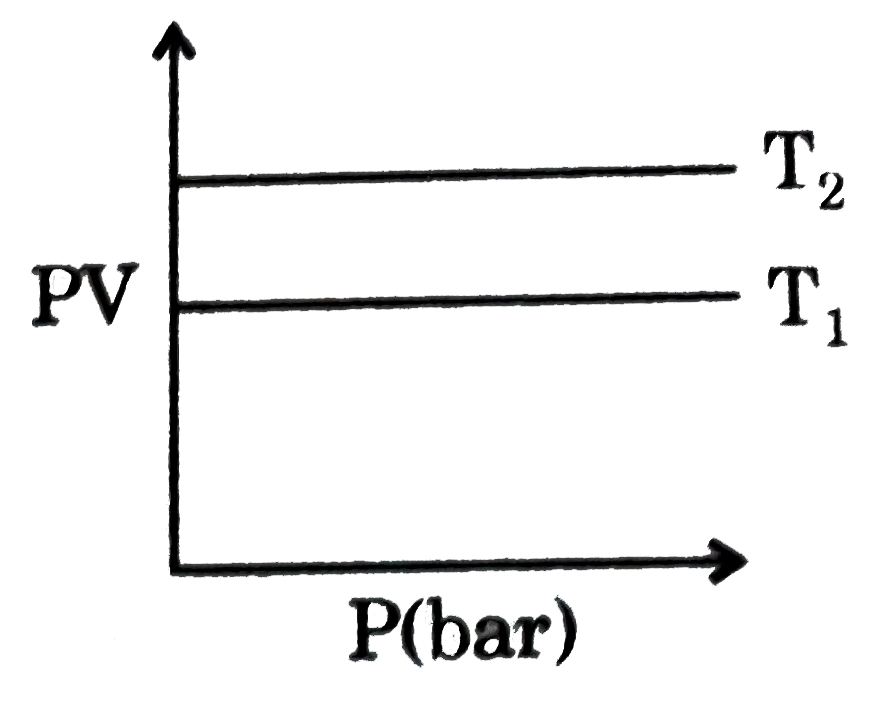
T1>T2
T2>T1
T1=T2
T1+T2=1
The correct Answer is:B
Topper's Solved these Questions
- GRAPHICAL INTERPRETATIONBOOK - GRB PUBLICATIONCHAPTER - GRAPHICAL INTERPRETATIONEXERCISE - C. Atomic Sturcture
1 Video
- GRAPHICAL INTERPRETATIONBOOK - GRB PUBLICATIONCHAPTER - GRAPHICAL INTERPRETATIONEXERCISE - Atomic Sturcture
9 Videos
- GRAPHICAL INTERPRETATIONBOOK - GRB PUBLICATIONCHAPTER - GRAPHICAL INTERPRETATIONEXERCISE - B. Gaseous State
1 Video
- F-BLOCK ELEMENTSBOOK - GRB PUBLICATIONCHAPTER - F-BLOCK ELEMENTSEXERCISE - Subjective type
7 Videos
- HYDROCARBON (ALIPHATIC)BOOK - GRB PUBLICATIONCHAPTER - HYDROCARBON (ALIPHATIC)EXERCISE - Previous years jee questions
28 Videos
Similar Questions
The product (PV) is plotted against P at two temperature T1andT2 and the result is given in following figure
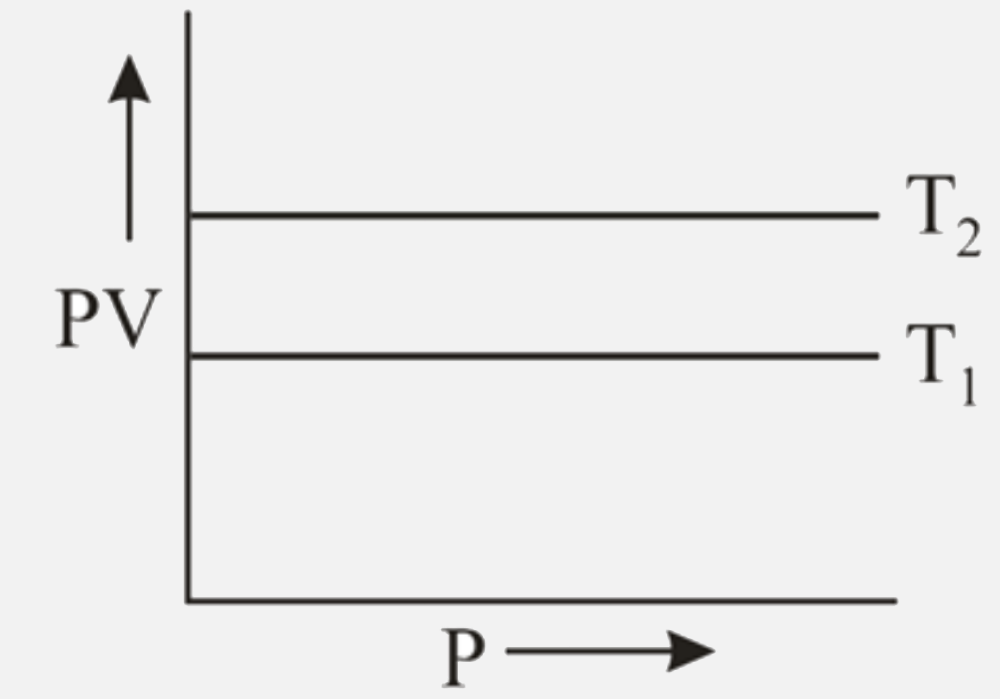
What is correct about T1andT2 ?
View SolutionThe product (PV) is plotted against P at two temperature T1andT2 and the result is given in following figure

What is correct about T1andT2 ?
View Solution
Knowledge Check
The product of PV is potted aginst P at two temperatures T1 and T2 and the 'result is shown in the figure. What is correct about T1 and T2?
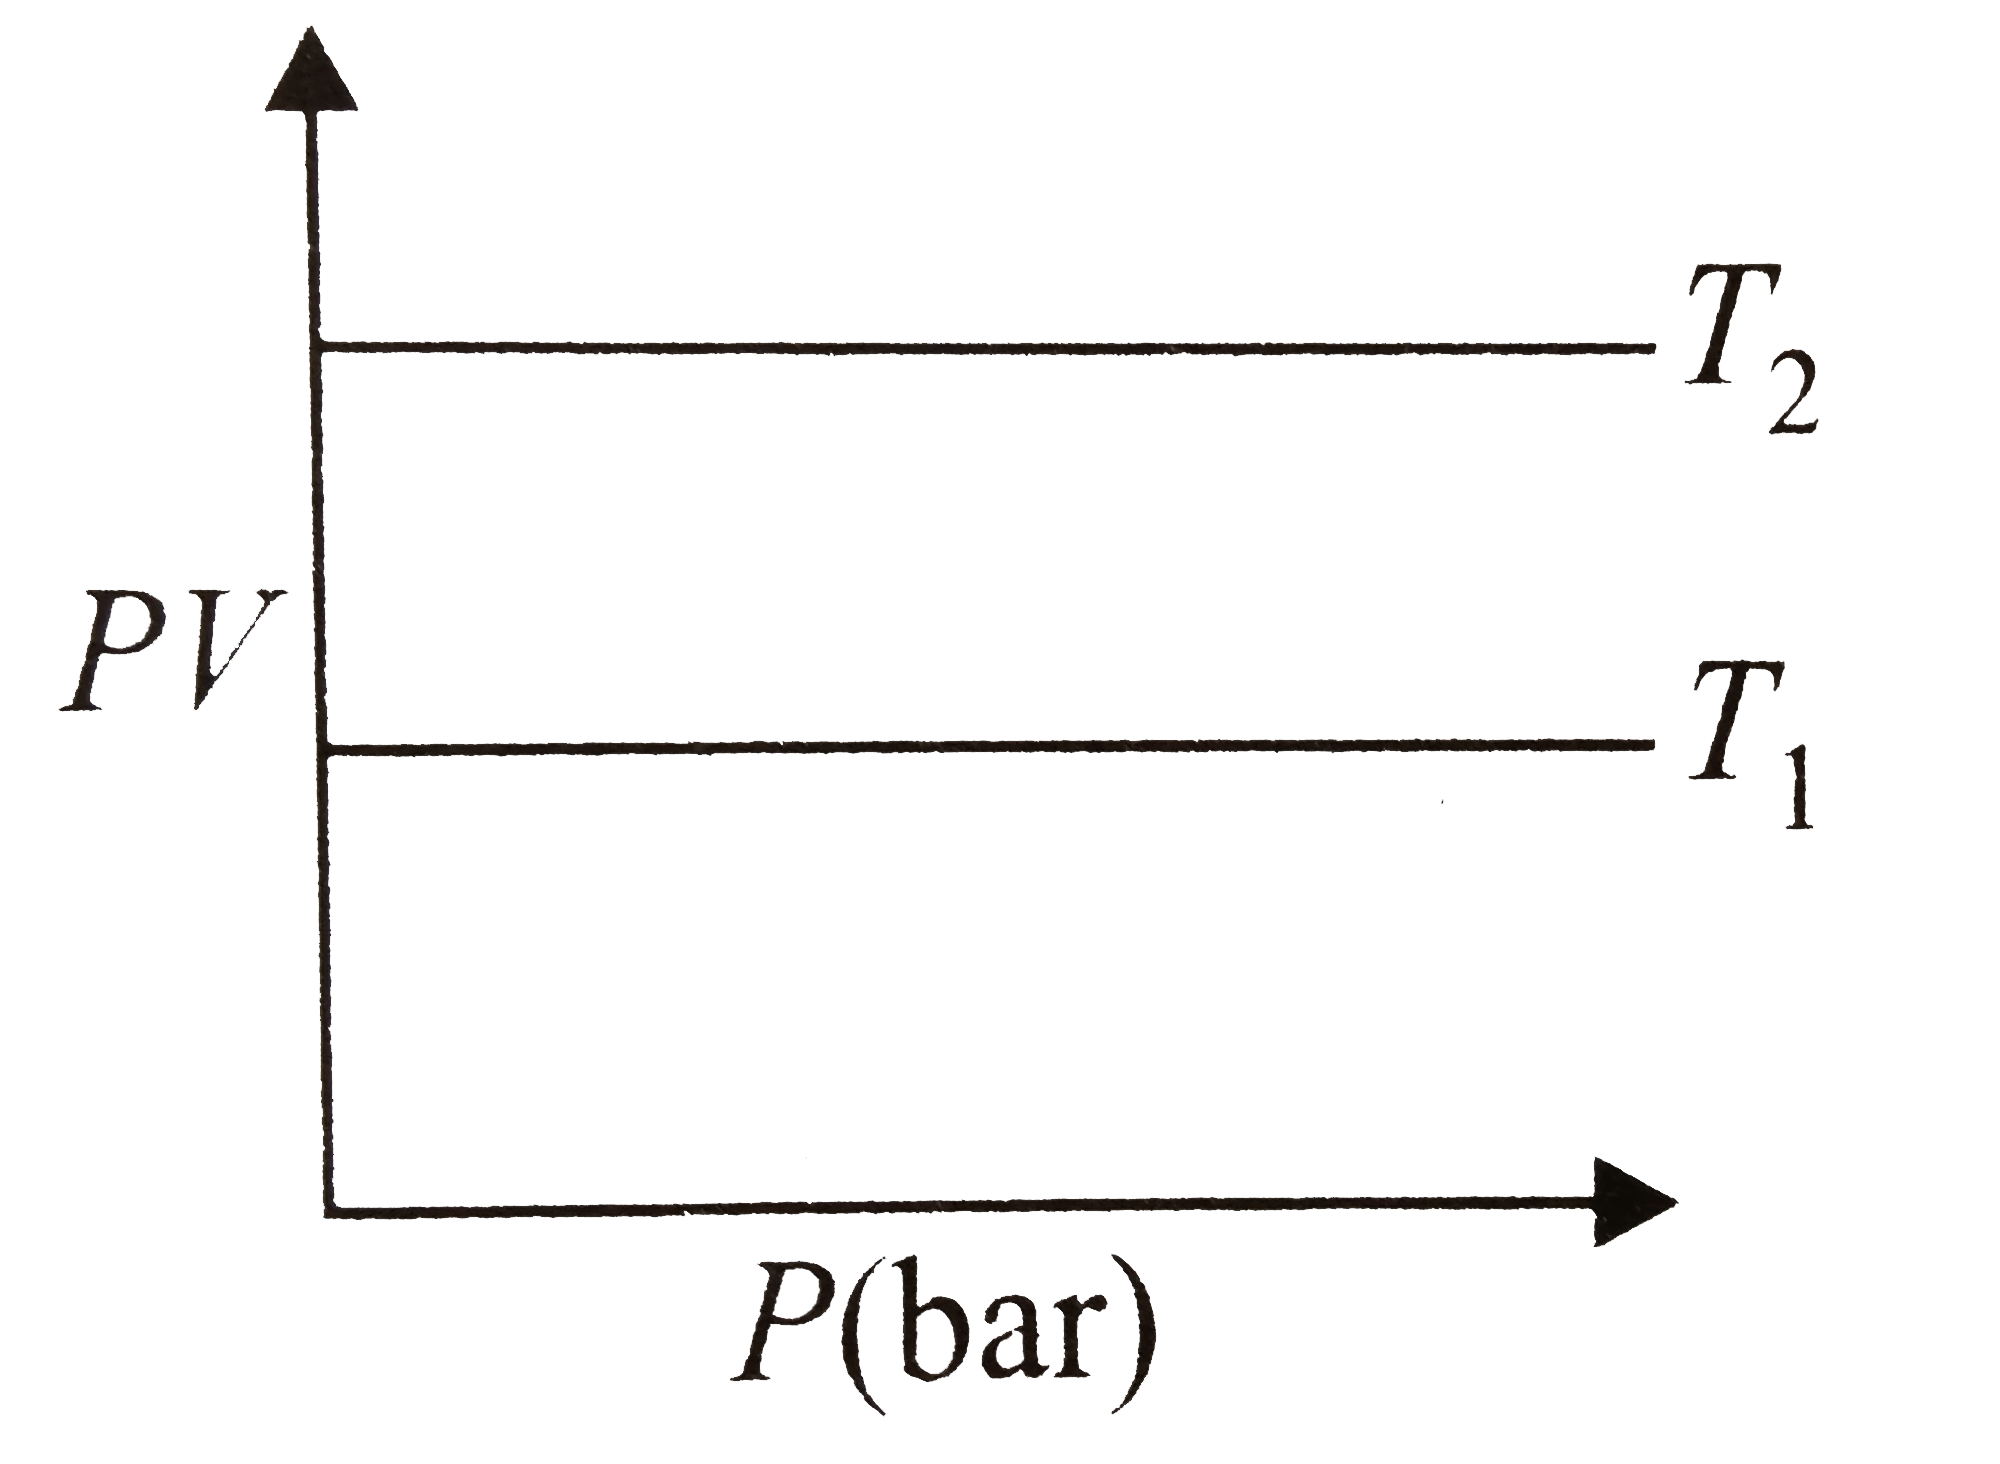 AT1>T2BT2>T1CT1=T2DT1+T2=1
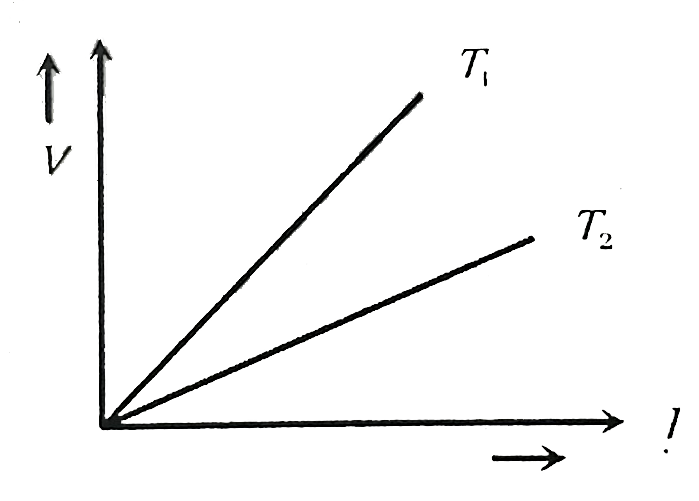
The voltage V and current I v graphs for a conductor at two different temperatures T1andT2 are shown in the figure. The relation between T1andT2 is
 AT1>T2BT1<T2CT1=T2DT1=1T2
The voltage V and current I v graphs for a conductor at two different temperatures T1andT2 are shown in the figure. The relation between T1andT2 is
 AT1>T2BT1<T2CT1=T2DT1=1T2
Determine the tensions T1 and T2 in the string as shown in figure.
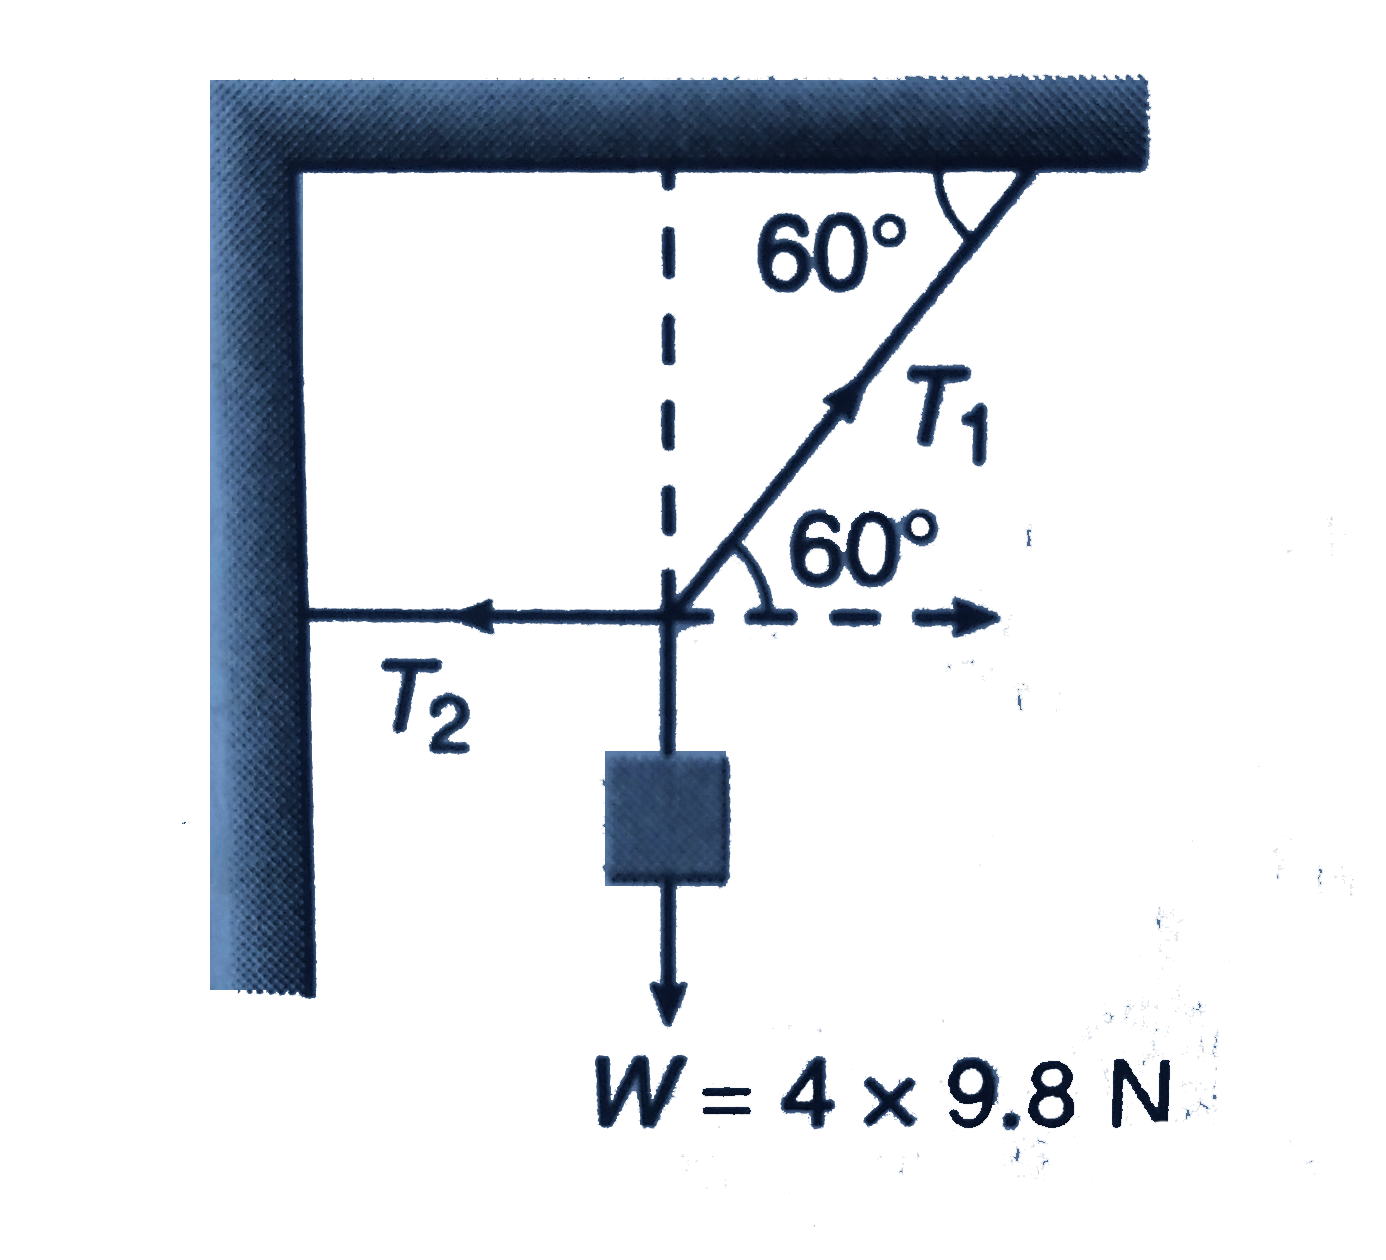
View SolutionDetermine the tensions T1 and T2 in the string as shown in figure.

View SolutionDetermine the tensions T1 and T2 in the string as shown in figure.

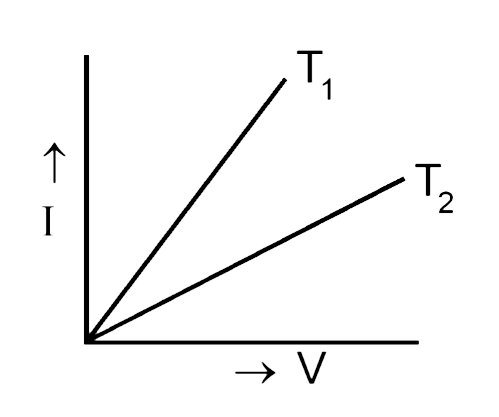
View SolutionThe current (I) and voltage (V) graphs for a given metallic wire at two different temperature (T1) and (T2) are shown in fig. It is concluded that
View SolutionThe voltage V and current I graph for a conductor at two different temperatures T1 and T2 are shown in the figure. The relation between T1 and T2 is
View Solution
