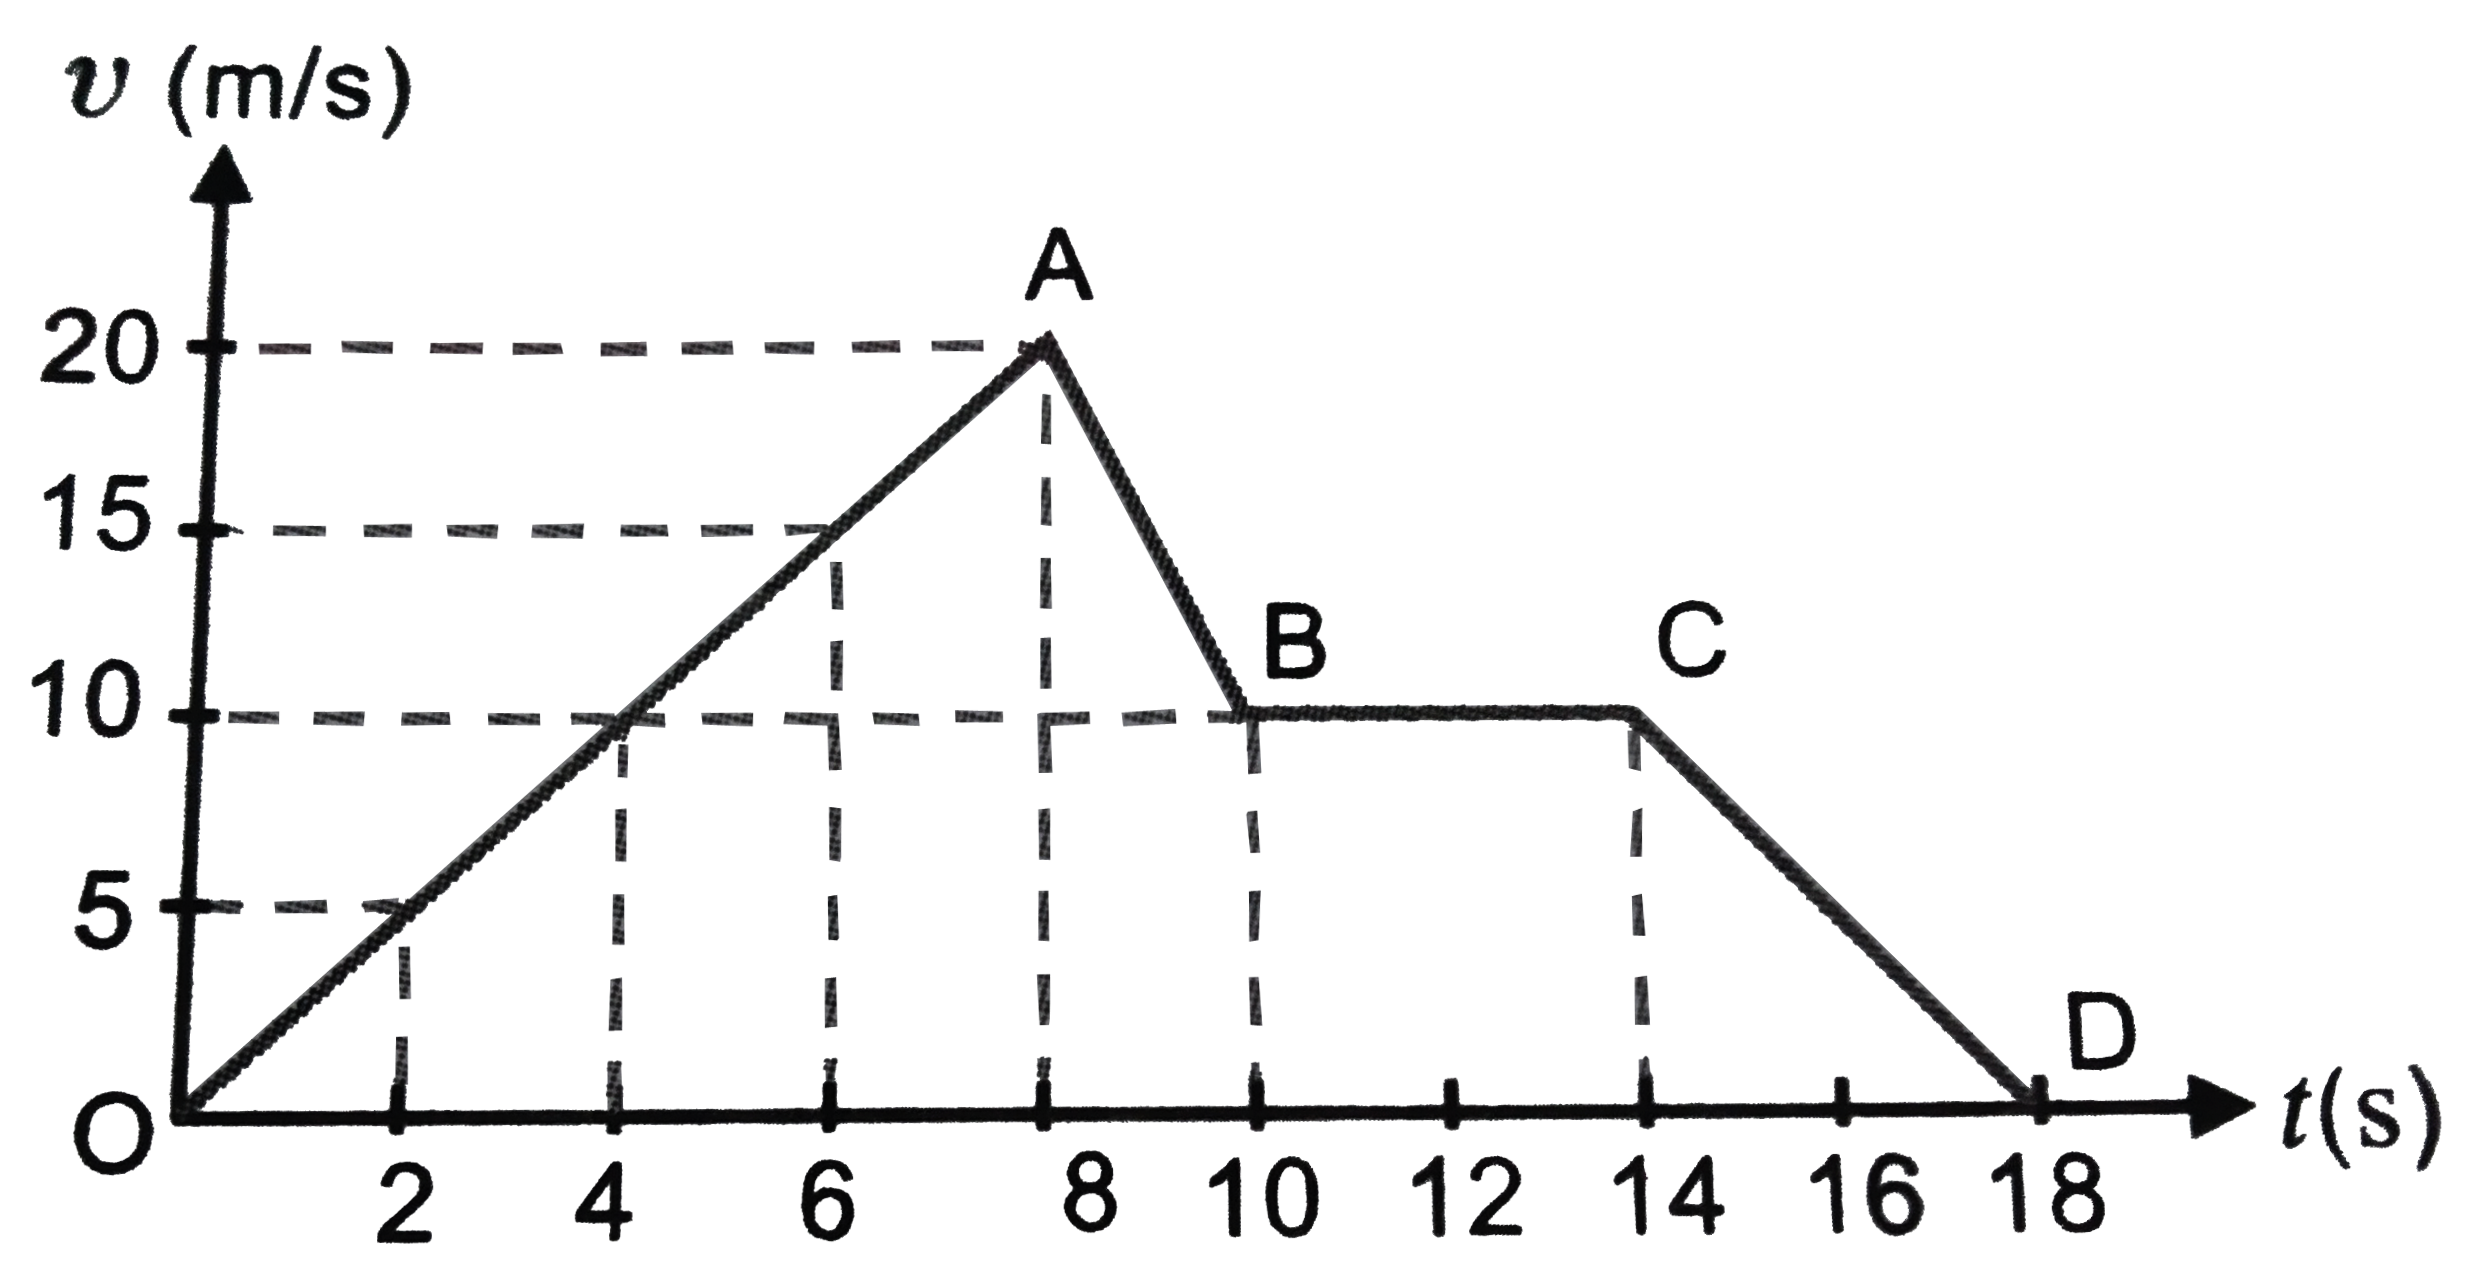
The velocity-tiem graph of a particle movitgn along a straight line is shown in the Fig. 2 ( b) . 34becurve OABCD.Calca––tethedistancecoveredbythepartic≤between(i) t =zero to t=18seconds(ii)t=2s→t=12s. And the maximum value of acceleration during this interval.
 .
.
(i) Total distance travelled from (O) to (18) s is the area which the velocit-tiem graph encleses with time axis. i.e. total distance coverd= distance travelled from o→8s+distancetravel≤dom 8→ 10 s+distancetravel≤dom 10 → 14 s+distancetravel≤dom 14 → 18 s<br>= 1/2 xx 8 xx 20 + 1/2 ( 10 + 20 ) xx 2 + 4 xx 10 + 1/2 xx 4 xxx 10 <br>= 170 m<br>Dostamcetravel≤dbetween 2→12sec±d=distancetravel≤dom2 to 8 s+distancetravel≤dgrom 8 → 10 s+distancetravel≤d 10 →12 s,<br>= 1/2 xx 6 xx ( 5 + 20 ) + 1/2 xx 2 xx ( 20 + 10) + 2 xx 10
=125m
Max, value of accelration is related with the steepest slope of velocituy-tiem graph gt It is from 8 to 10 s for th part (AB) of graph .
:. Slope of AB=20−1010−8=−5ms−2 .
Topper's Solved these Questions
- BOOK - PRADEEPCHAPTER - KINEMATICSEXERCISE - 3 Problems for practice67videos
KINEMATICS
- BOOK - PRADEEPCHAPTER - KINEMATICSEXERCISE - 4 Problems for practice45videos
KINEMATICS
- BOOK - PRADEEPCHAPTER - KINEMATICSEXERCISE - 1 Problems for practice25videos
KINEMATICS
- BOOK - PRADEEPCHAPTER - GRAVIATIONEXERCISE - Assertion-Reason Type Questions19videos
GRAVIATION
- BOOK - PRADEEPCHAPTER - LAWS OF MOTIONEXERCISE - Assertion- Reason Type Questions17videos
LAWS OF MOTION
Similar Questions
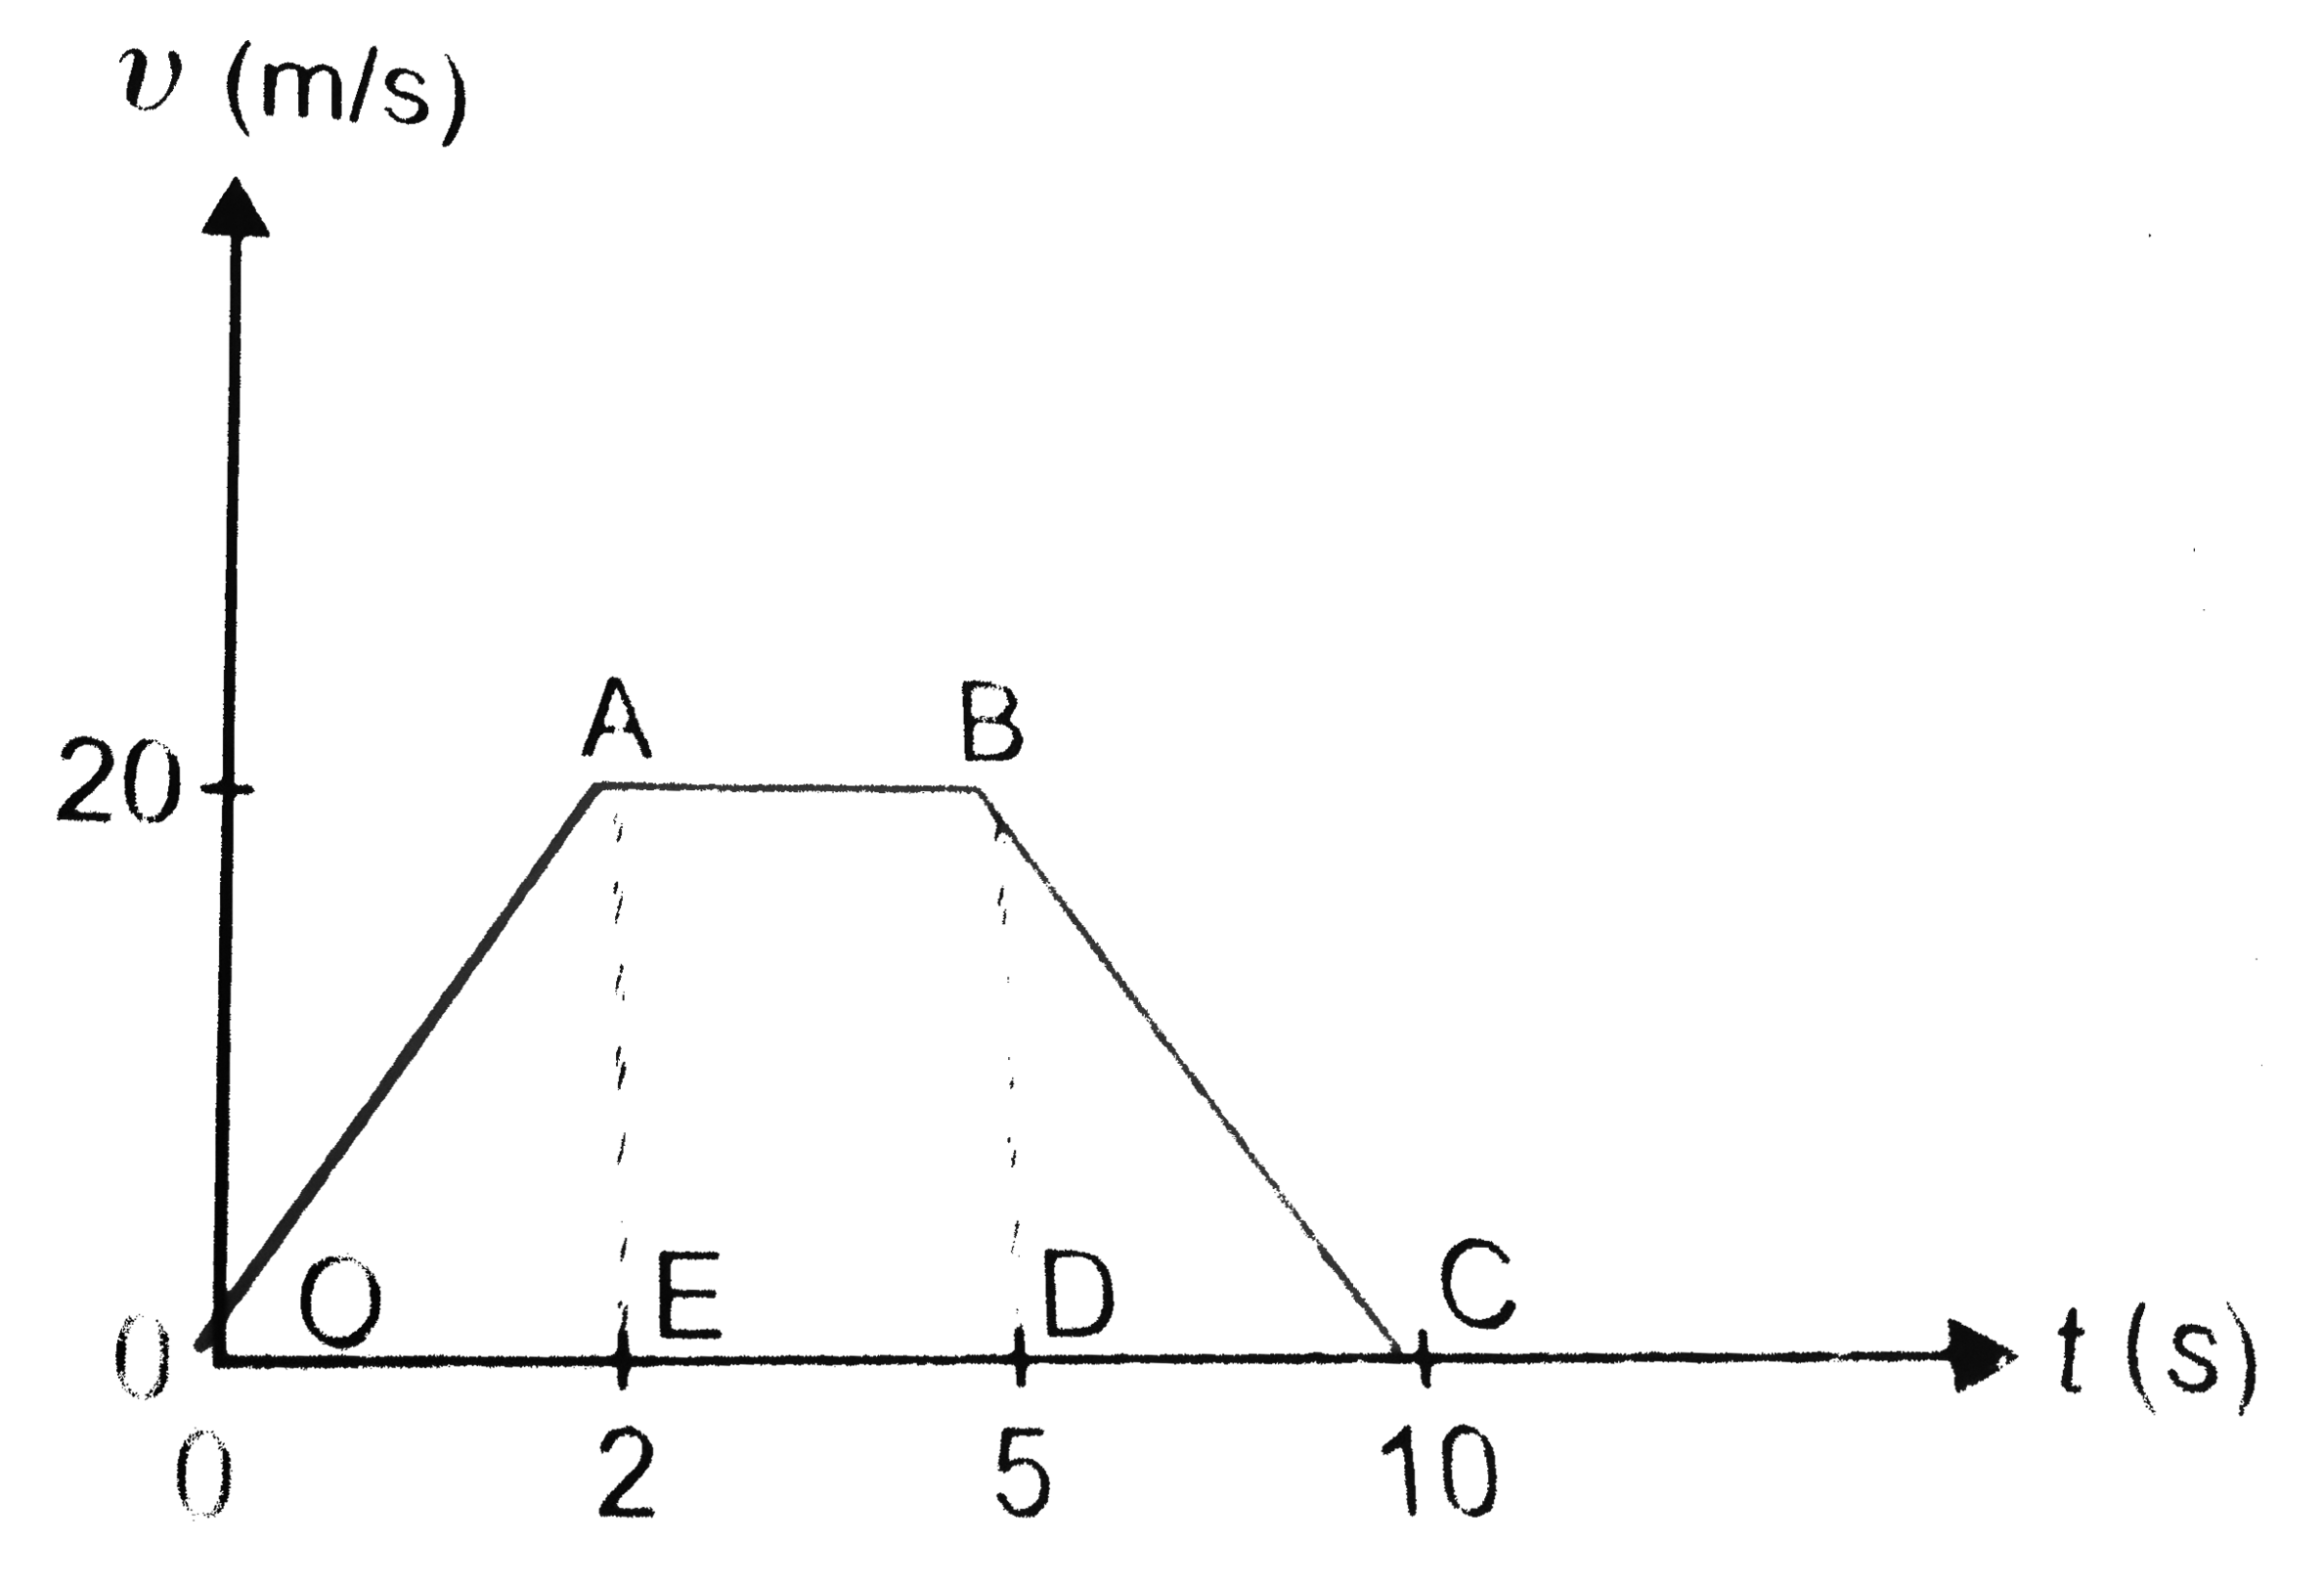
The velocity (u)-time (t) graph of an object moving alon a straight line is as shown is Fig. 2 (b) . 30. Calculate the distance covered by object between (i)t=0→t=5s (ii) t=0→t=10s.
 .View Solution
The velocity-time graph of a particle moving along a straight line is shown id Fig. 2 (b) . 33. Calculate the distance covered between t=0 to t=10seconds. Also find displacement tn time 0→10seconds.
 .View Solution
Knowledge Check
- Question 1 - Select One
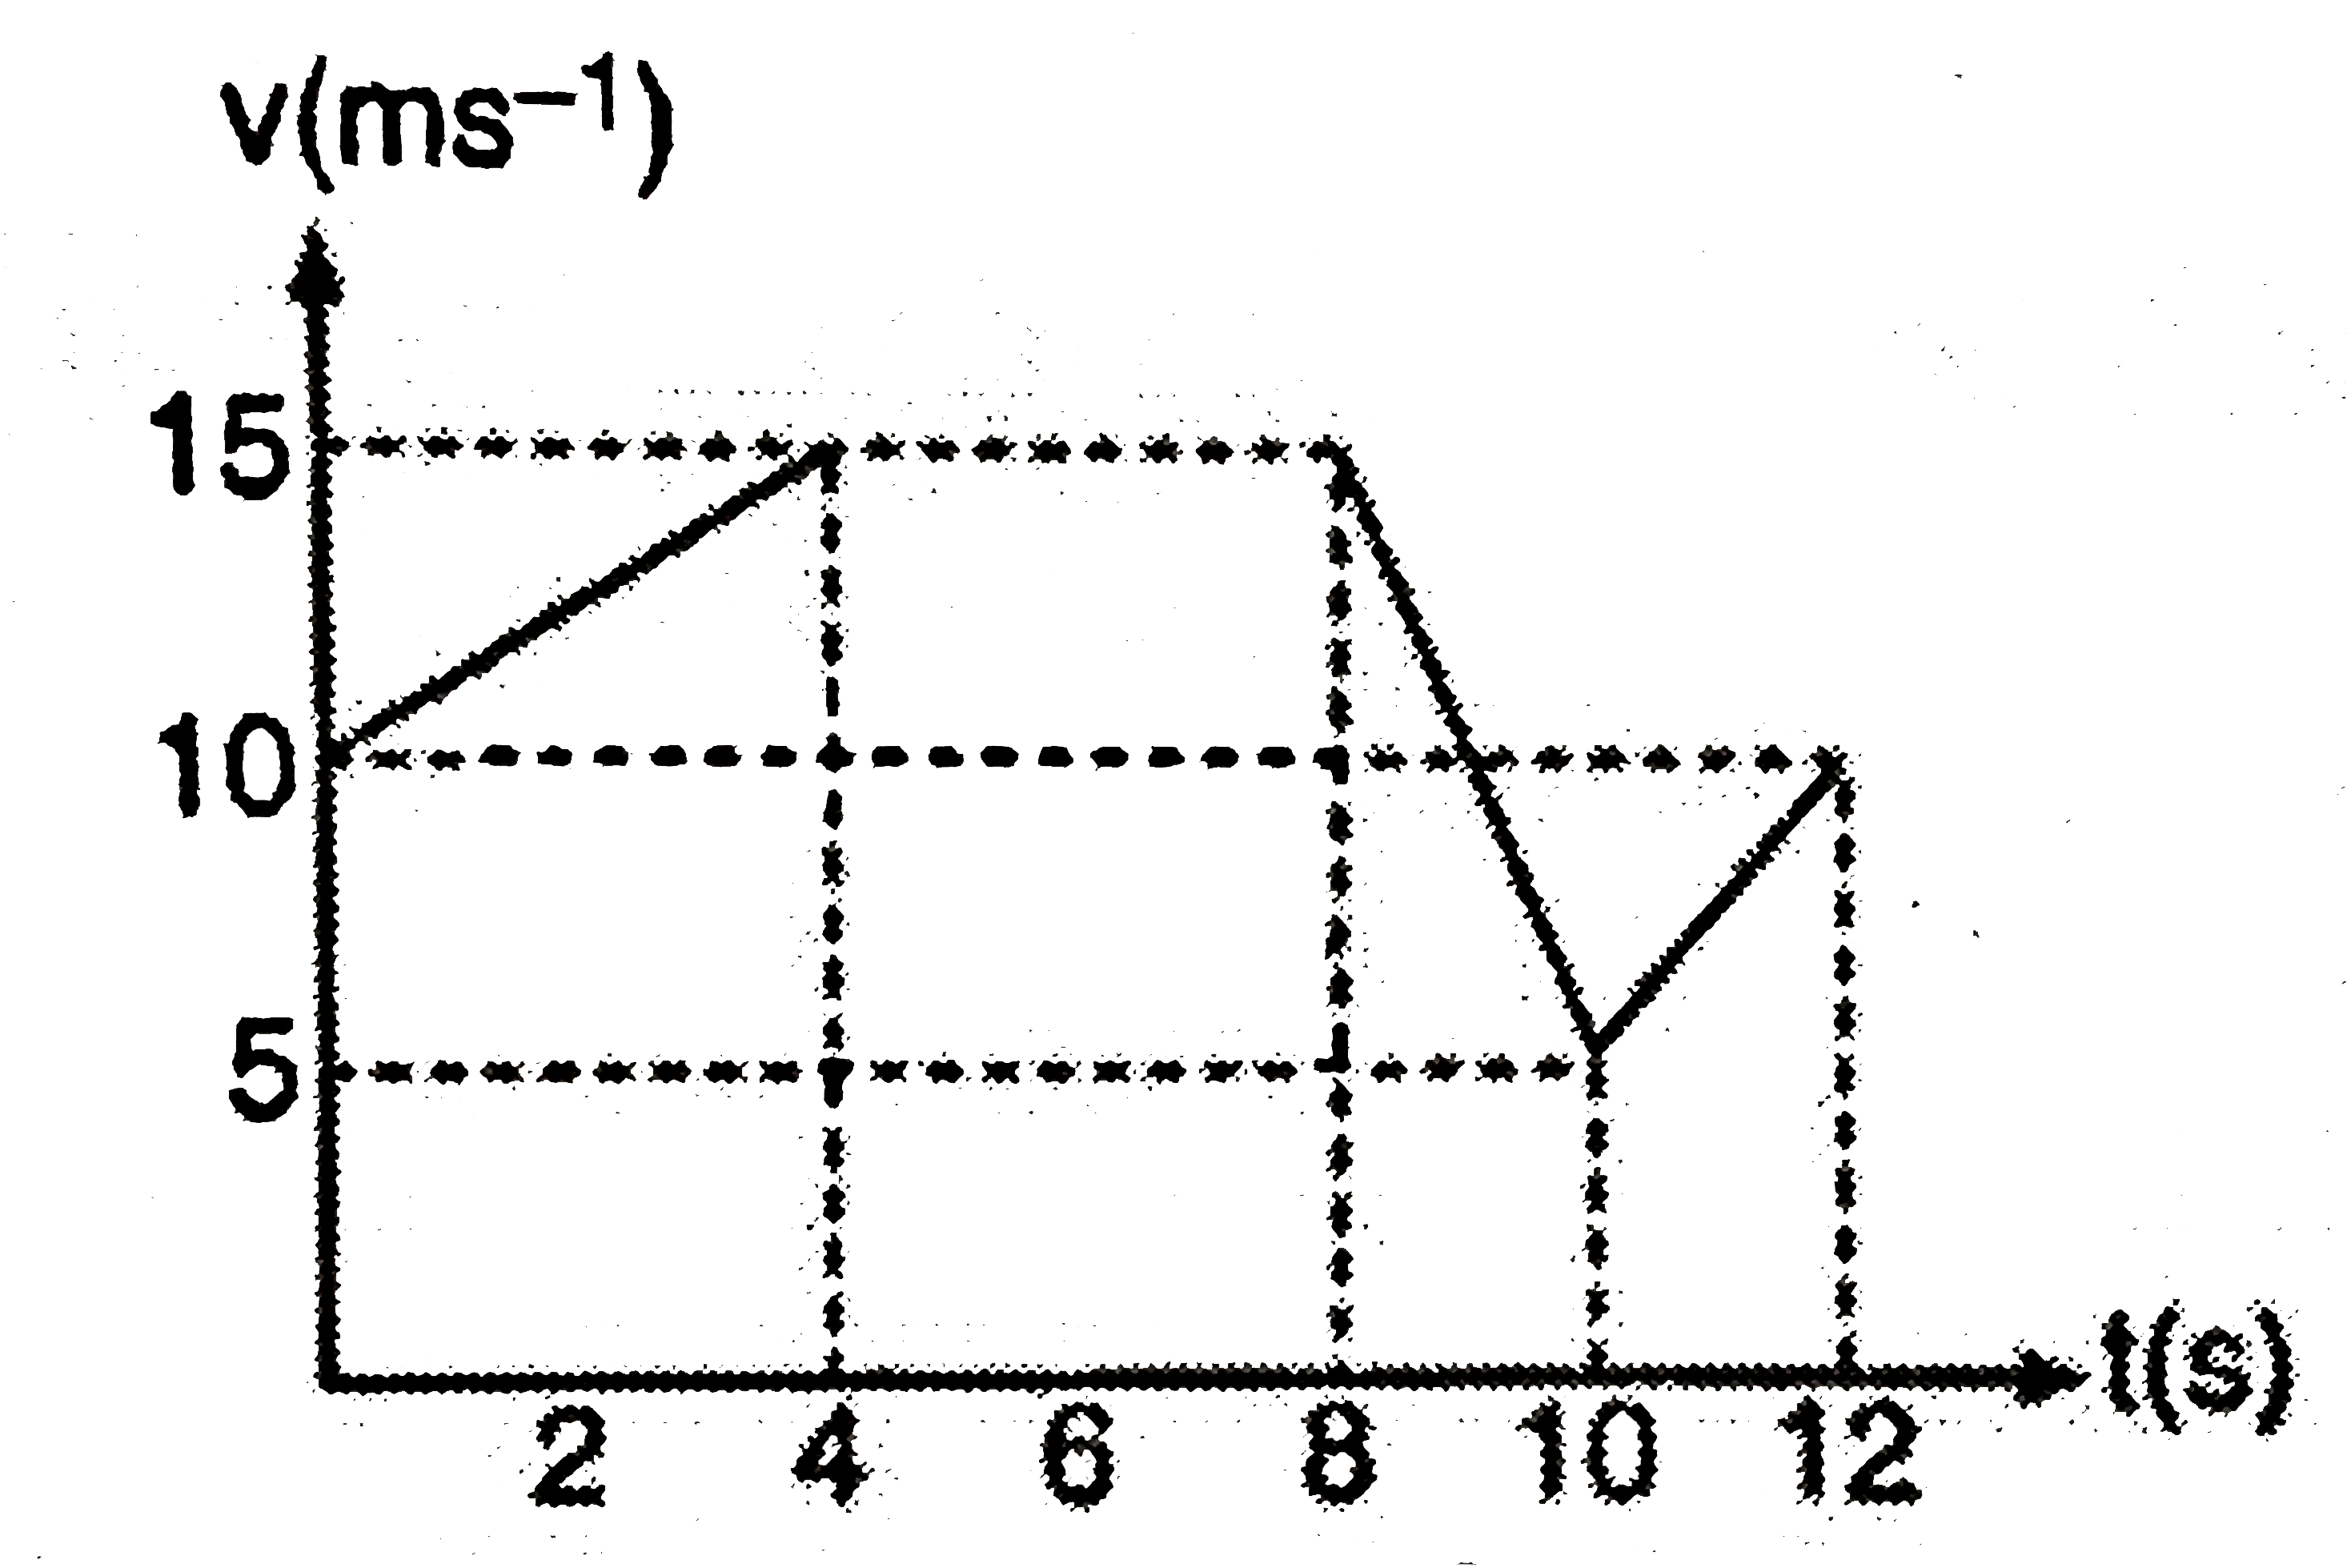
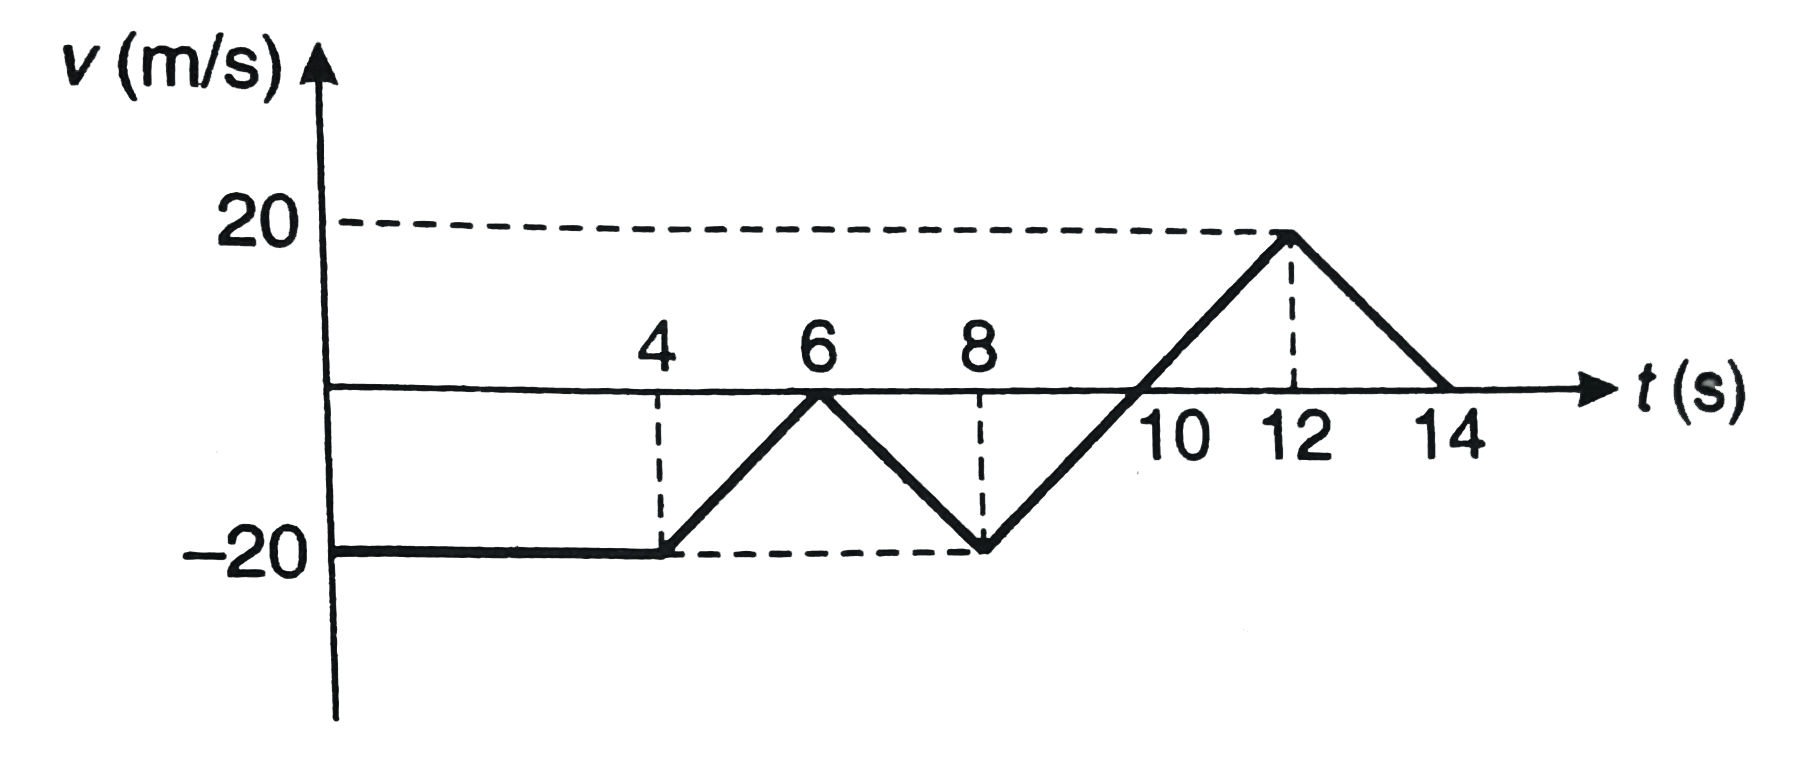
The velocity -time (v−t) graph of a particle moving in a straight line is shown in figure. The acceleration of the particle at t=9 is:
 AzeroB5ms−2C−5ms2D−2ms−2
 - Question 2 - Select One
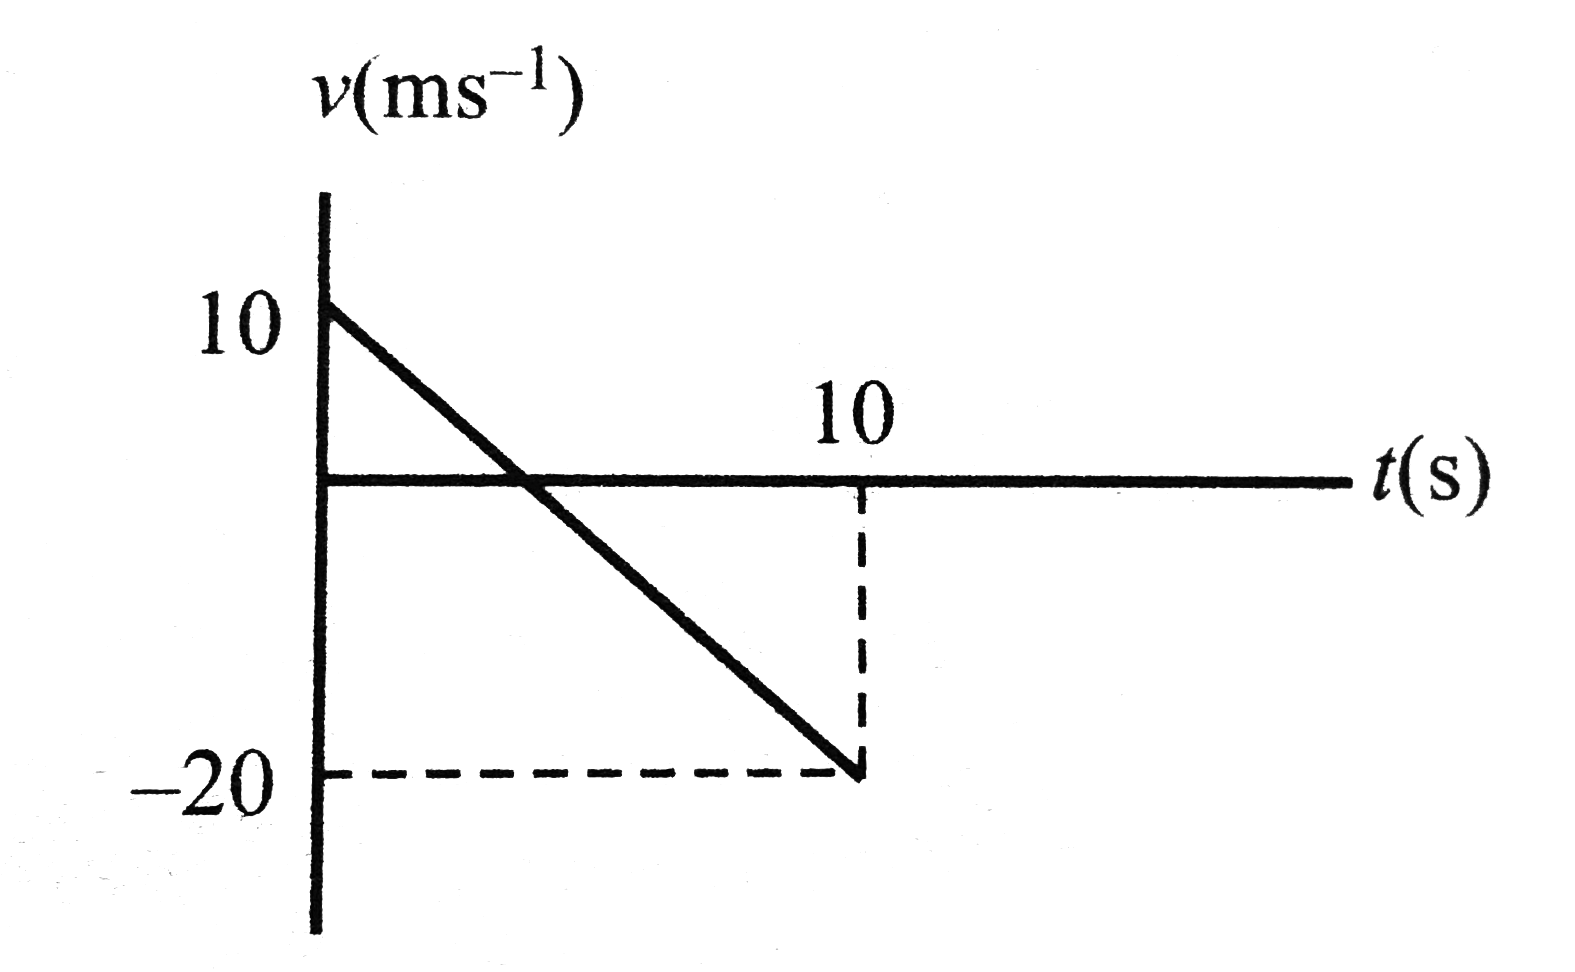
The velocity-time graph of a particle moving in a straight line is shown in figure. The mass of the particle is 2kg. Work done by all the forces acting on the particle in time interval between t=0 to t=10s is
 A(a) 300JB(b) −300JC(c) 400JD(d) −400J
 - Question 3 - Select One
The x-t graph of a particle moving along a straight line is shown in figure

The v-t graph of the particle is correctly shown byA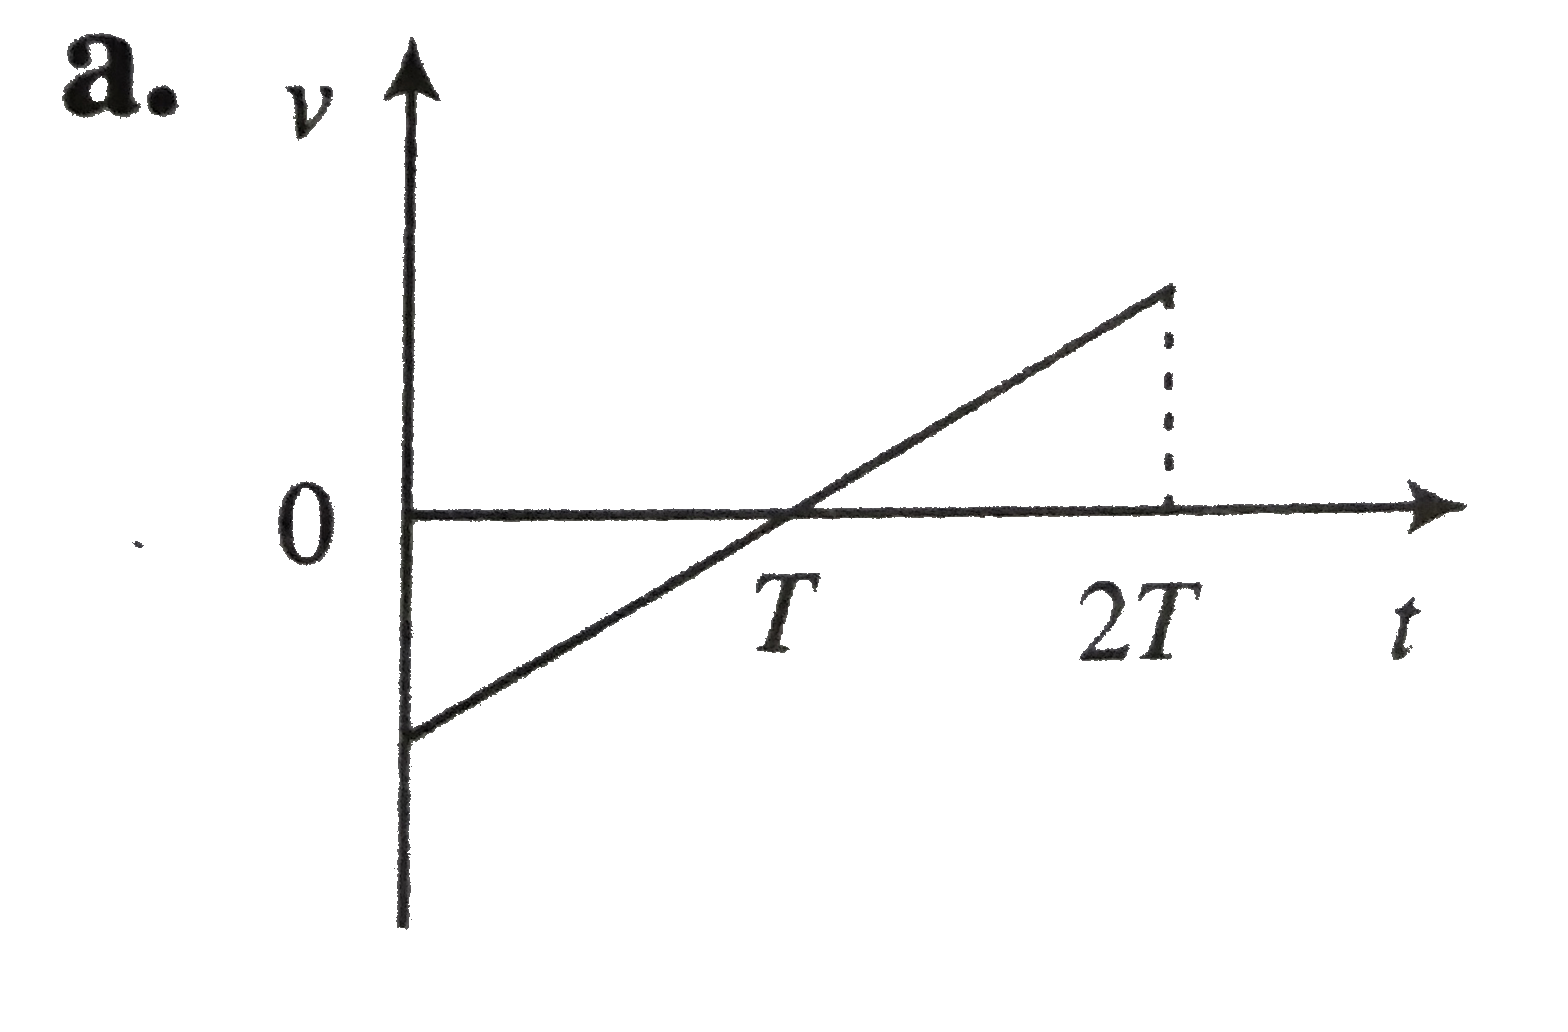 B
B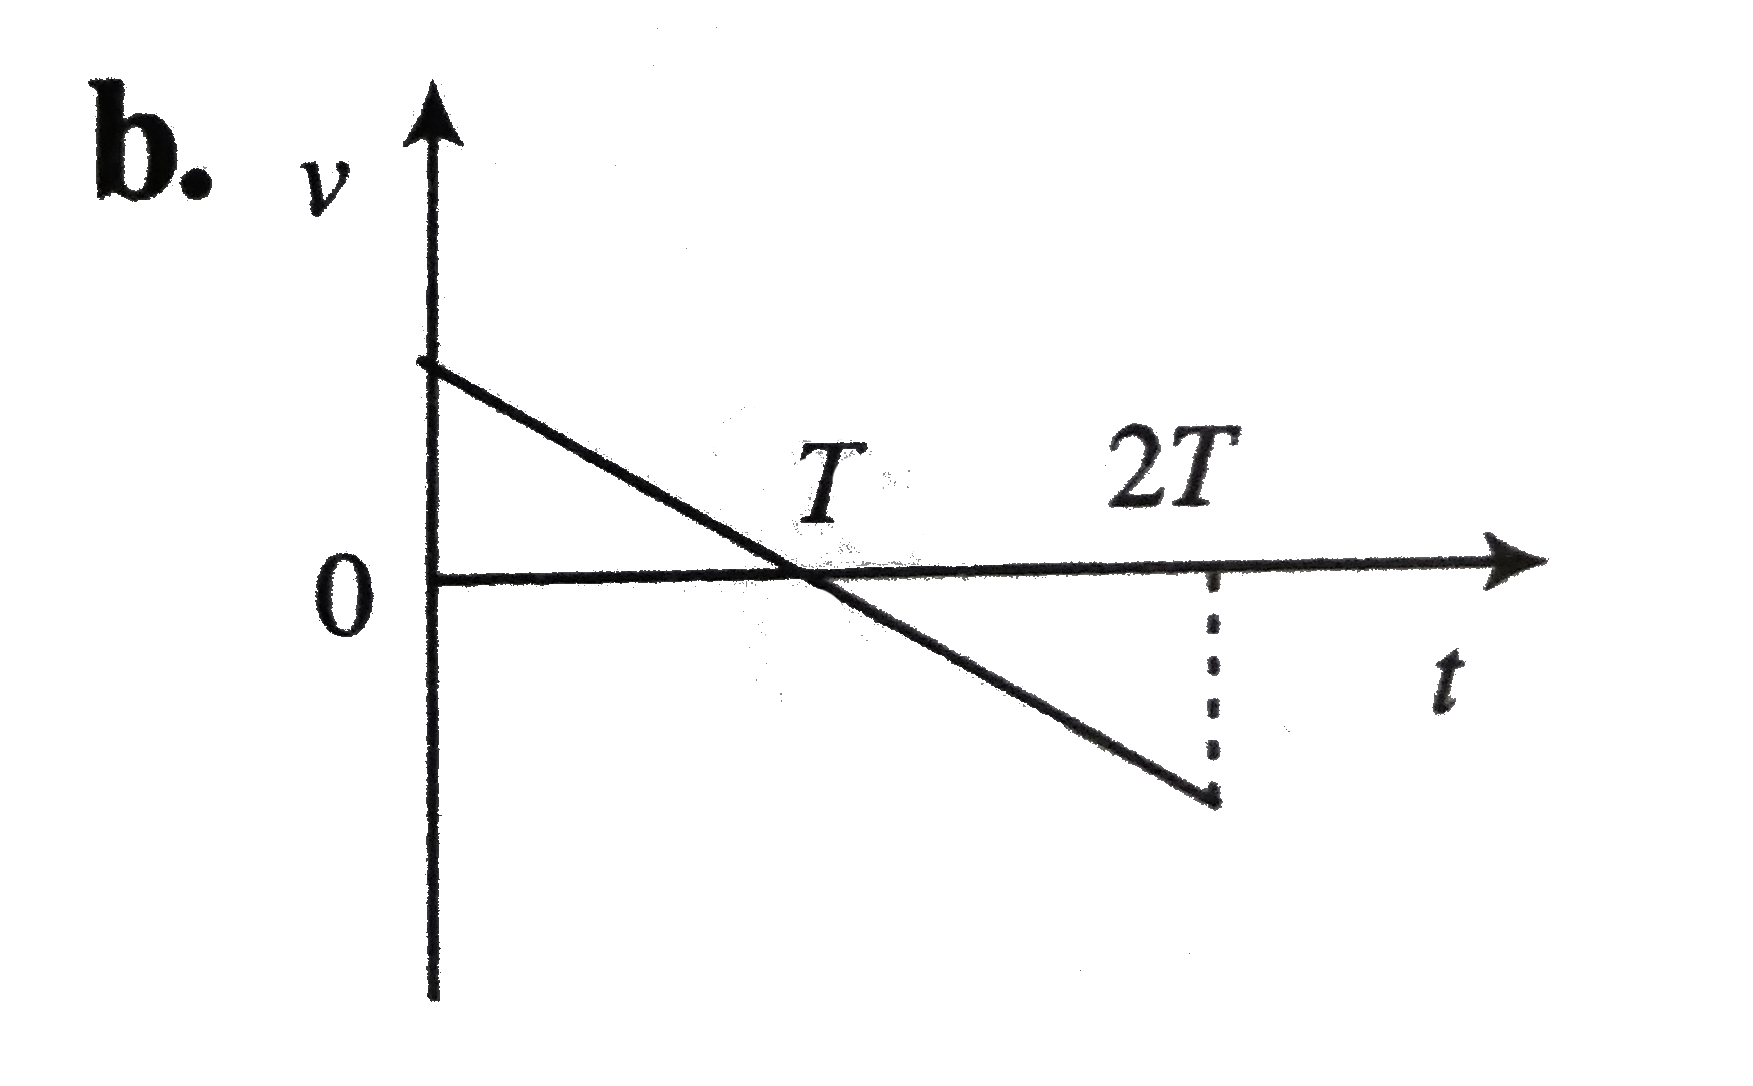 C
C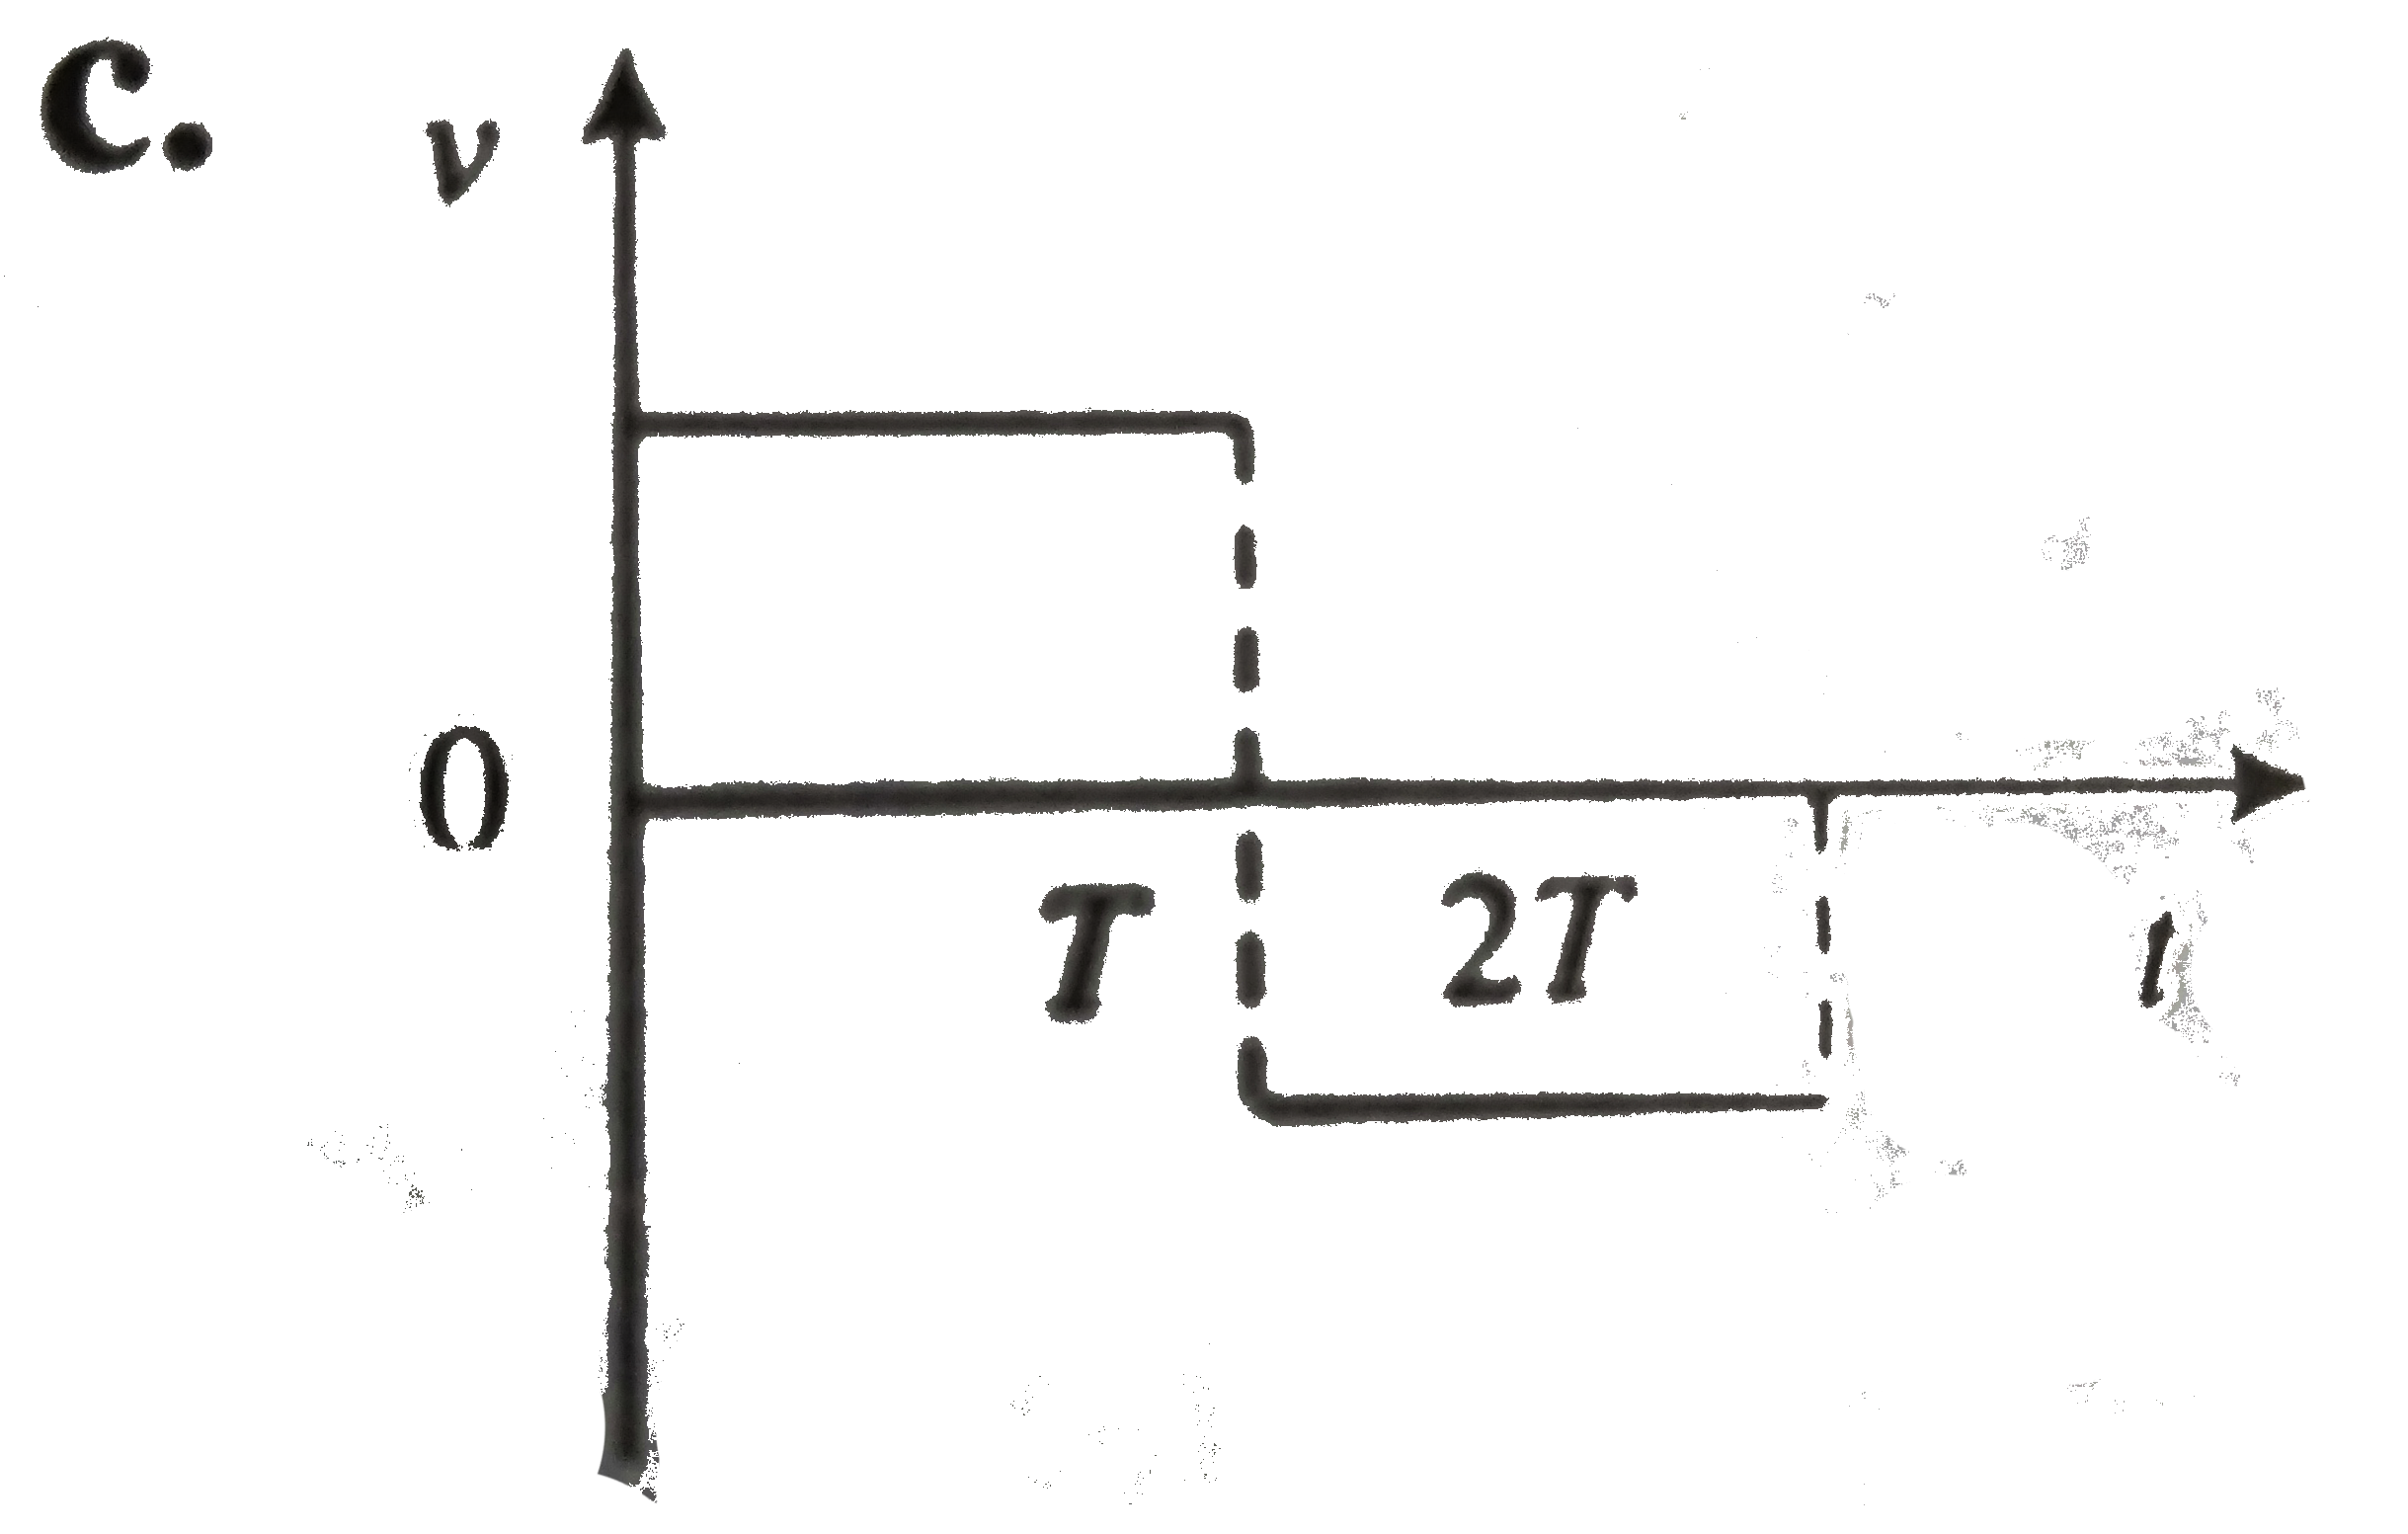 D
D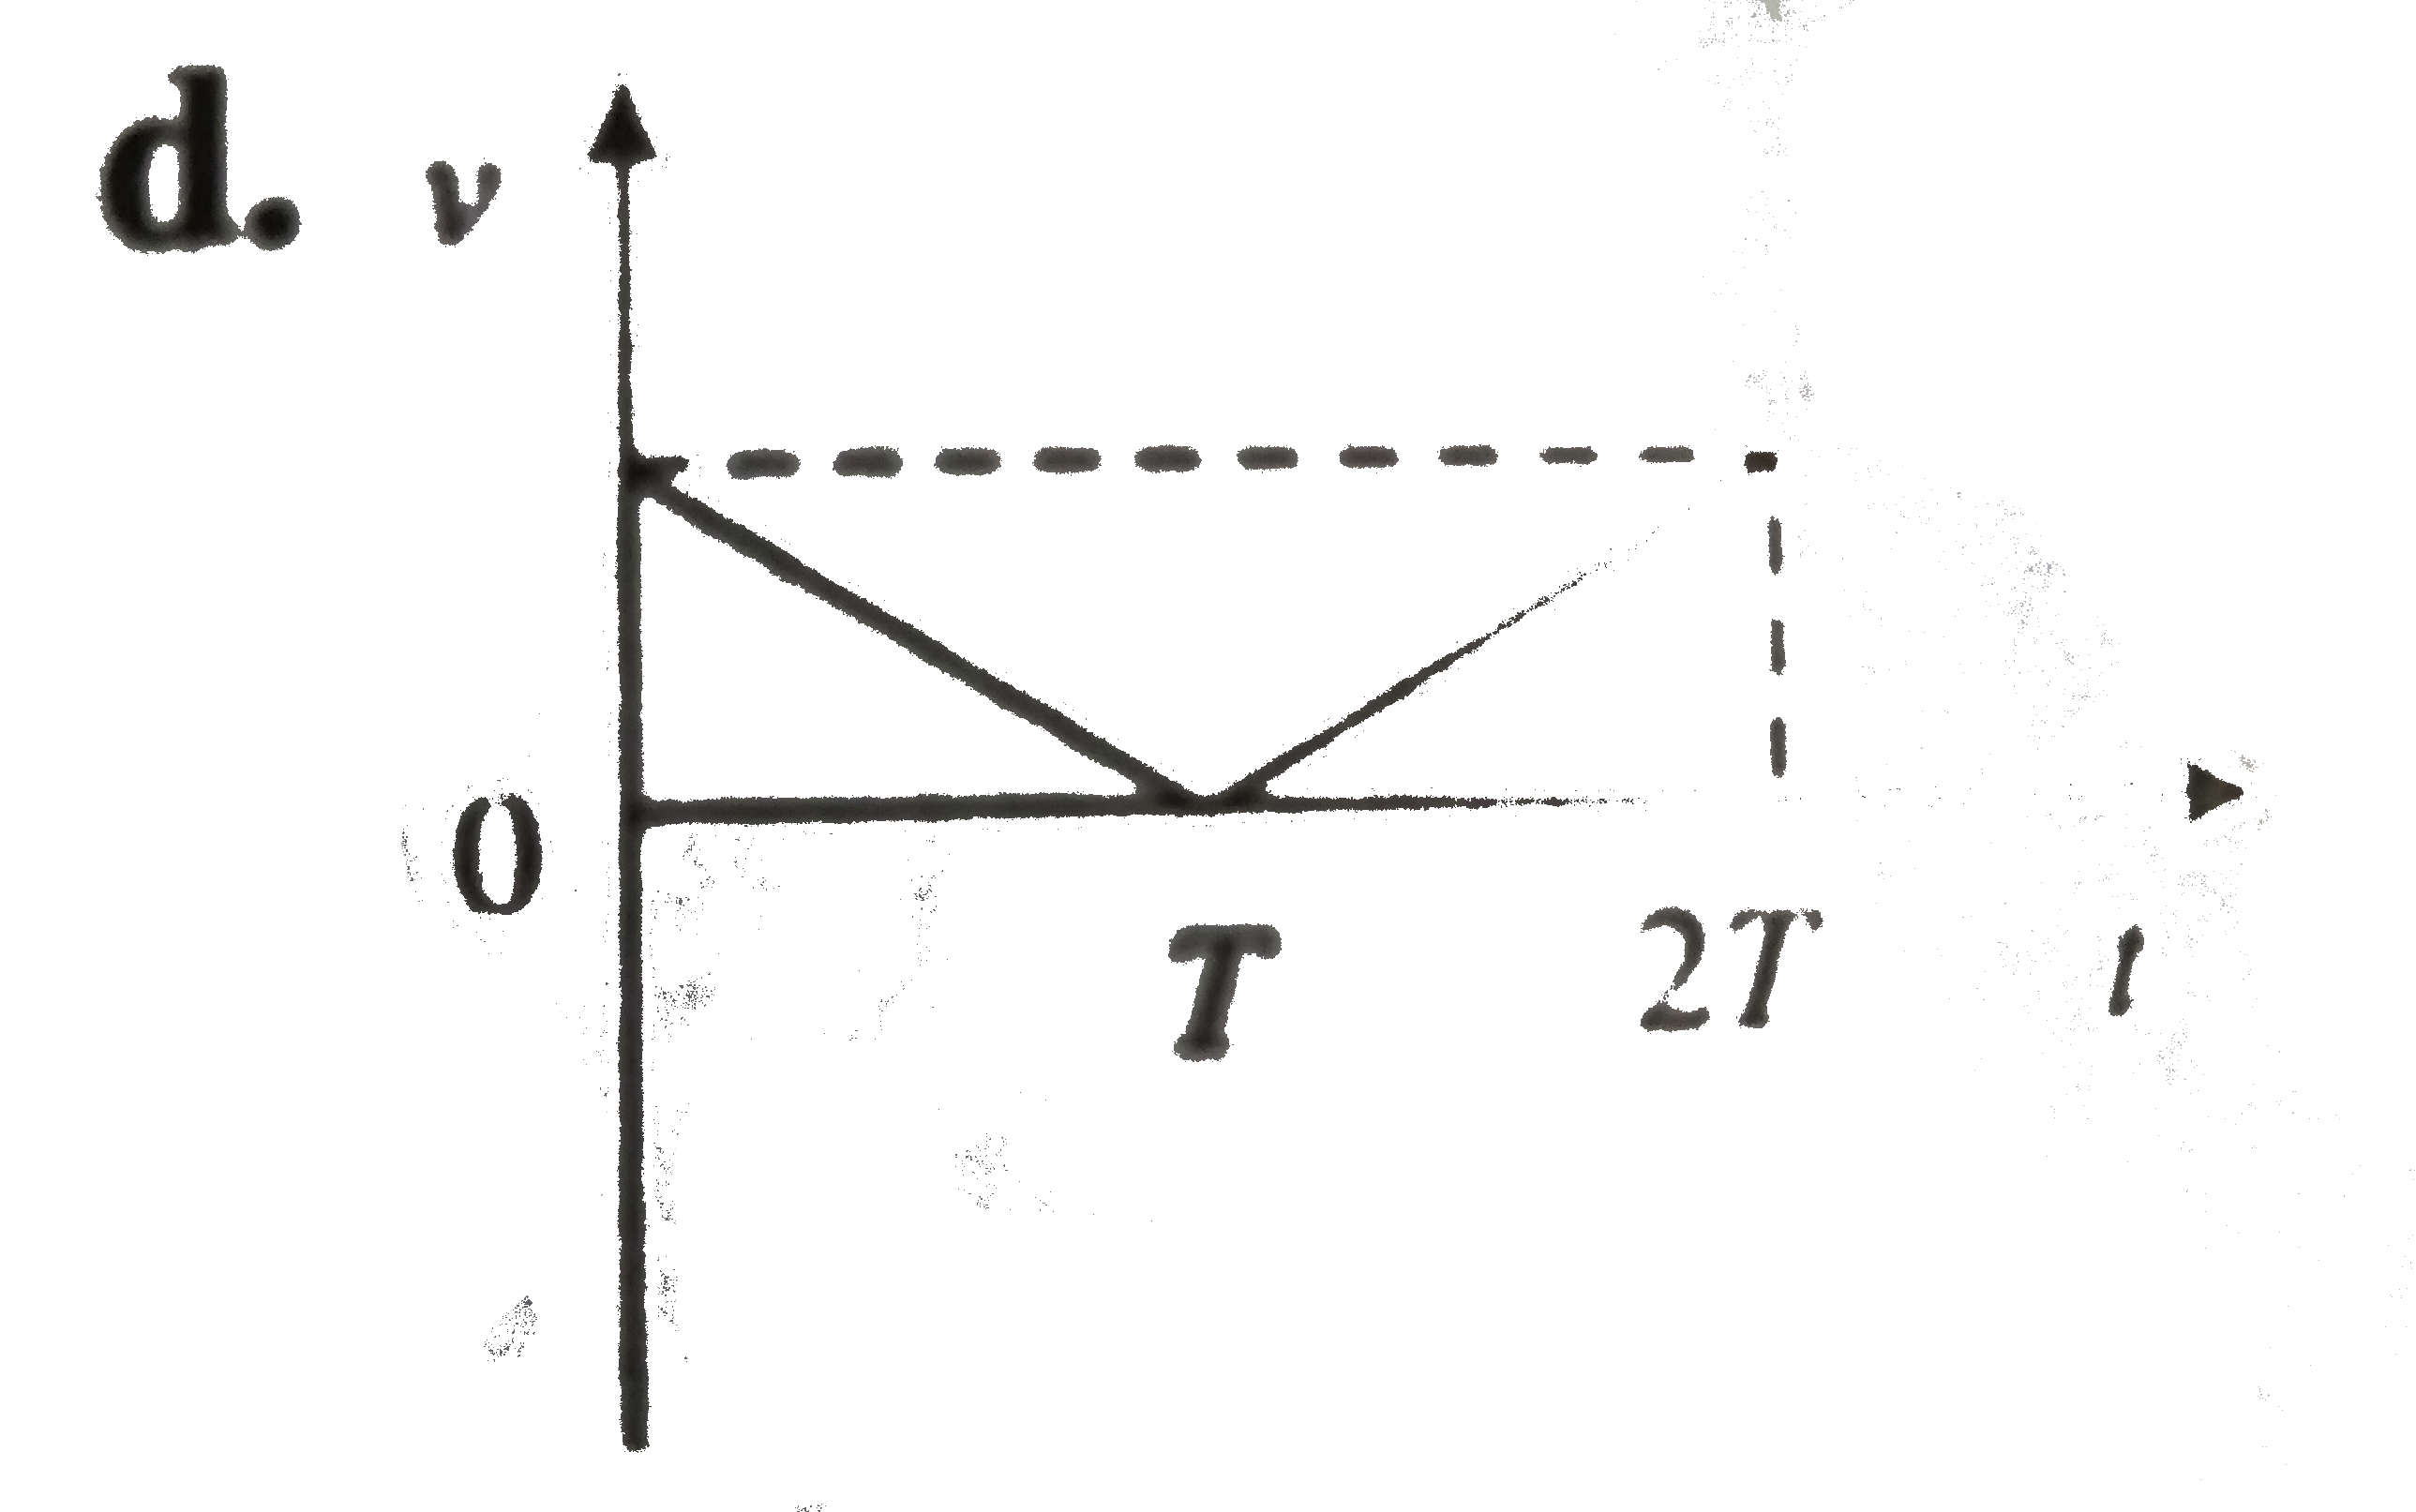
The velocity (u)-time (t) graph of an object moving along a straight line is as shown is Fig. 2 (b) . 30. Calculate the distance covered by object between (i)t=0→t=5s (ii) t=0→t=10s.
 .View Solution
The velocity (u)-time (t) graph of an object moving along a straight line is as shown is Fig. 2 (b) . 30. Calculate the distance covered by object between (i)t=0→t=5s (ii) t=0→t=10s.
 .View Solution
Velocity-time graph of a particle moving in a straight line is shown in figure. At time t=0.s=20m. Plot a-t and s-t graphs of the particle.
 View Solution
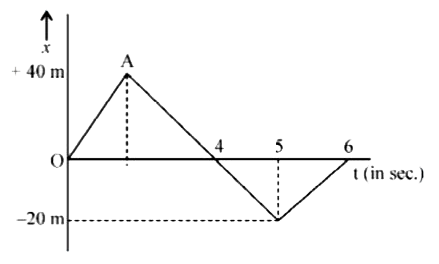
s-t graph of a particle in motion is shown in Fig. Calculate
Average speedView SolutionThe x-t graph of a particle moving along a straight line is shown in figure
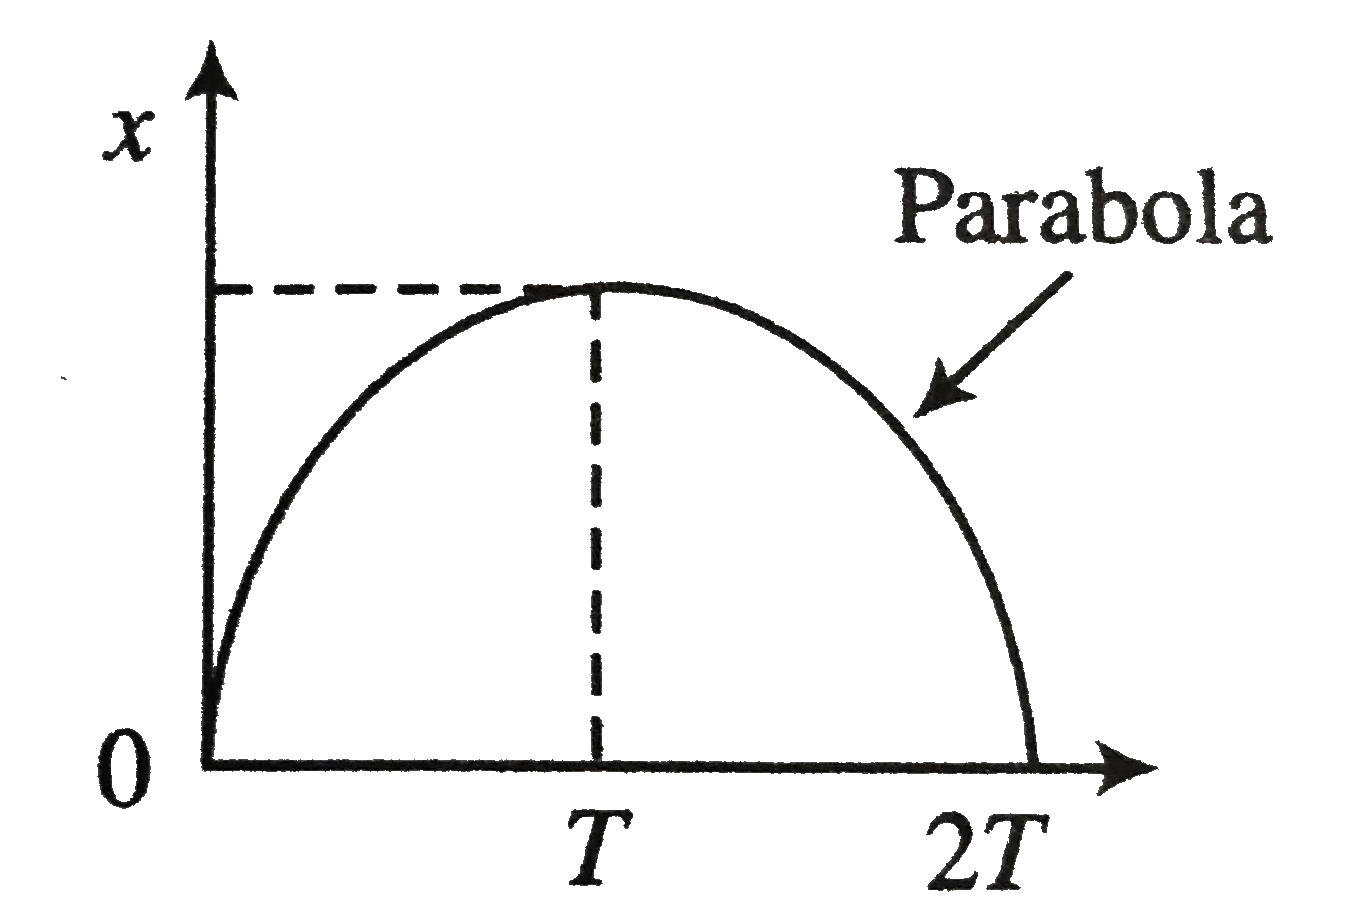
The a-t graph of the particle is correctly shown byView Solution

