Using the information in the graph, which statements is true?
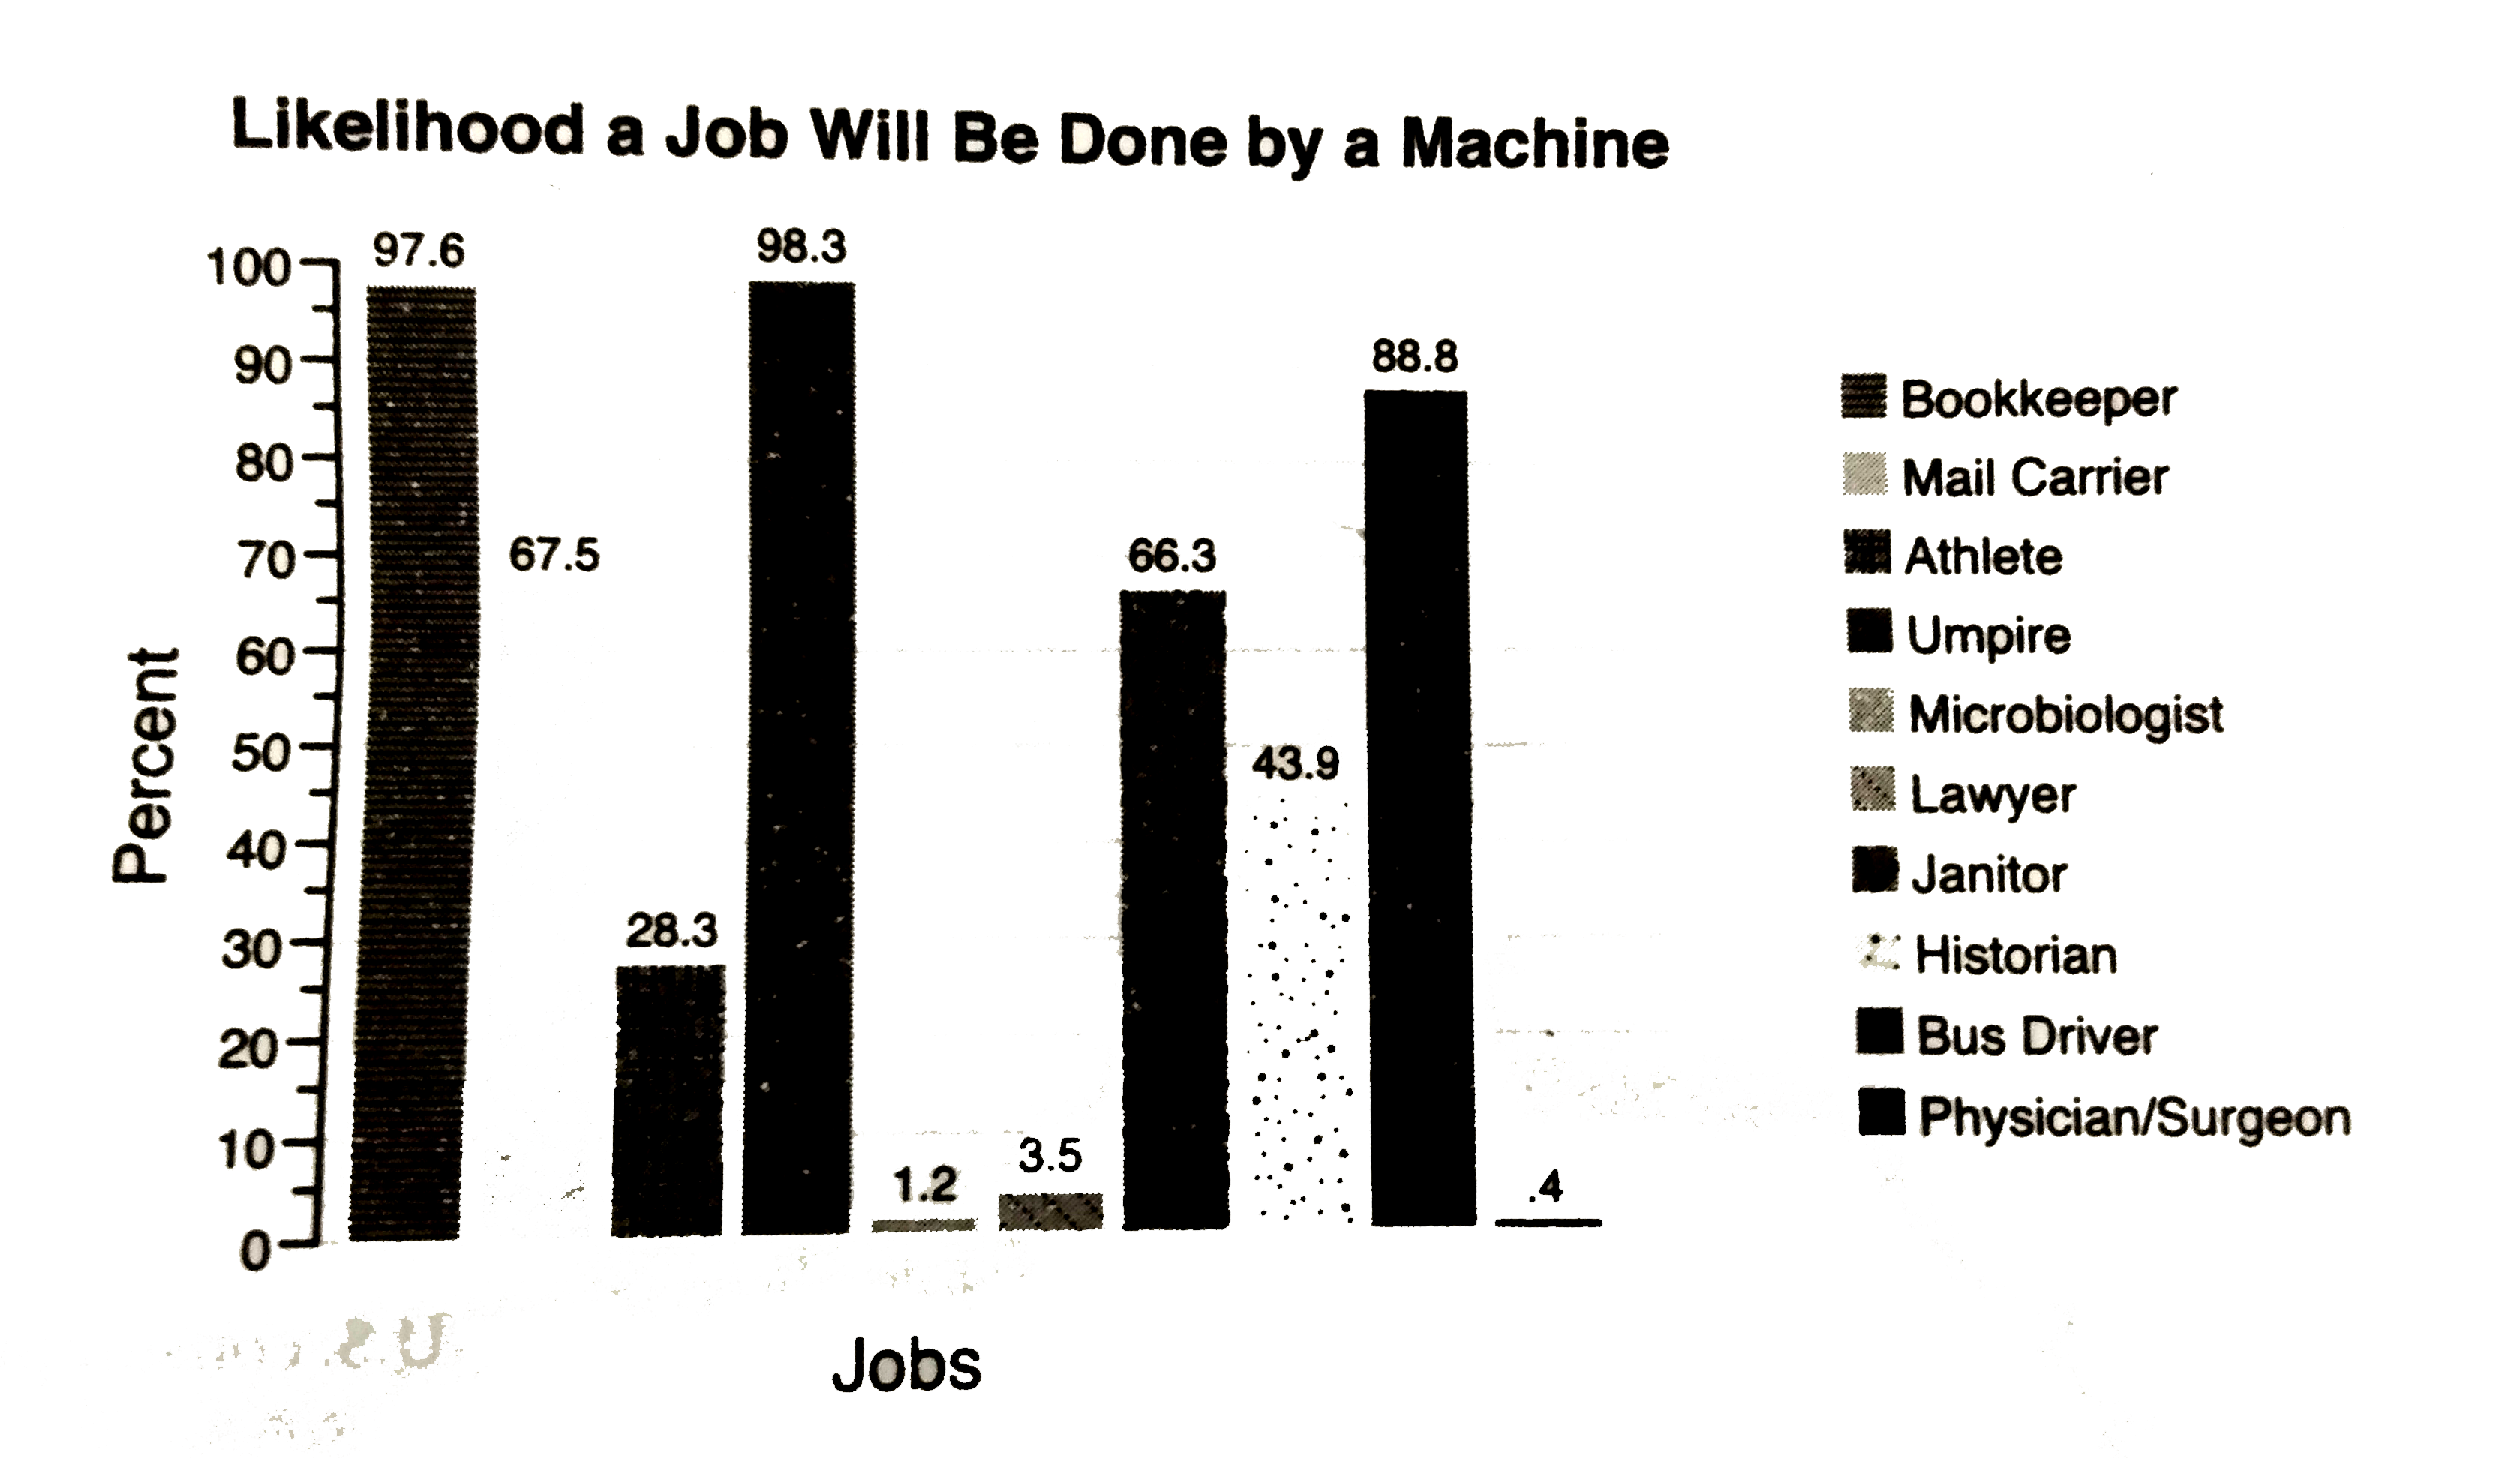
GPS and automation will lead to bus drivers being obsolete.
careers with a high liklihood of a machine performing the job have poor employment outlooks.
A historian is less likely to have their job performed by a machine than a janitor is.
More people are employed as umpires than any other profession.
The correct Answer is:C
(C ) Again, only use the evidence given. We cannot make conclusion about any employment outlooks as in (A) and (B). Nor can we make assumptions about the nmber of people currecntly employed in these prefessions as in (D). However, we use the graph to show that janitorial jobs are more likely to be completed by machinery than historian jobs, making (C ) correct.
Topper's Solved these Questions
Similar Questions
Yeast is used in the commercial production of ___i__ and_ ii_ The information in which alternative completes the given statement?
View SolutionWhen a stretched membrane is beaten, it starts ….i……….. This phenomenon is used to make a ……ii…..
The information in which alternative completes the given statements?
View Solution
Knowledge Check
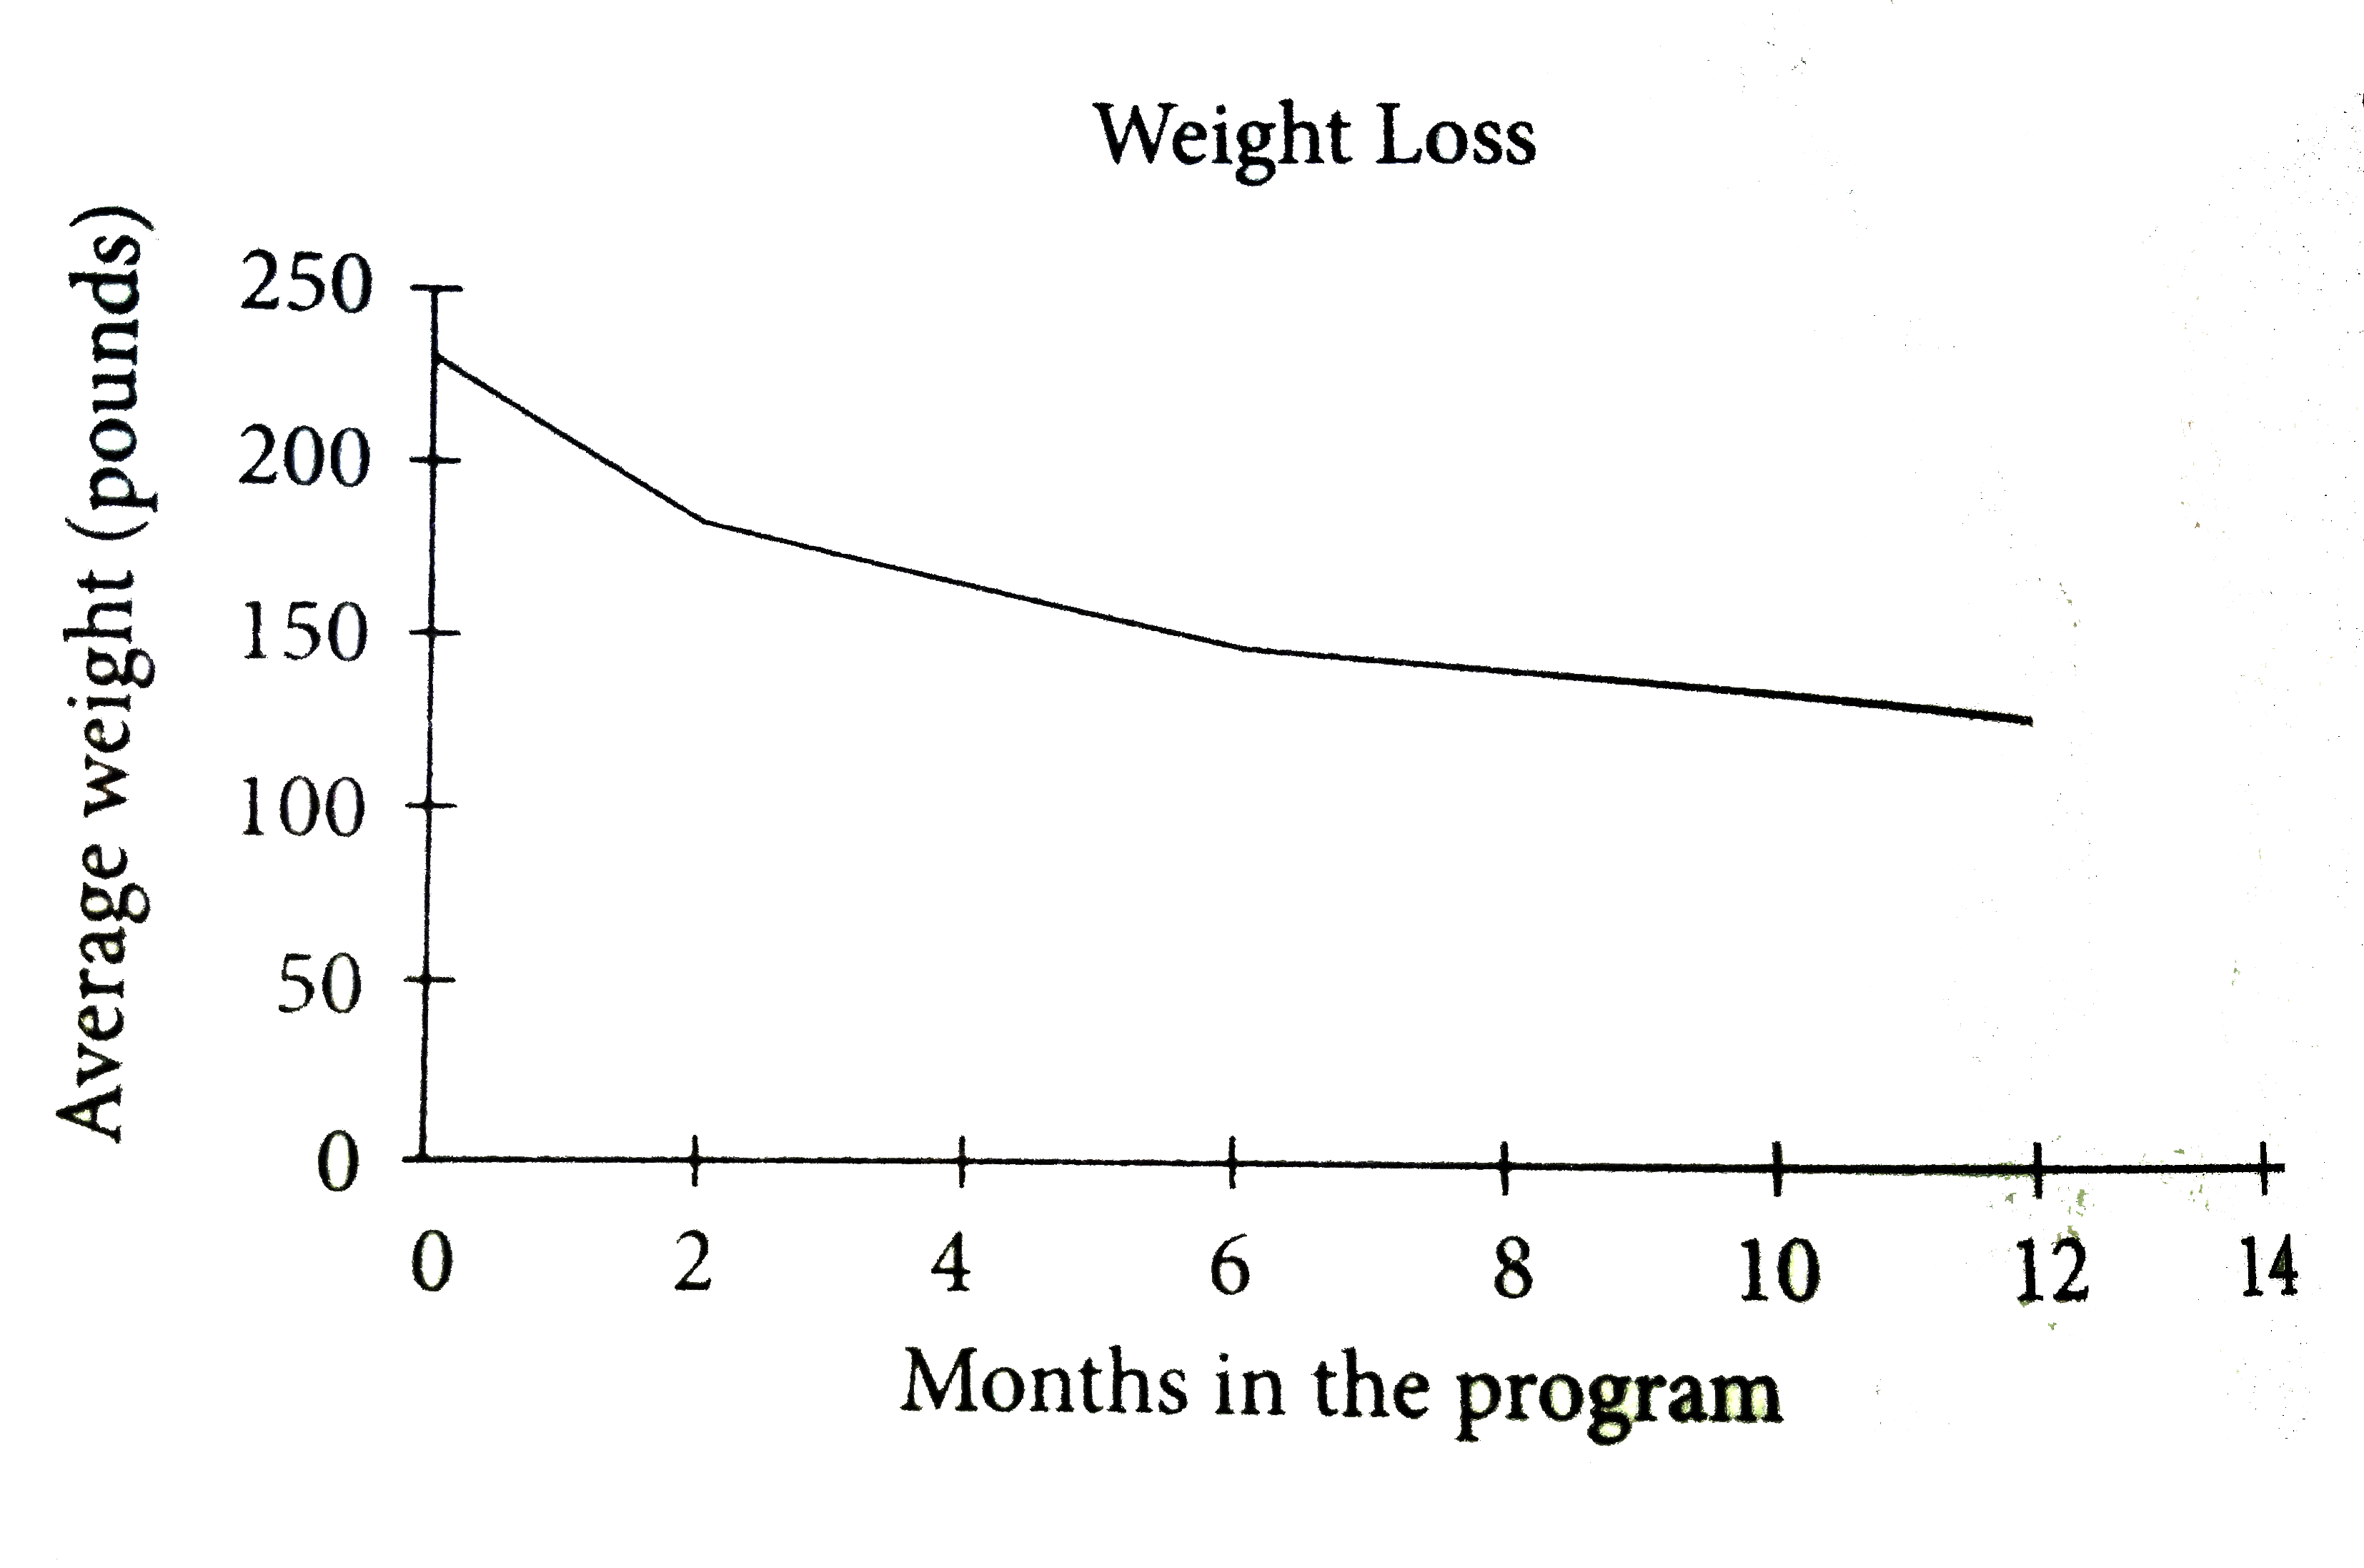
The graph above shows the average weight for the members of a weight loss program,for each month a member is in the program. According to the information in the graph, which of the following must be true?AThe average weight loss per month is the same regardless of the number of months a member is in the program.BThe average weight loss per month for members who are in the program more than 150 months is less than that for members who are in the program less than 150 months.CThe average weight loss per month for members who are in the program more than 6 months is less than that for members who are In the program less than 6 months.DThe average weight loss per month for members who are in the program more than 6 months is greater than that for members who are in the program less than 6 months.Study the following graph carefully and answer the questions that follow
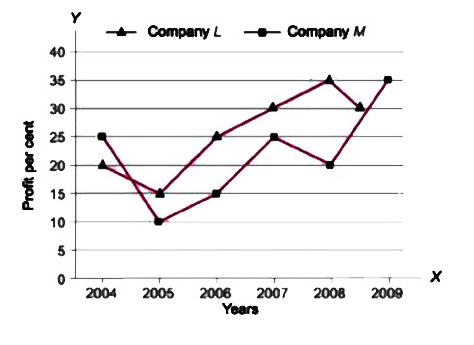
Which of the following statements is true with respect to the above graph ?ACompany M made the highest profit in the year 2009BCompany L made the least profit in the year 2005CThe ratio of the profits earned by company L and company M in the year 2006 was 6:5DCompany L made the highest profit in the year 2008A graph between vapour pressure and temperature of few liquids is given below. Study the graph and answer following question.
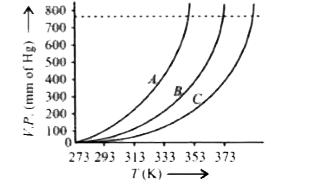
Which of the following statements is not true?ABoiling point of a liquid is the temperature at which its vapour pressure becomes equal to atmospheric pressure.BBoiling point of water can be increased by increased the pressure above the atmospheric pressureCIf liquid B is heated in a closed vessel it will boil at 353 KDLiquid C has higher boilingk point than B due to higher intermolecular forces.
A graph between vapour pressure and temperature of few liquids is given below . Study the graph and answer the following :
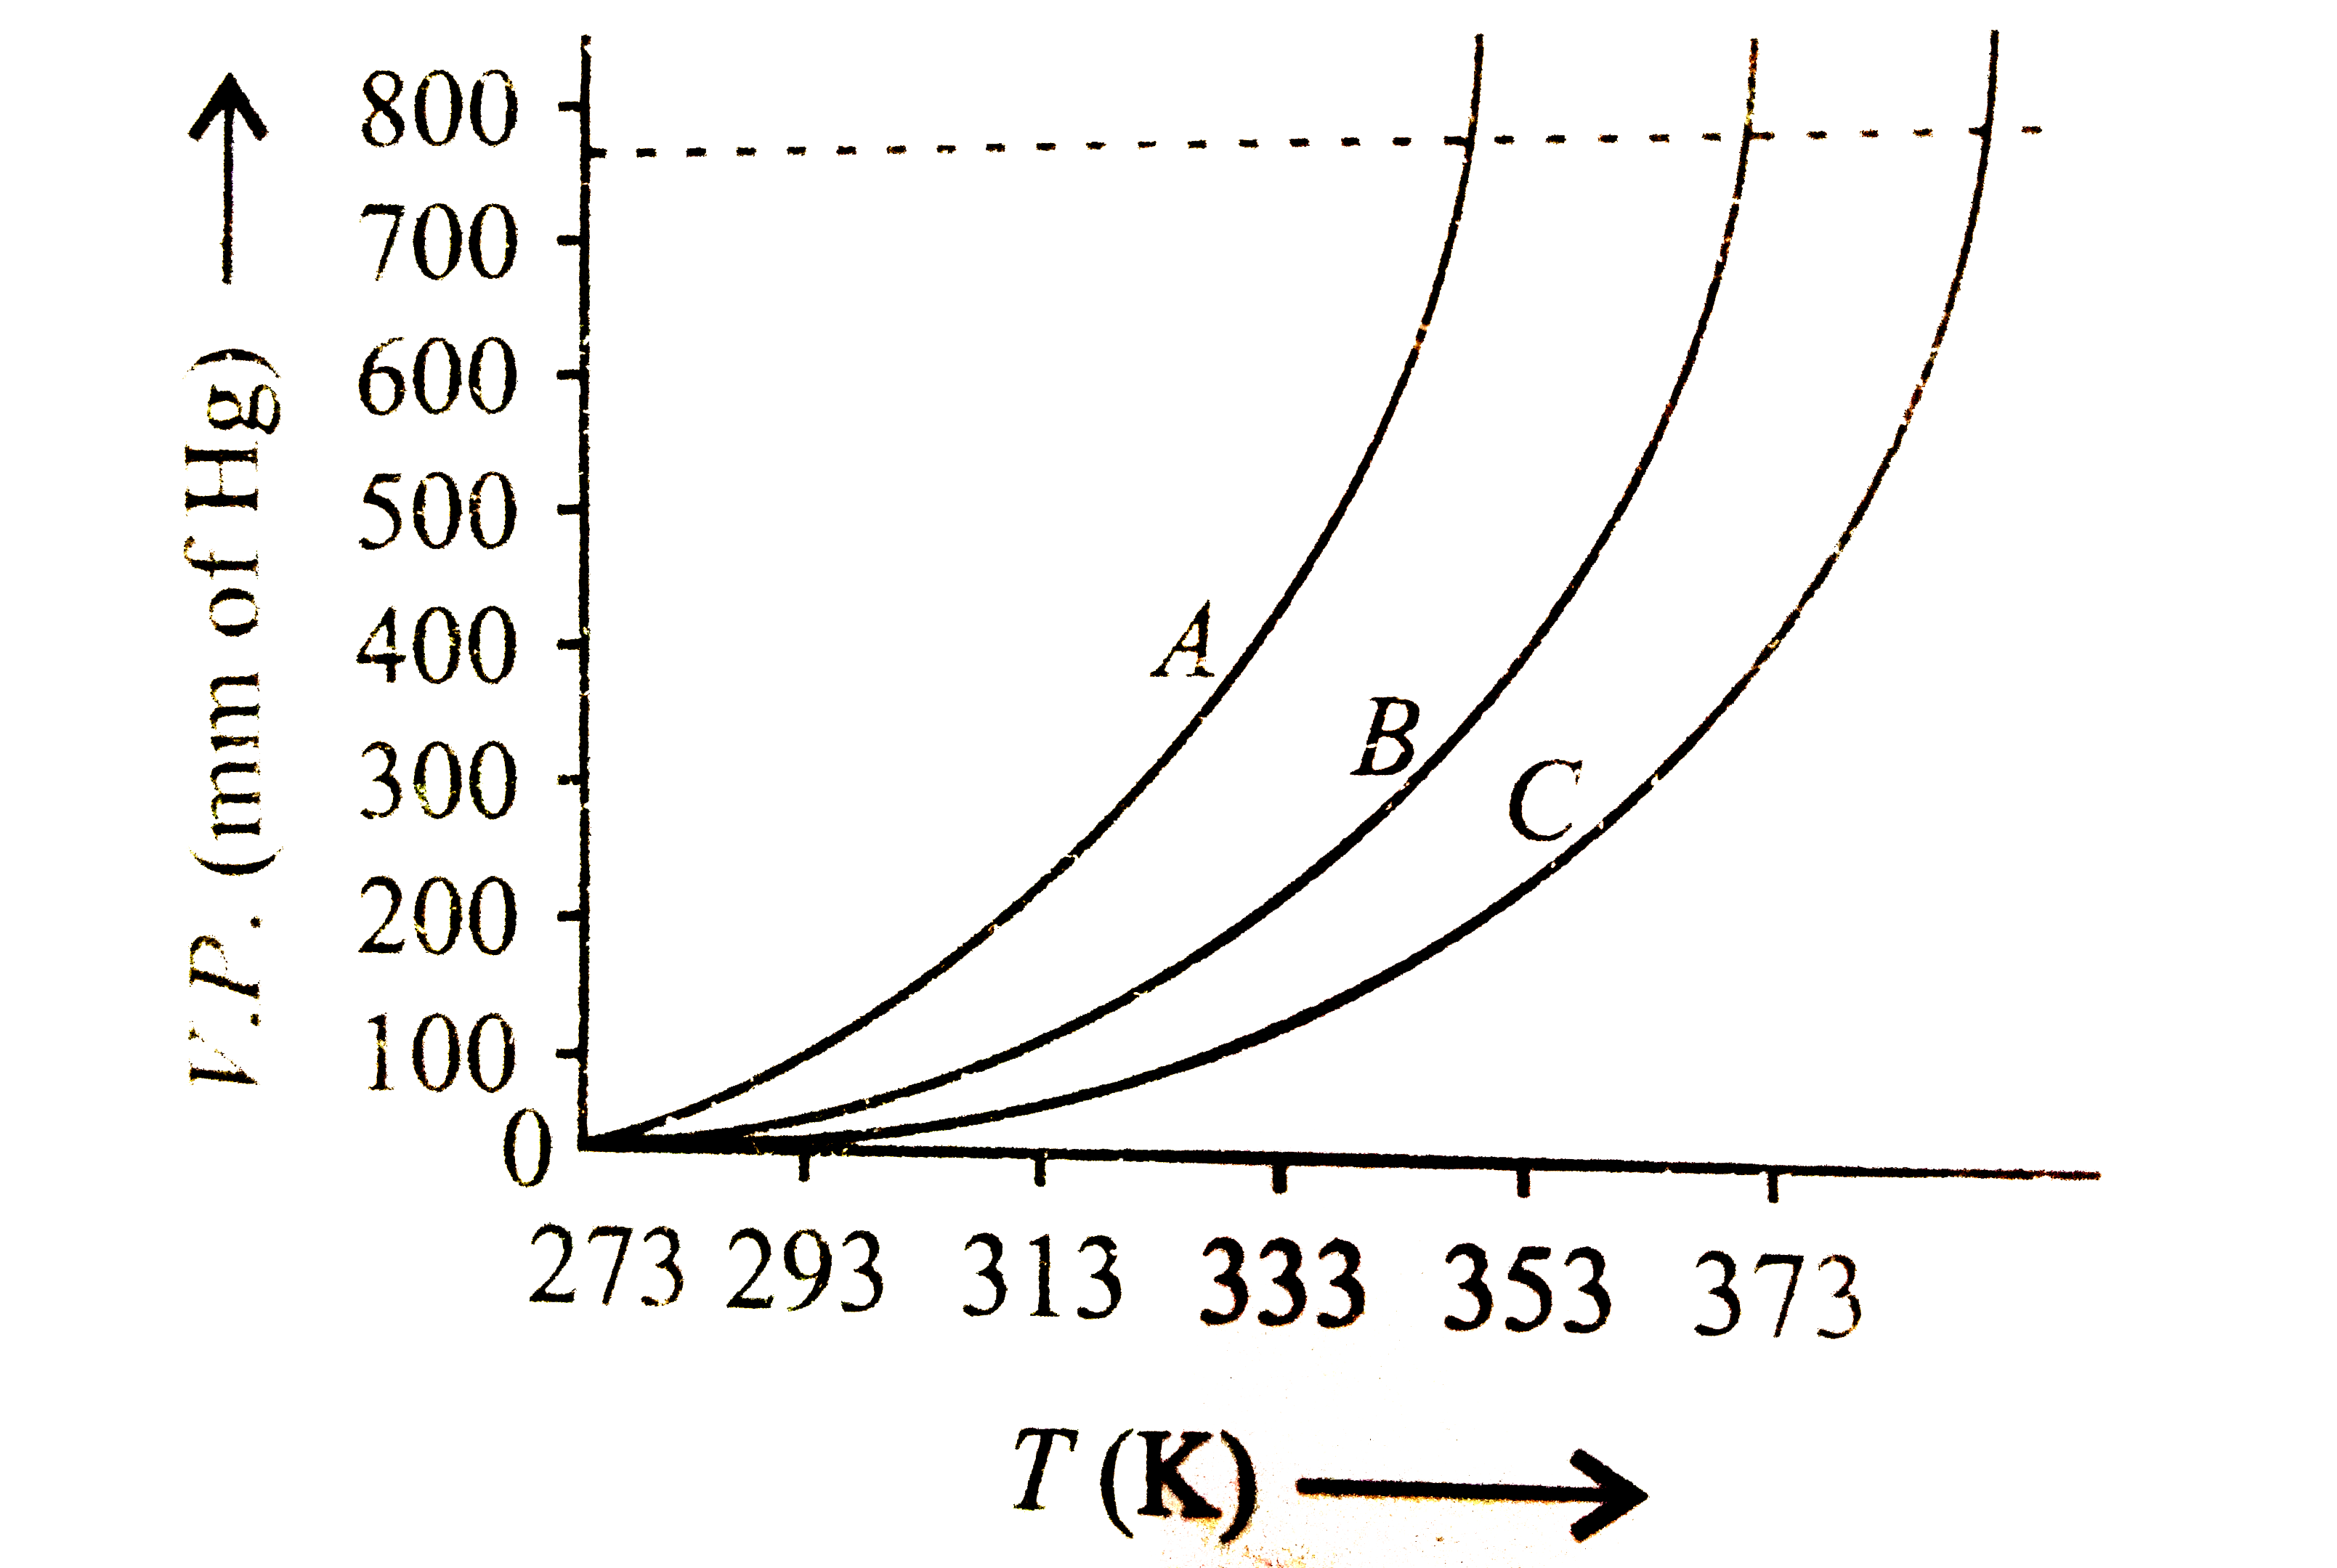
Which of the following statements is true ?
View SolutionRead the following graph and answer the following question
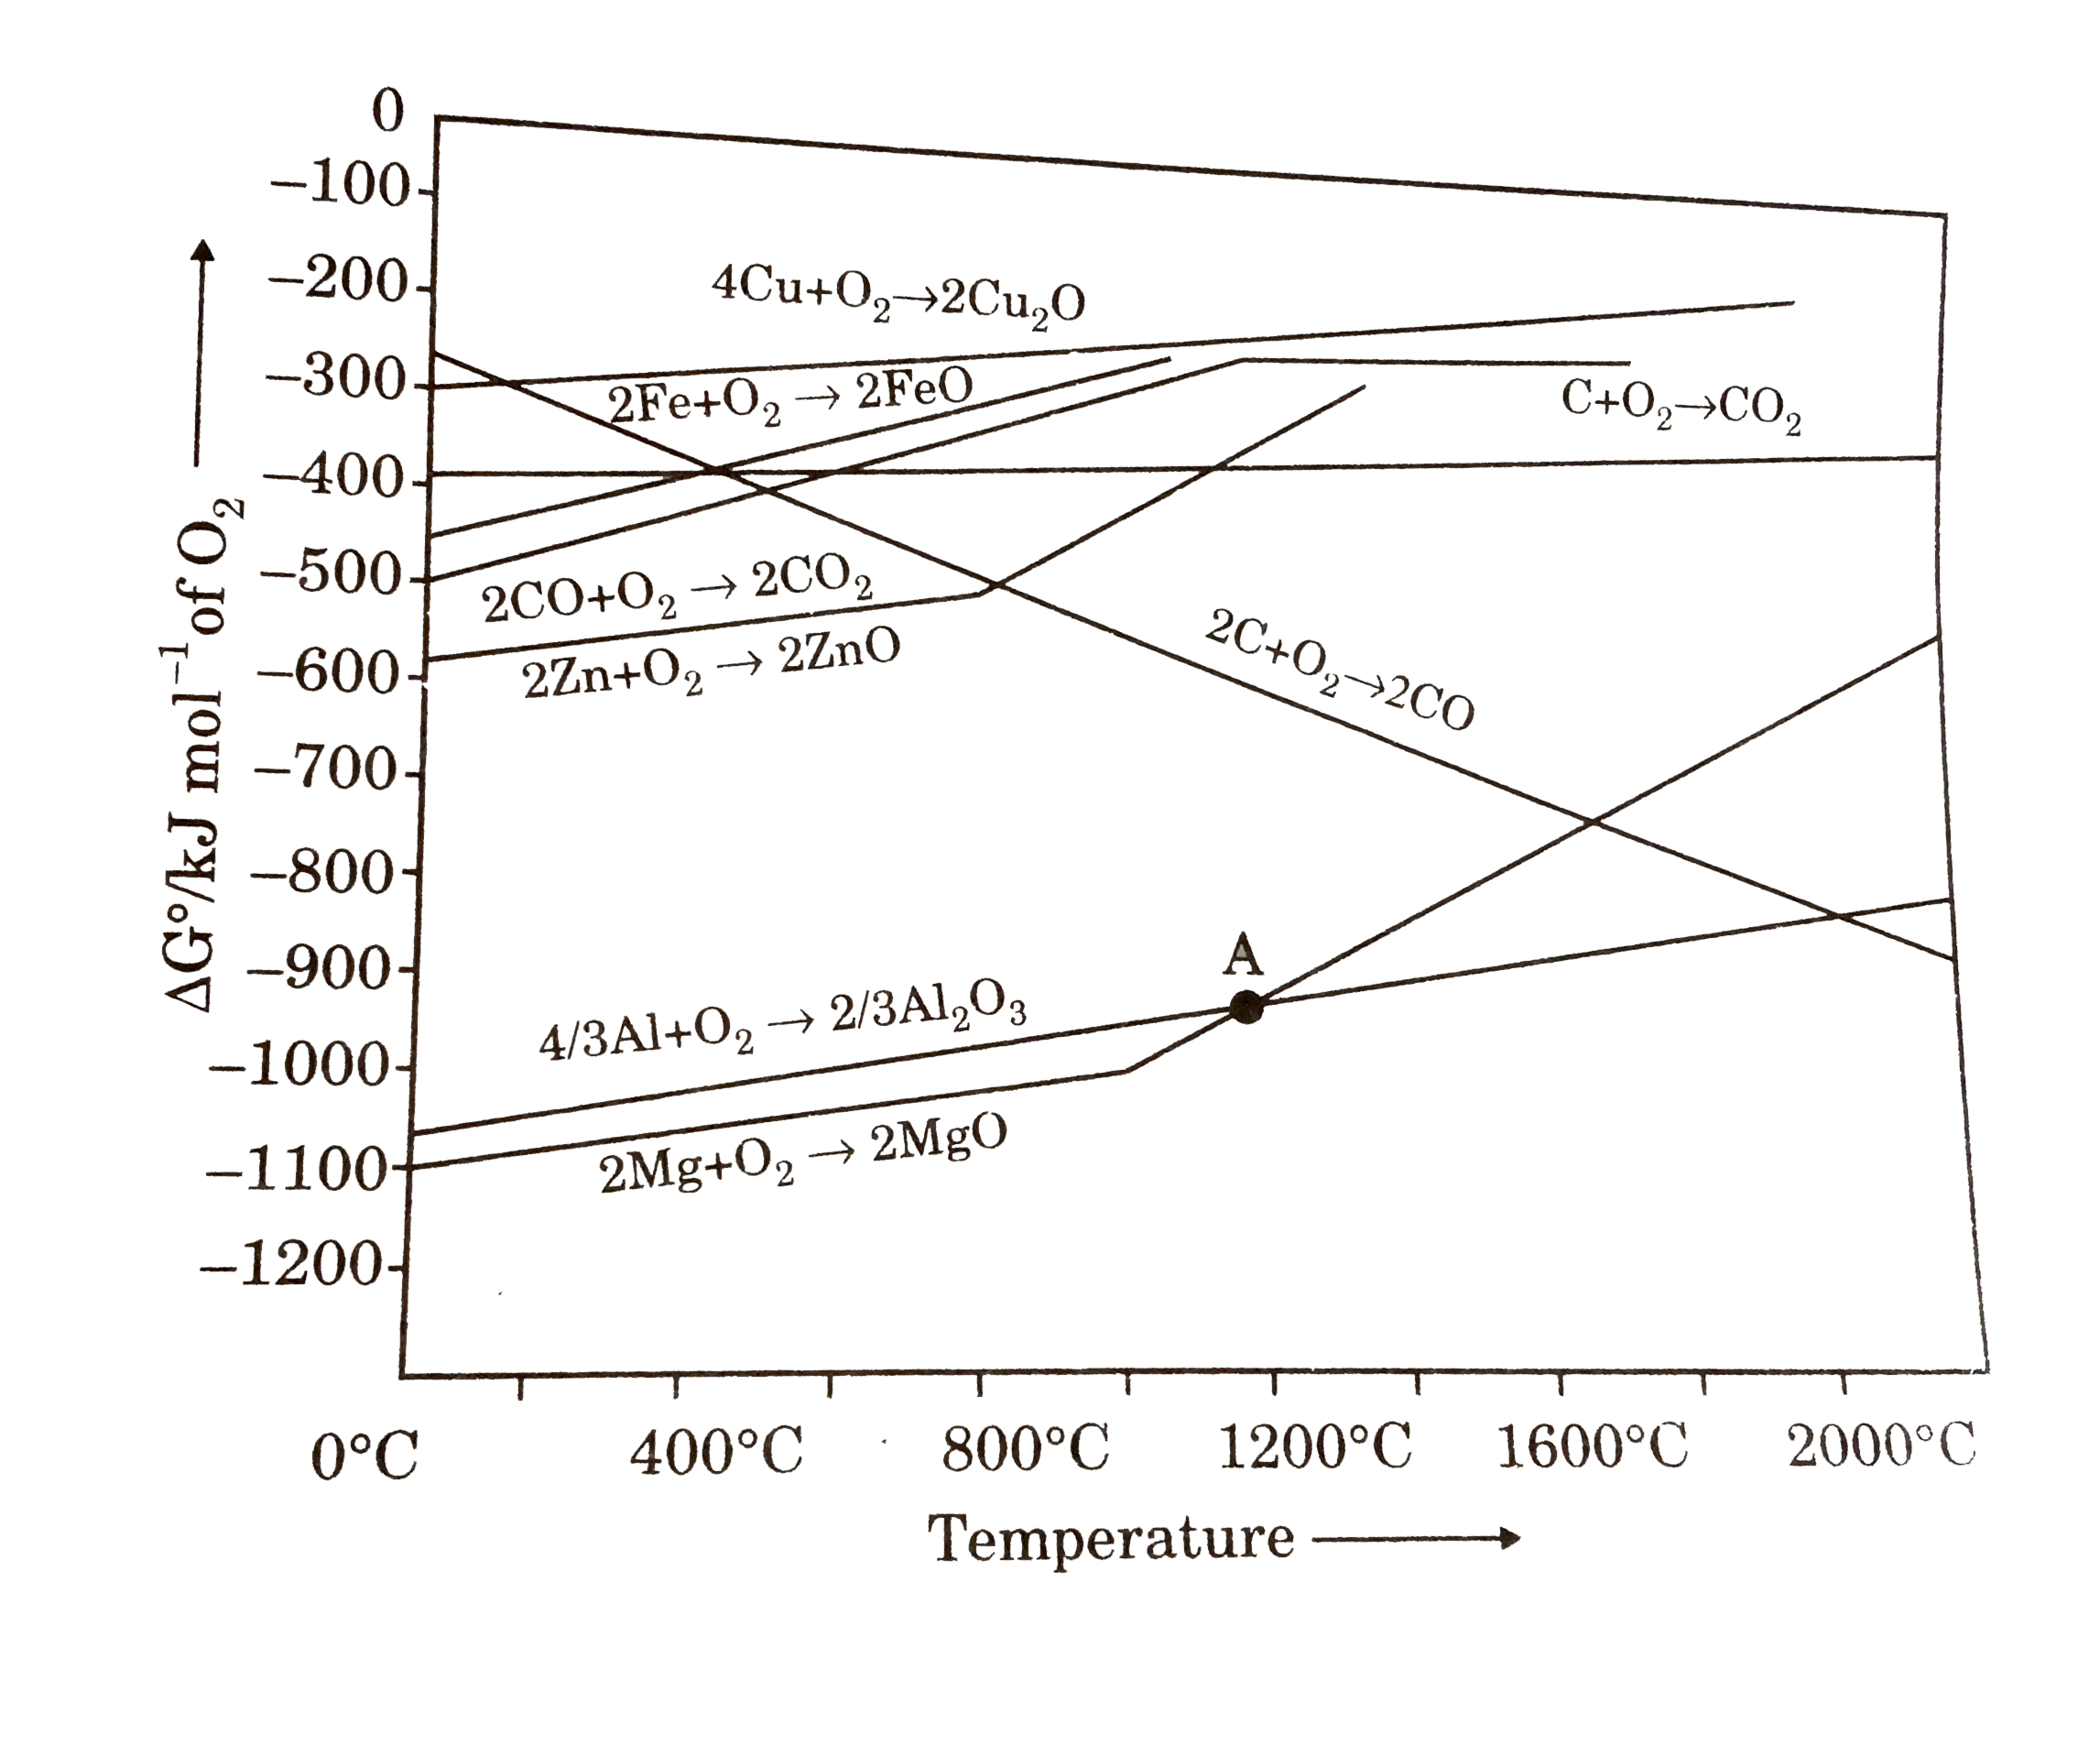
Which of the following statement is true?
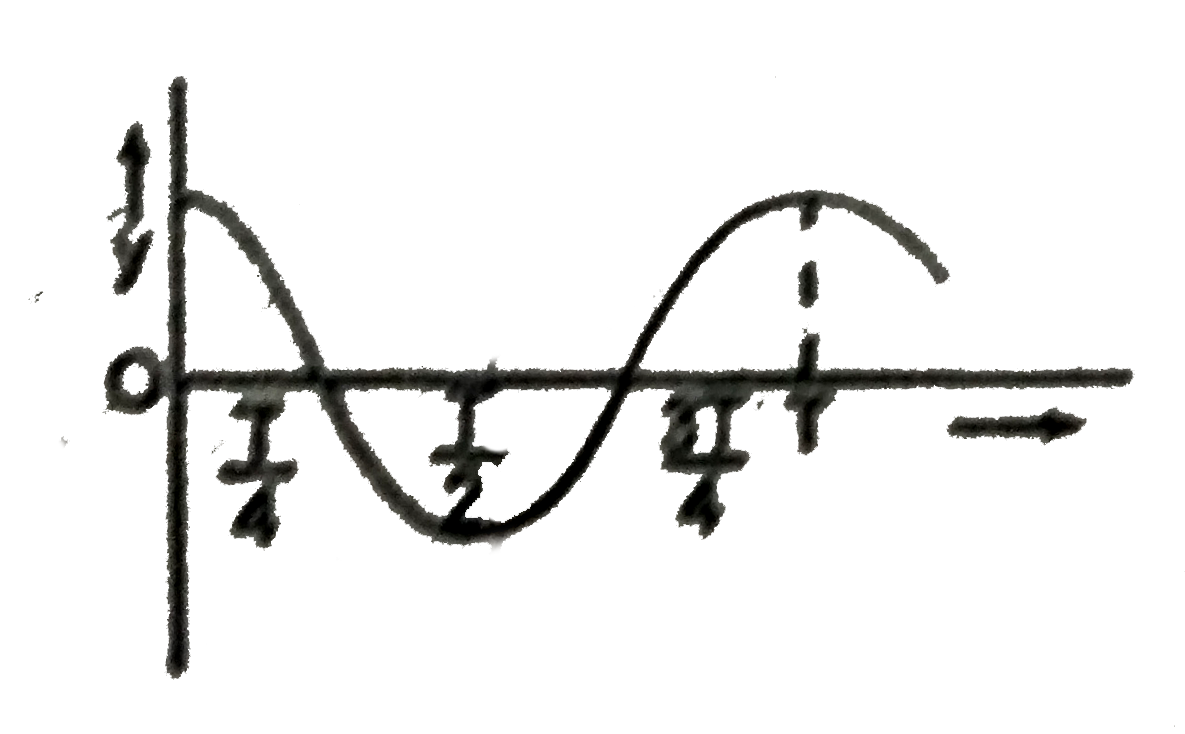
View SolutionThe displacement time graph of a particle executing S.H.M. (in straight line) is shown. Which of the following statements is true?
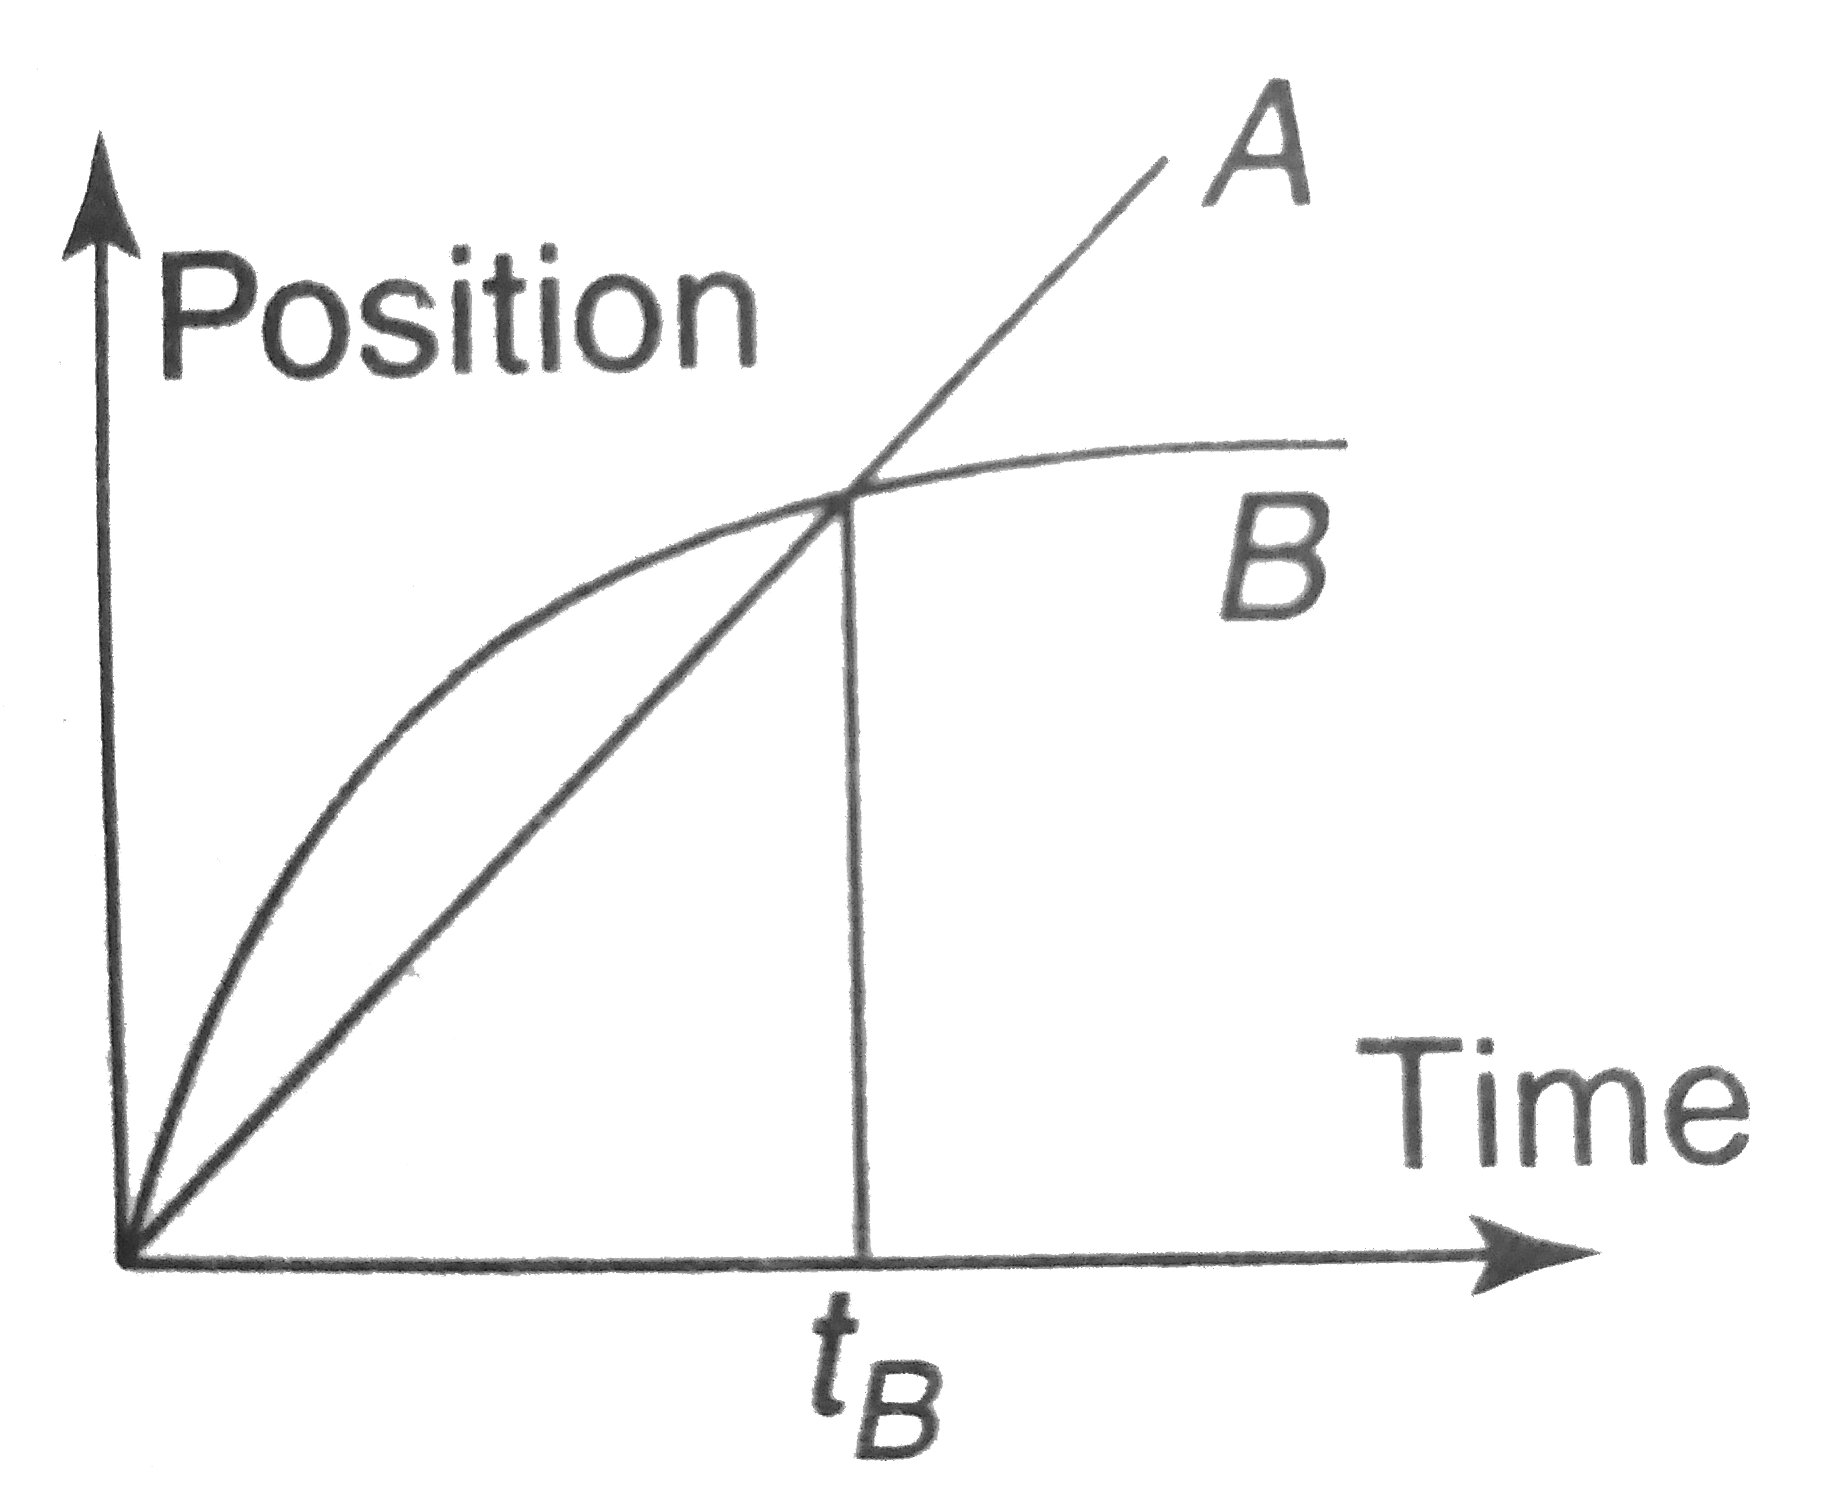
View SolutionThe graph shows position as a function of time for two trains running on parallel tracks. Which statement is true ?
View SolutionThe displacement time graph of a particle executing S.H.M. (in straight line) is shown. Which of the following statements is true?

View Solution
