A "best fit line" of the data presented in the graph would show that U.S comsuption of beef over time has
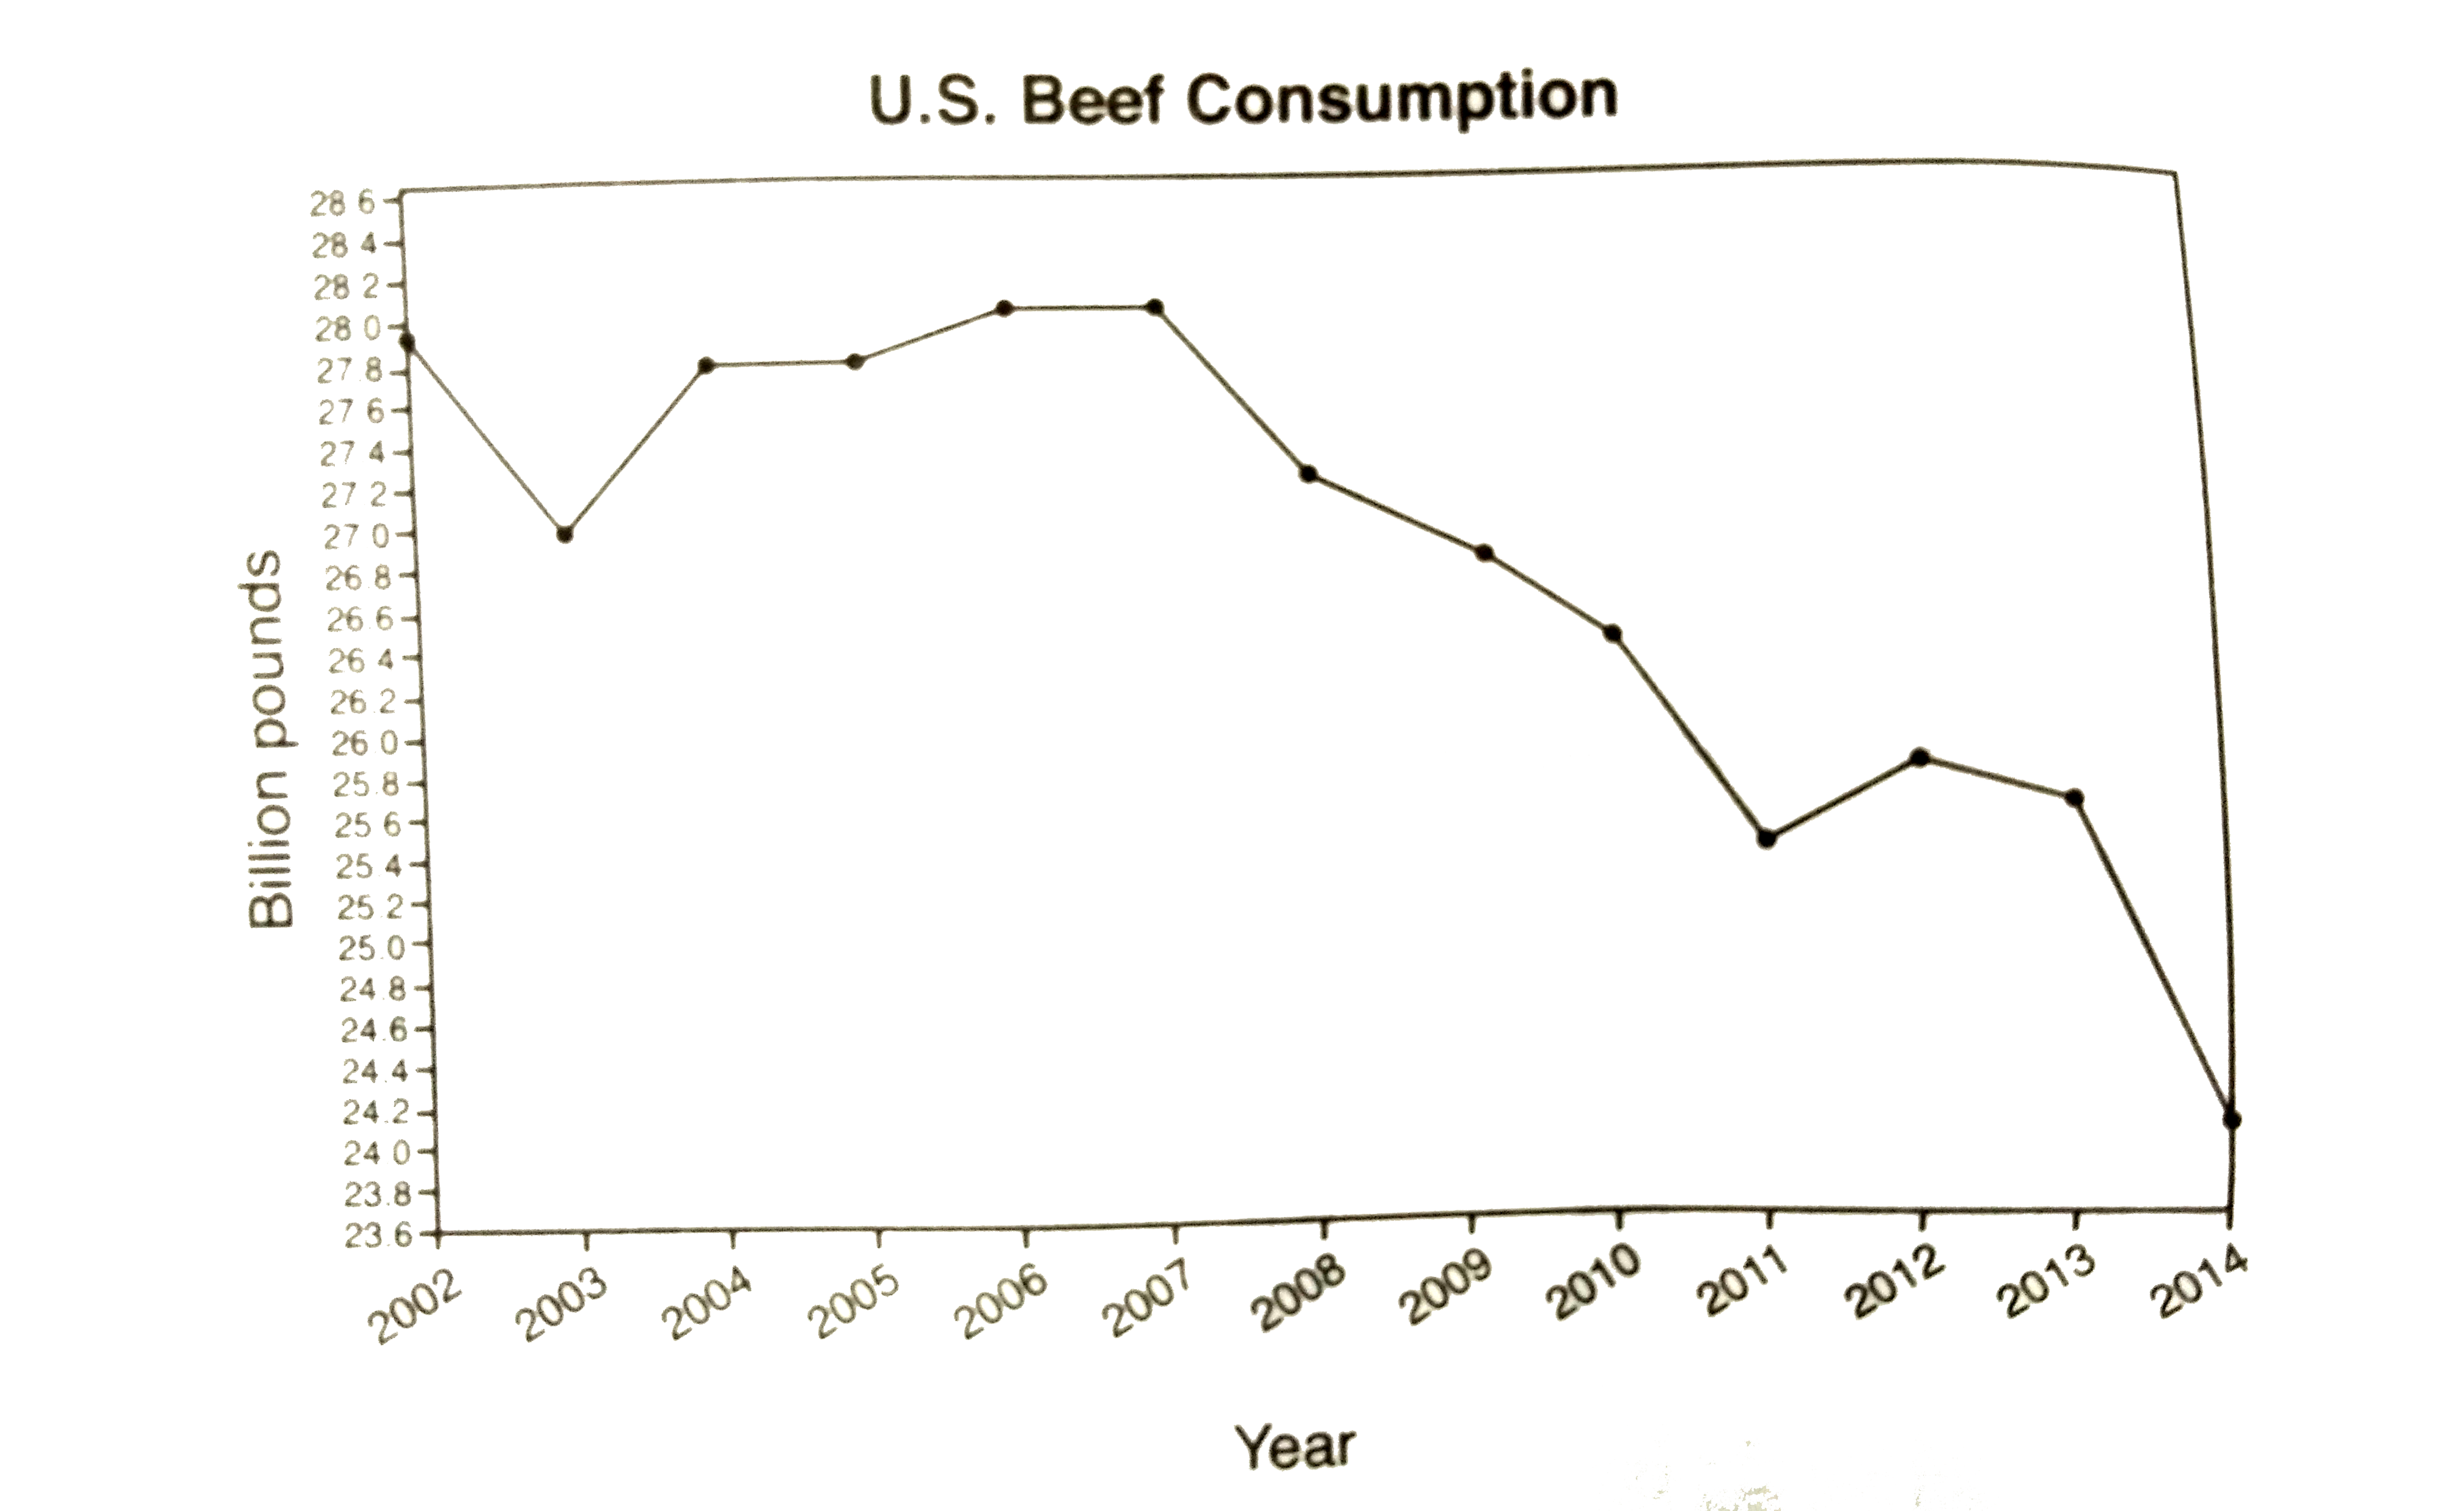
inceased
decreased
remain uncharged
peaked in 2007
The correct Answer is:D
(B) A line of best fit, or a trend line, is a straight line that best represents the data values given. Since this line would have the downward slope in the graph shown, (B) is the accurate answer.
Topper's Solved these Questions
Similar Questions
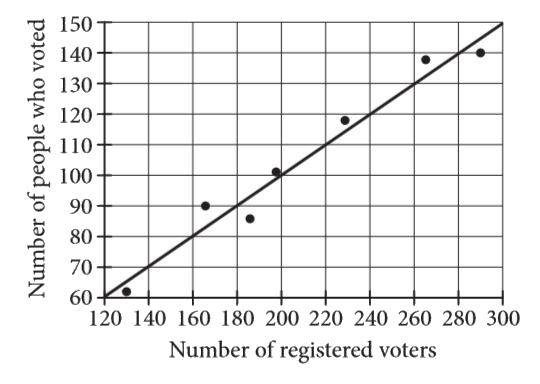
The scatterplot above shows the number of registered voters, x, and the number of people who voted in the last election, y, for seven districts in a town. A line of best fit for the data is also shown. Which of the following could be the equation of the line of best fit?
View Solution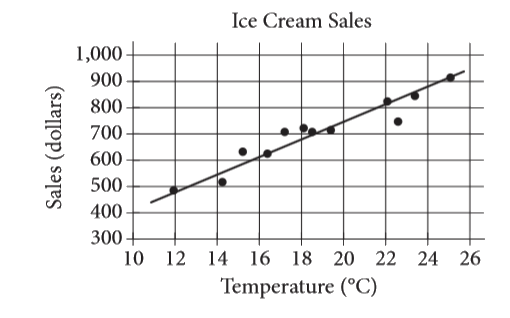
The scatterplot above shows a company’s ice cream sales d, in dollars, and the high temperature t, in degrees Celsius (.∘C), on 12 different days. A line of best fit for the data is also shown. Which of the following could be an equation of the line of best fit?
View Solution
Knowledge Check
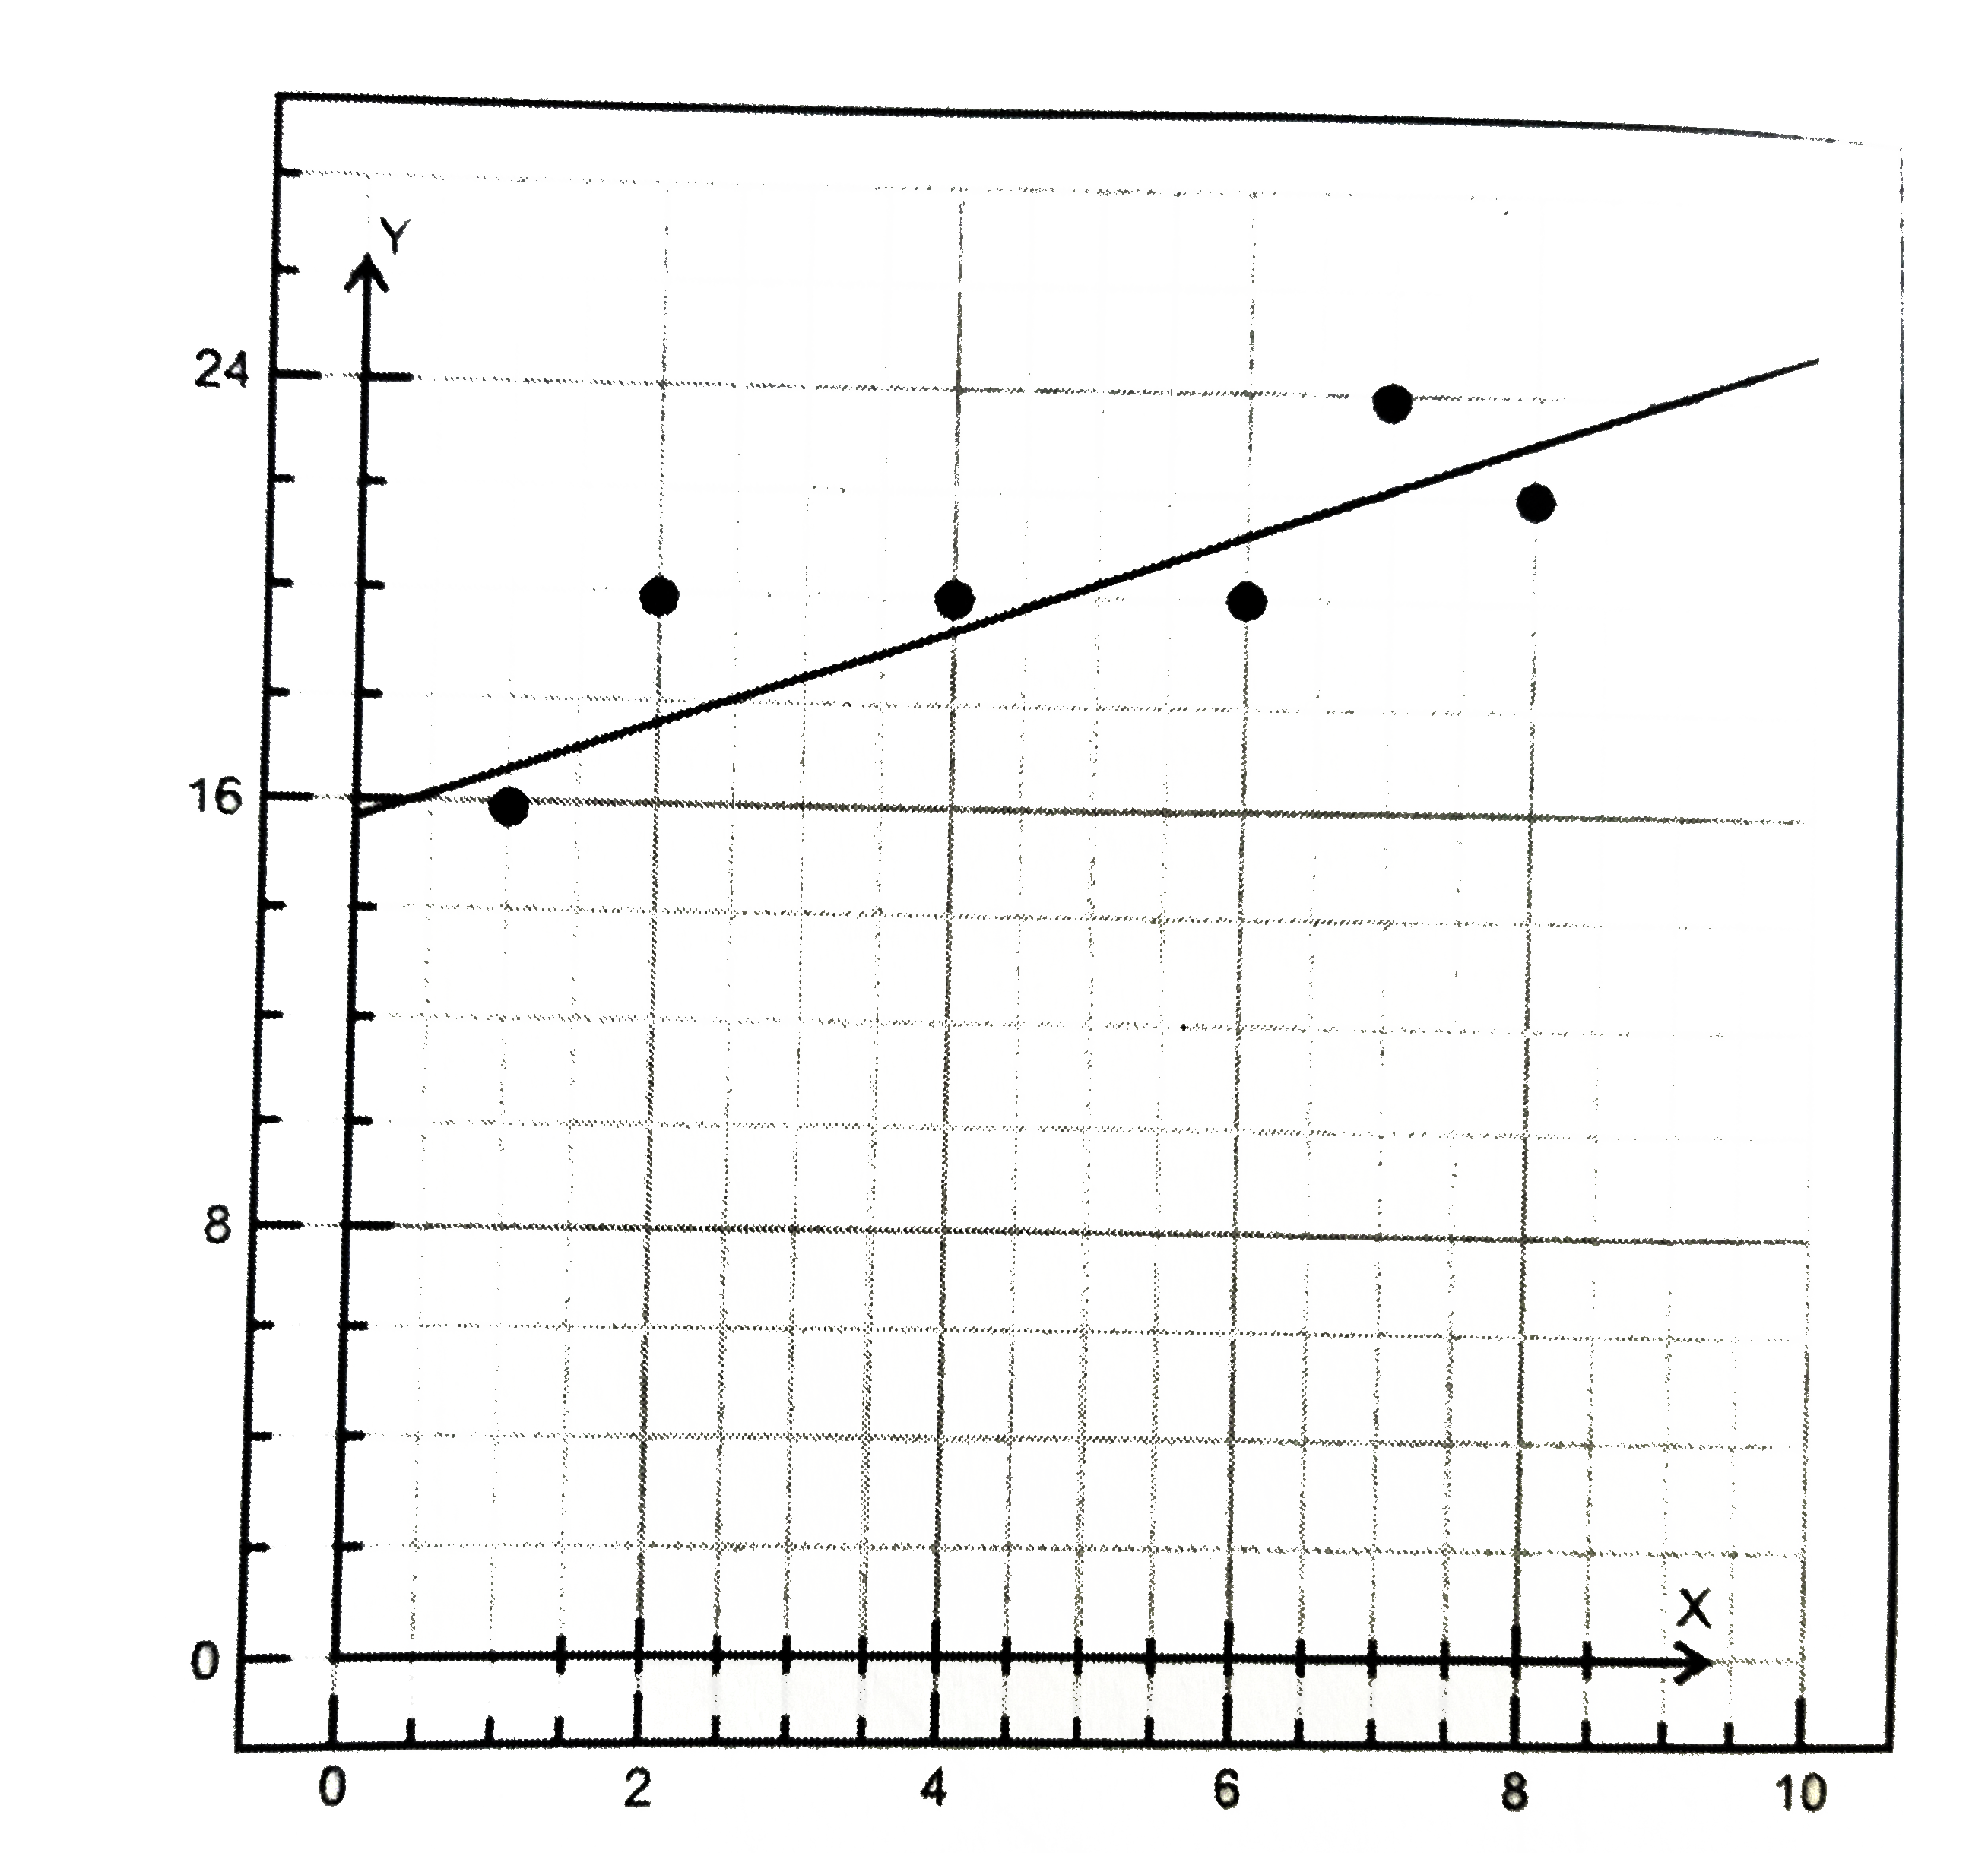
In a experiment a set of points denoted by the (x,y) coordinates are shown in the graph above along with the line of best fit. Which of the following is the best equation for the above line ?Ay = 0.7x - 3.7By = 0.9x + 15.8Cy =1.2x - 6.8Dy = 1.2x + 12.3Question Stimulus
…..is data that has been presented in a useful way.ANetworkBHardwareCProcessDInformationThe table below shows the percents of U.S. citizens who had ever consumed Bob's soda , out of all soda consumers , for each year form 1986 through 2006.
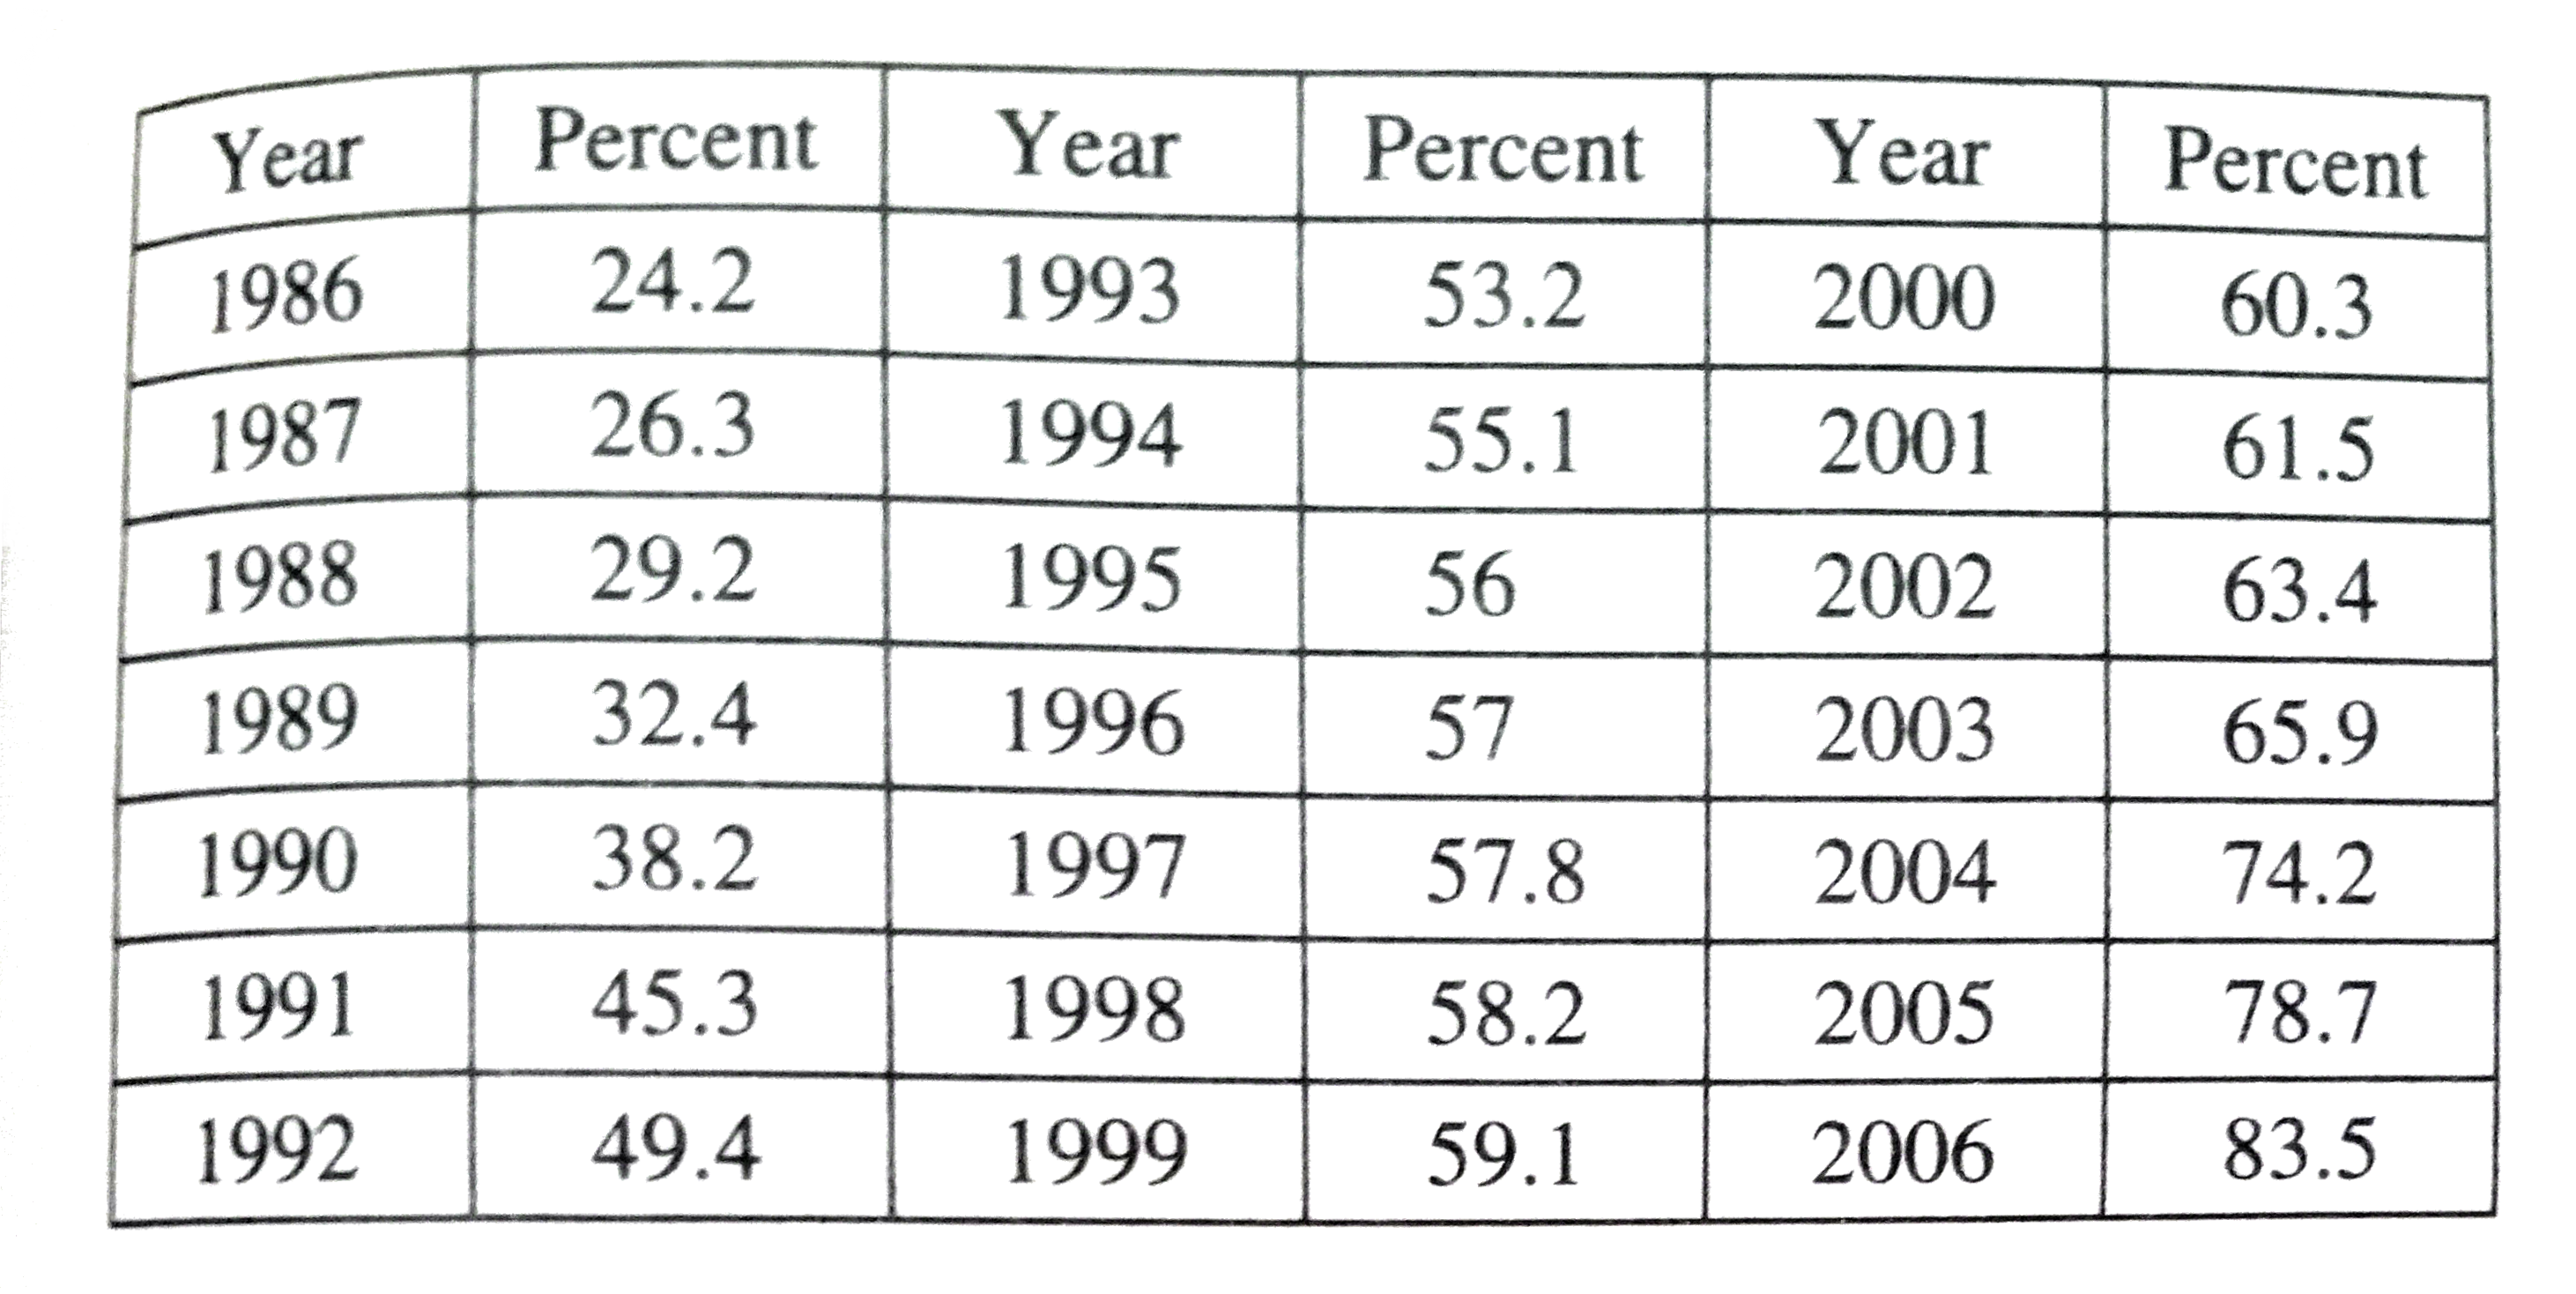
The figure below shows a scatterplot of the data in the table and solid lines that are possible modals for the data. Which of the 5 lines appears to be the best representation of the data ?
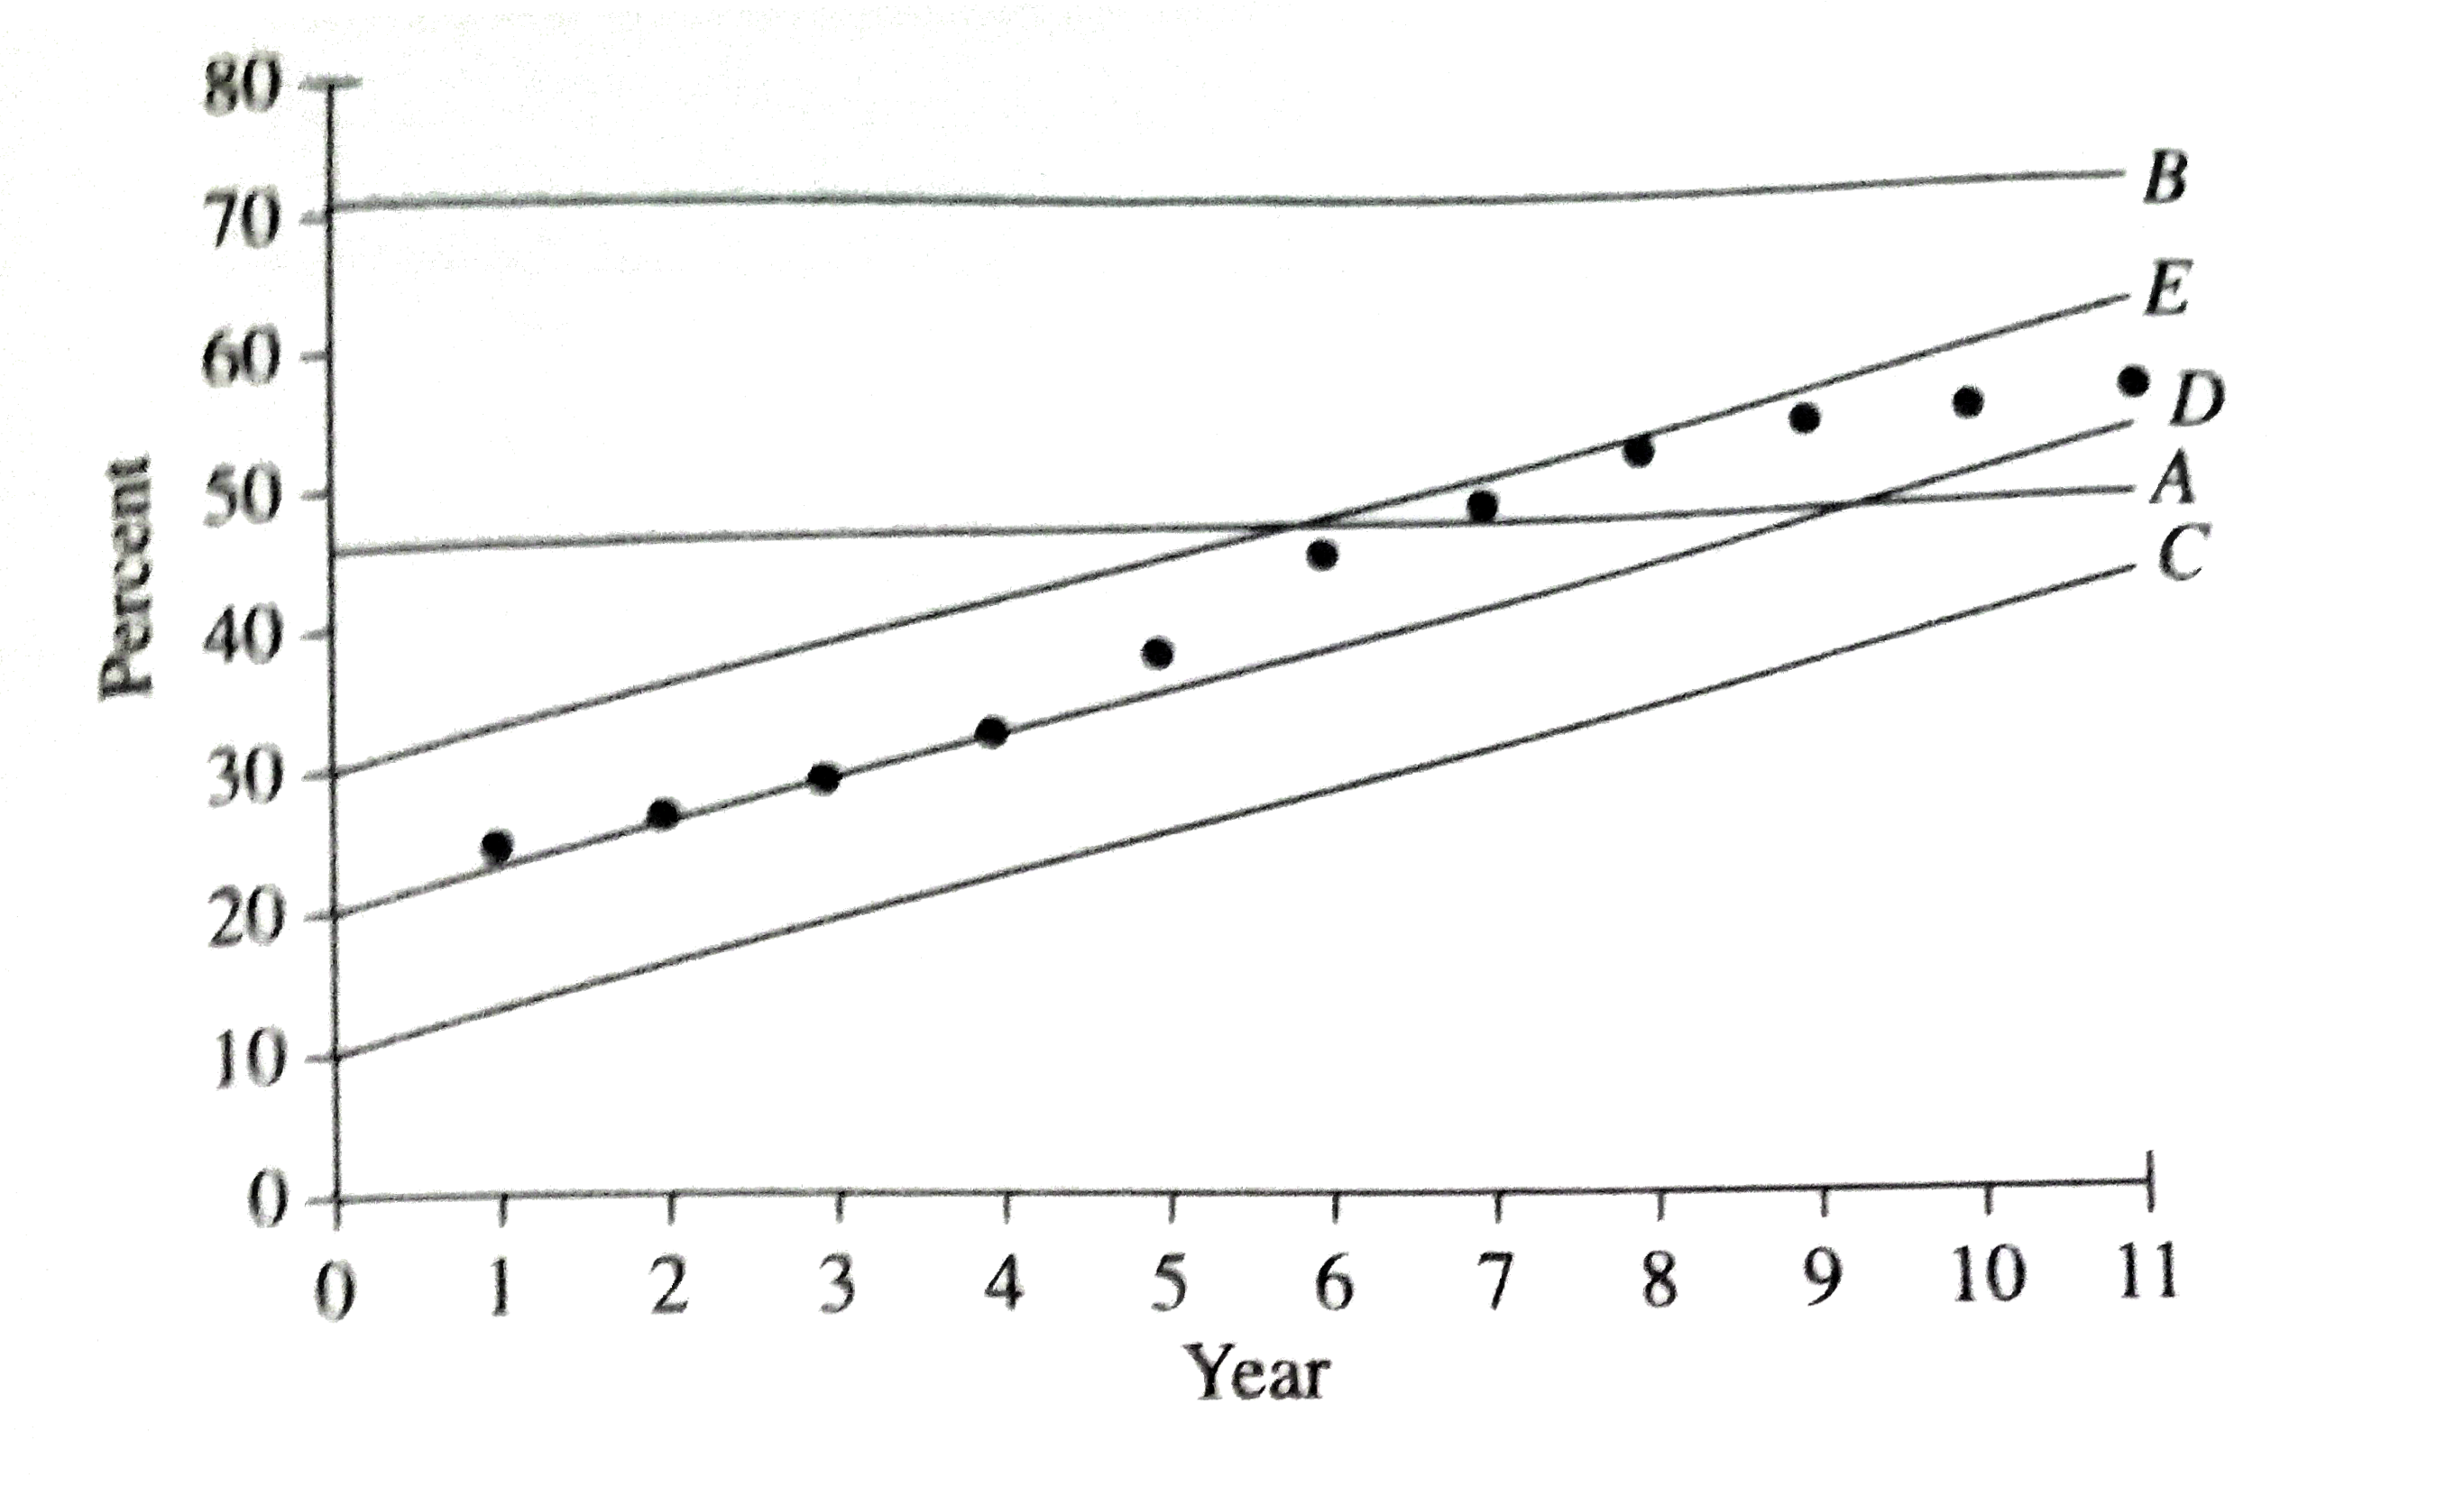 AABBCCDD
Between 1985 and 2003, data were collected every three years on the amount of plastic produced annually in the United States, in billions of pounds. The graph below shows the data and a line of best fit. The equation of the line of best fit is y = 3.39x + 46.89, where x is the number of years since 1985 and y is the amount of plastic produced annually, in billions of pounds.
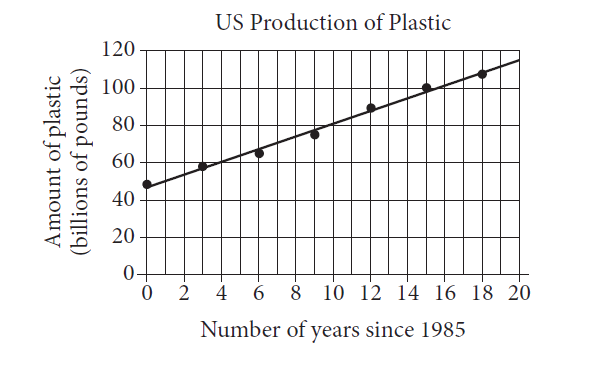
Which of the following is closest to the percent increase in the billions of pounds of plastic produced in the United States from 2000 to 2003?
View SolutionSea ice extent is a measurement of the area of ocean with at least 15% sea ice. The graph below shows data for the extent of Artic sea ice between 2000 and 2012 as reported by the National Snow and Ice Data Center. The line of best fit is also shown. The equations of the line is A(t)=−0.187t+380.5, where A(t) represents the area of measurement sea ice in the Artic Ocean in the year t.
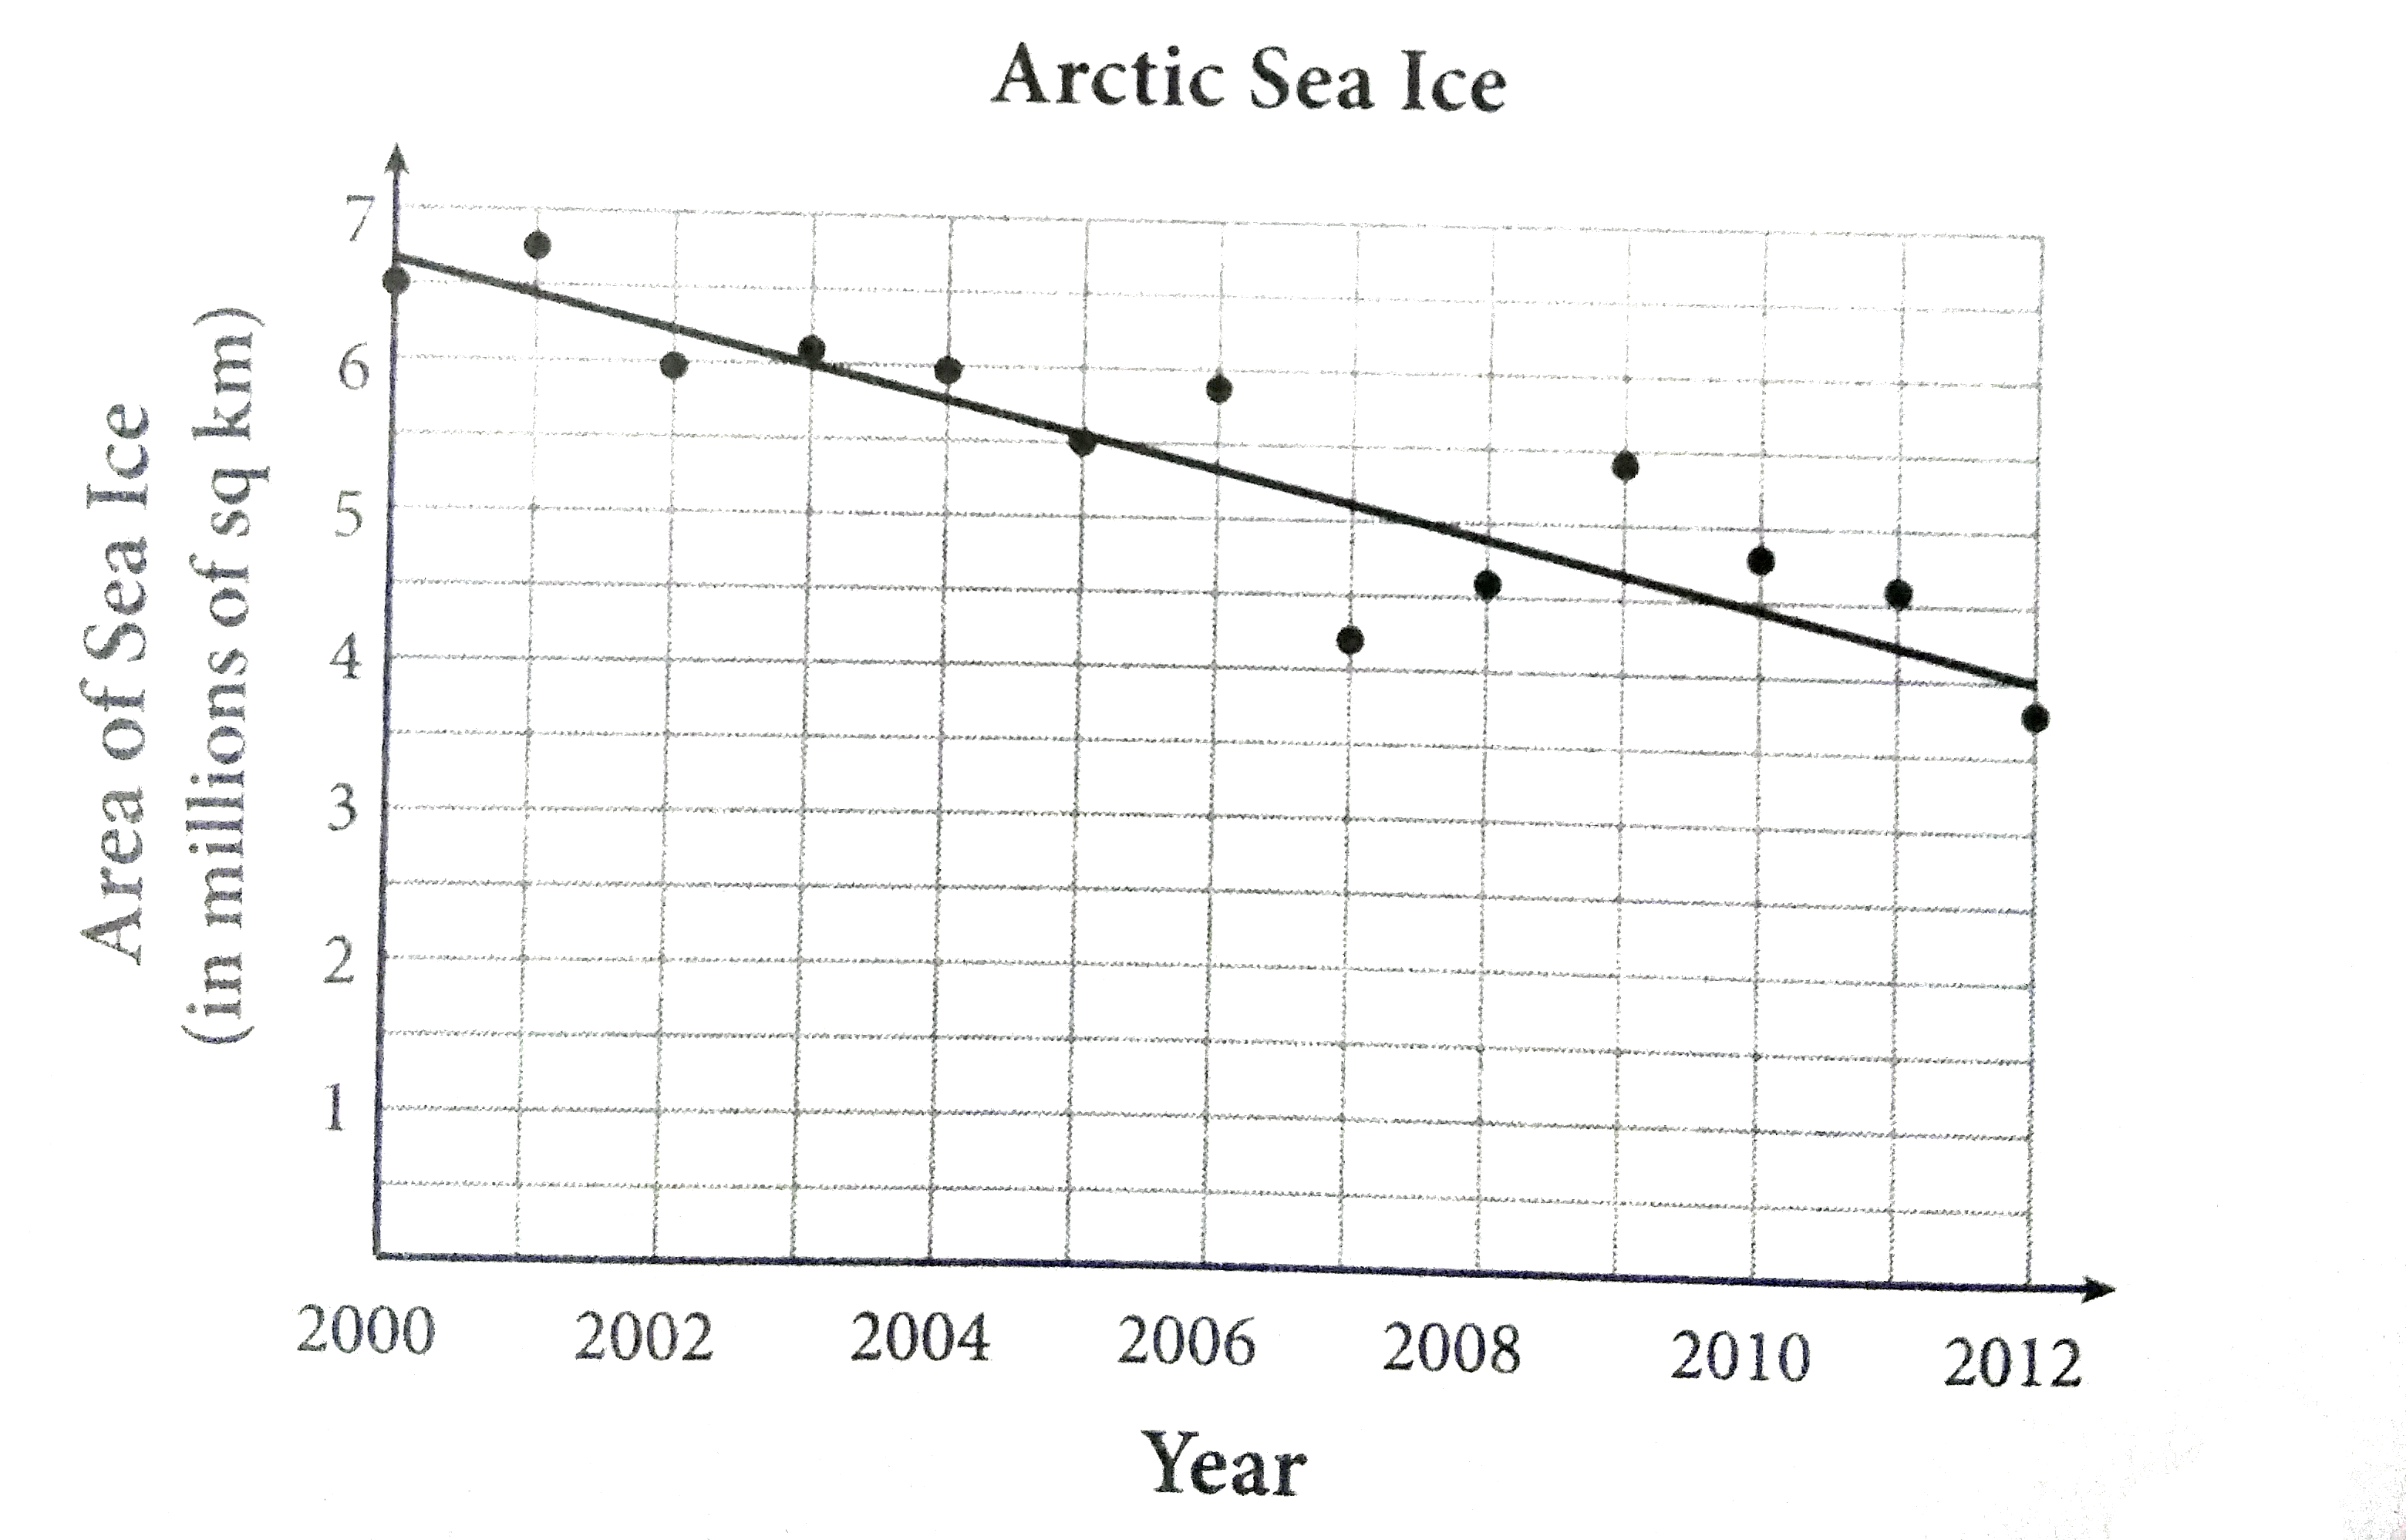
Q. Based on the equation of the line of best fit, which of the following statements accurately of measurable Arctic sea ice during the given times period?
View Solution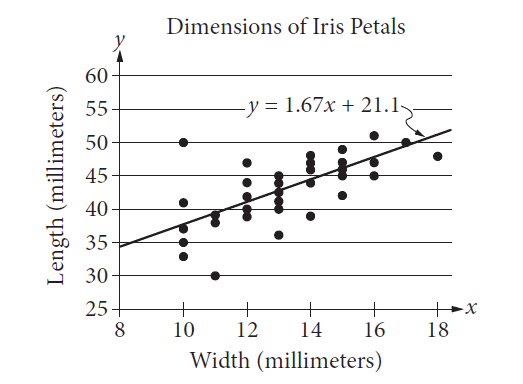
The scatterplot above shows data collected on the lengths and widths of Iris setosa petals. A line of best fit for the data is also shown. Based on the line of best fit, if the width of an Iris setosa petal is 19 millimeters, what is the predicted length, in millimeters, of the petal?
View SolutionThe use of calculator is not permited.
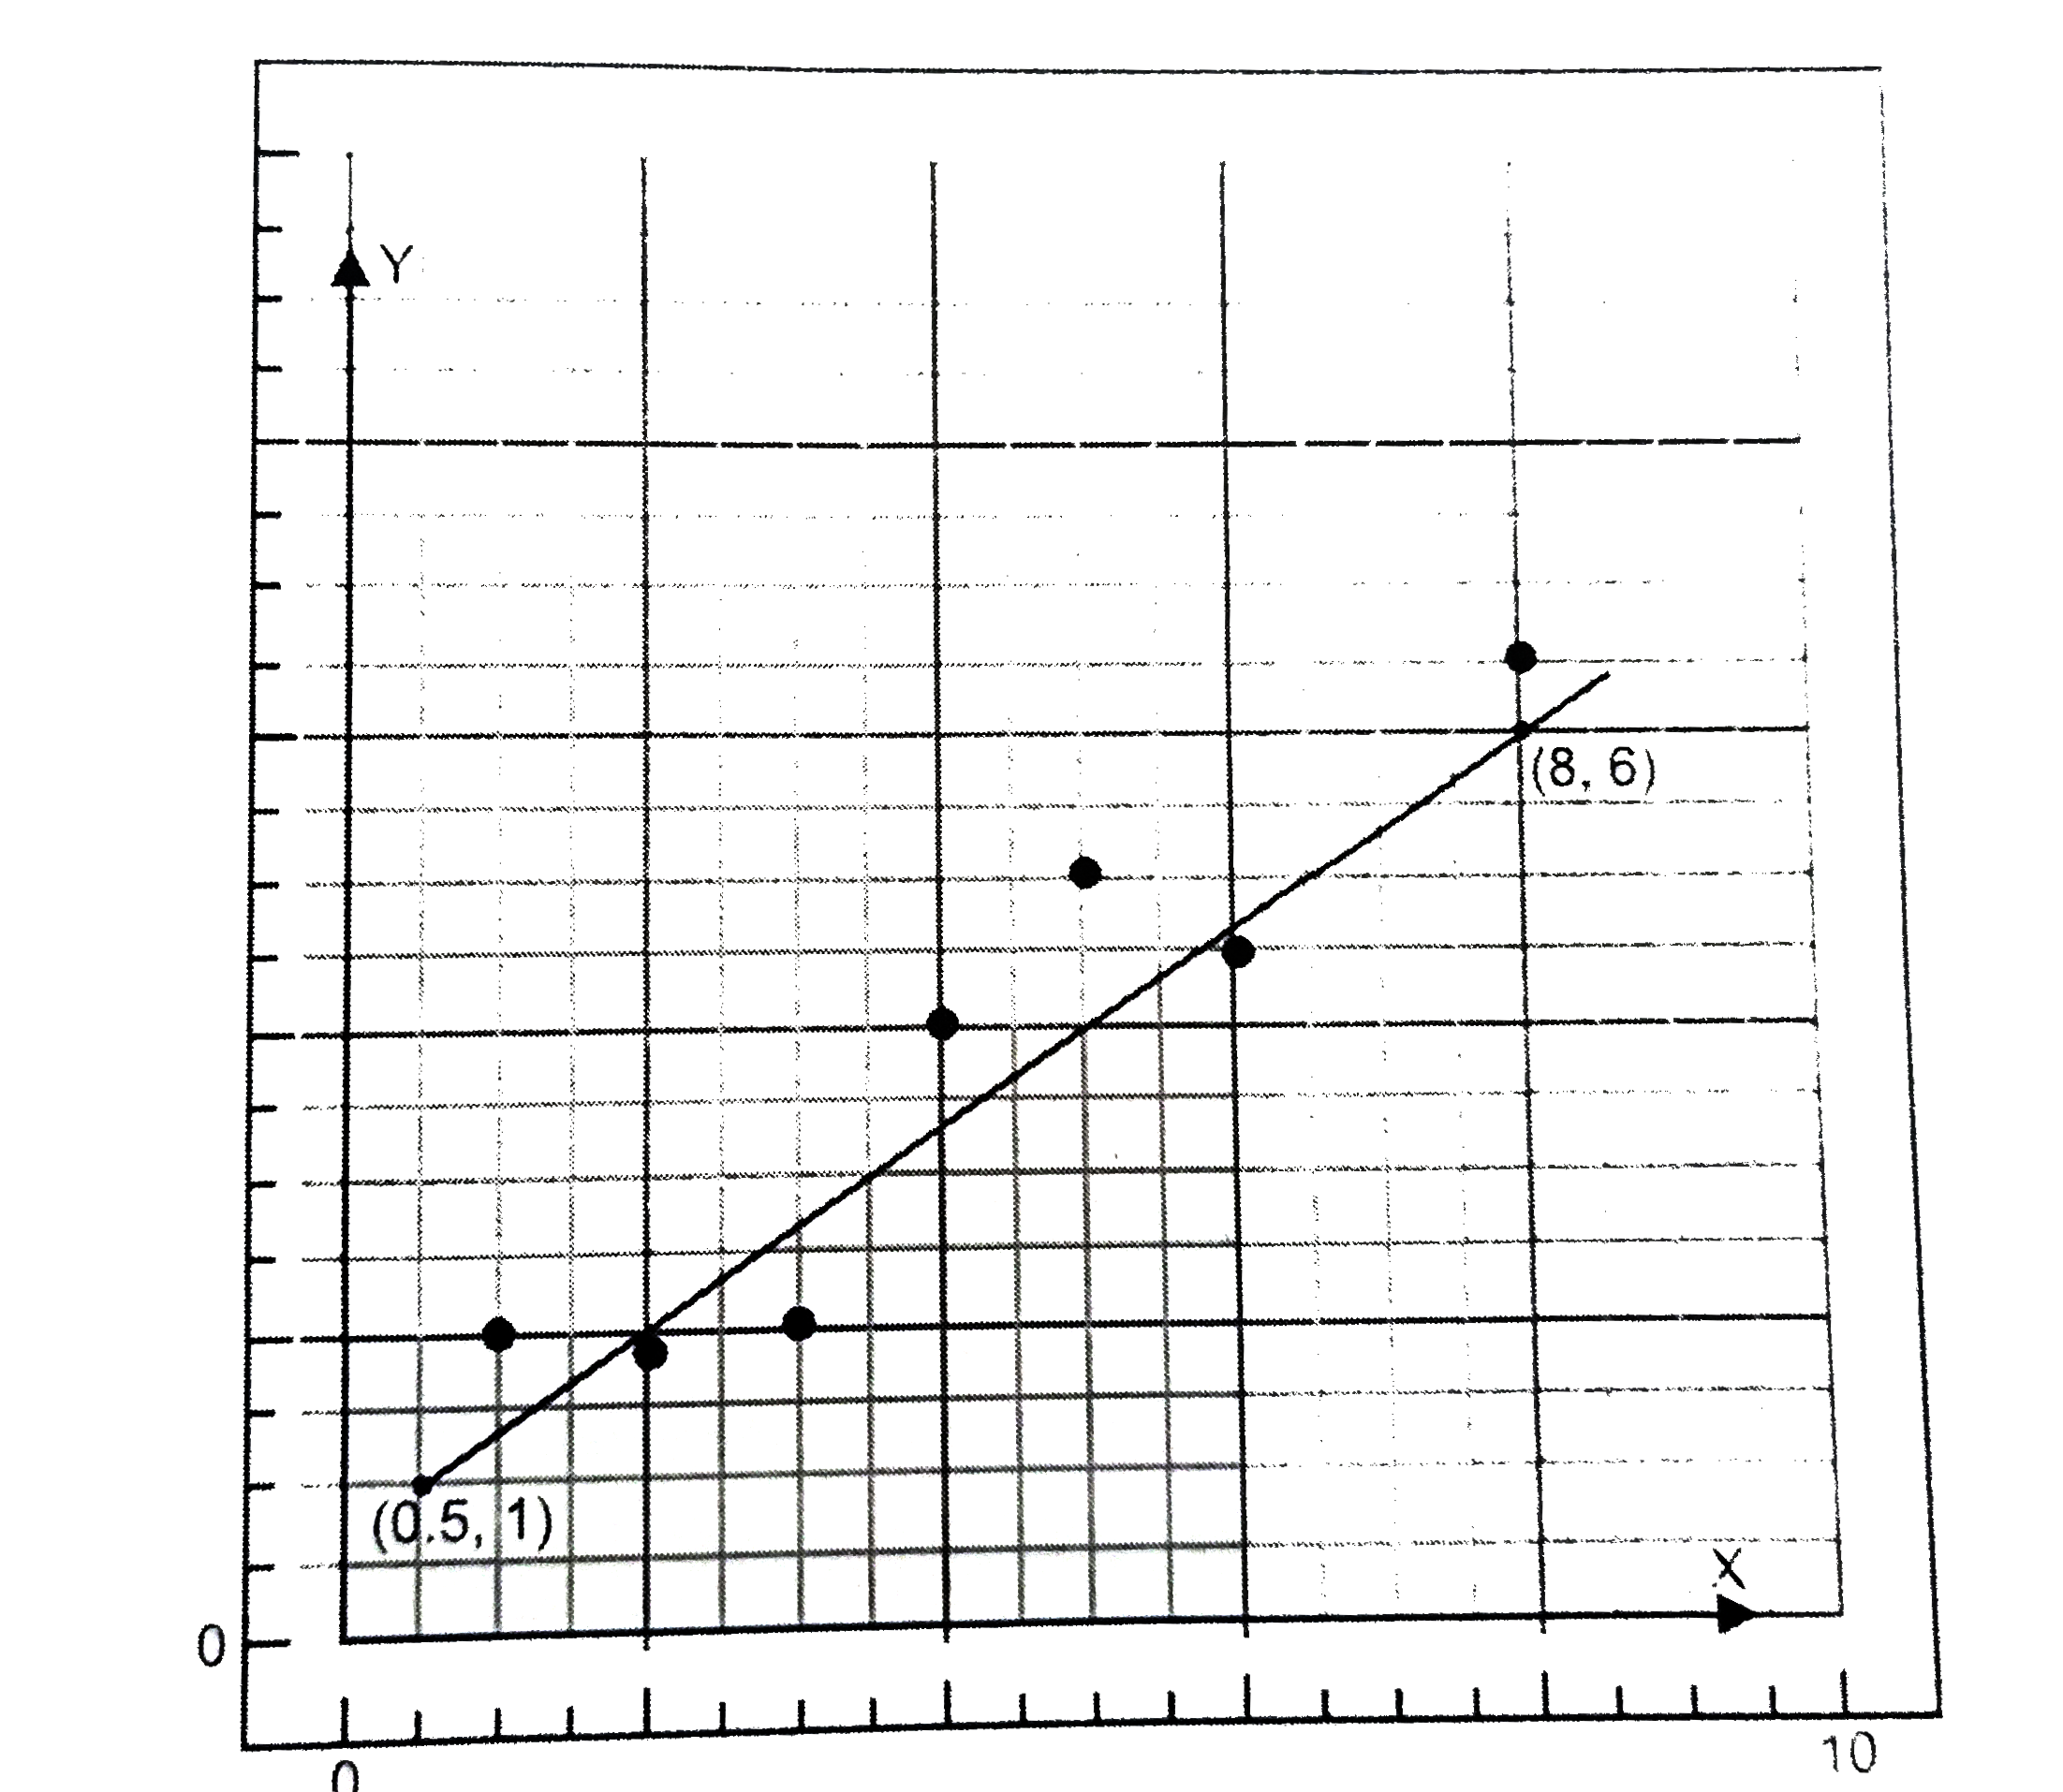
In the graph above ,a number of points are shown, and the line of best fit is also shown. What is the sum of the expected values of the Y coordinates of the points having X values 7 and 9?
View SolutionUse the method of least squares to fit a trend line to the data in Problem 6 below. Also, obtain the trend value for the year 1975.
View Solution
