Which of the following volume-temperature (V−I) plots represents the behaviour of 1mole of an ideal gas at the atmospheric pressure?
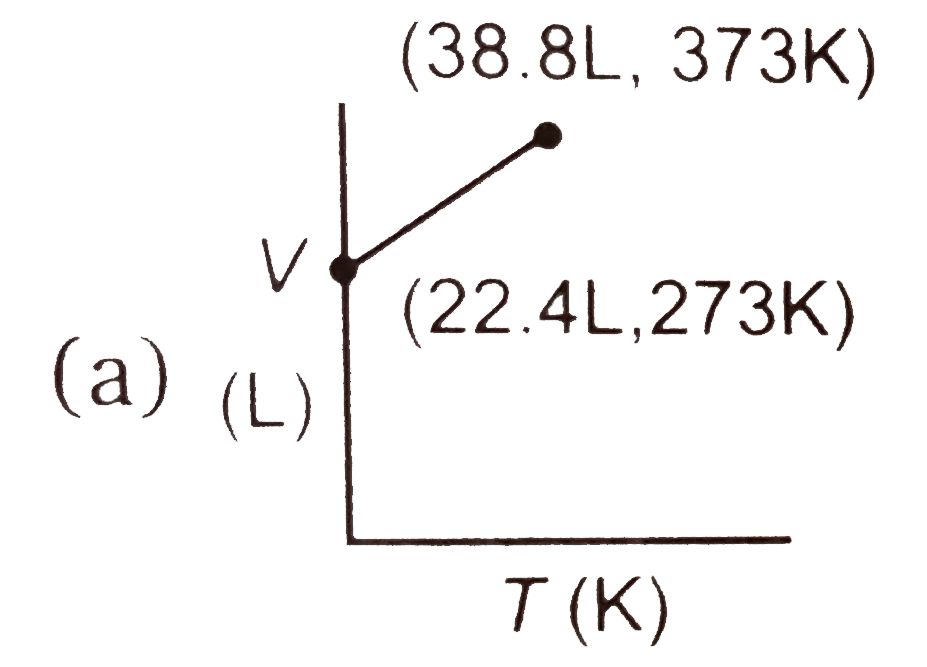
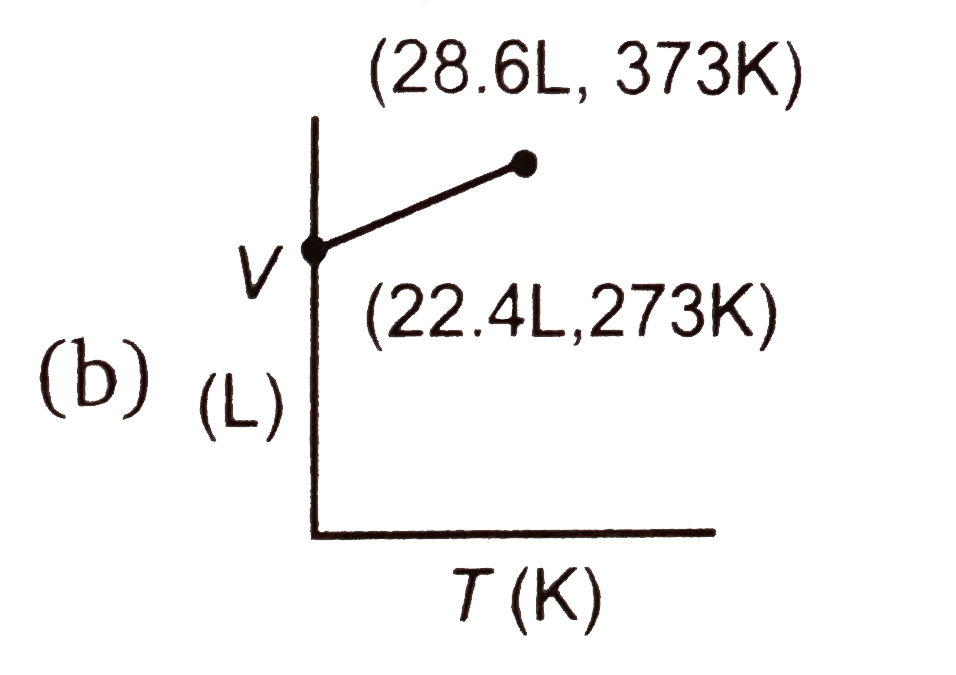
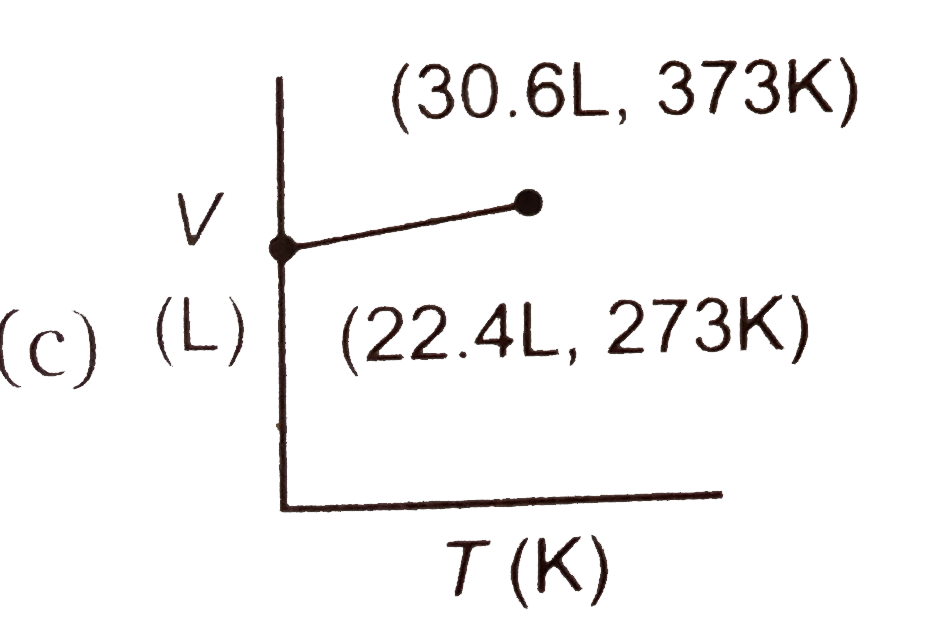
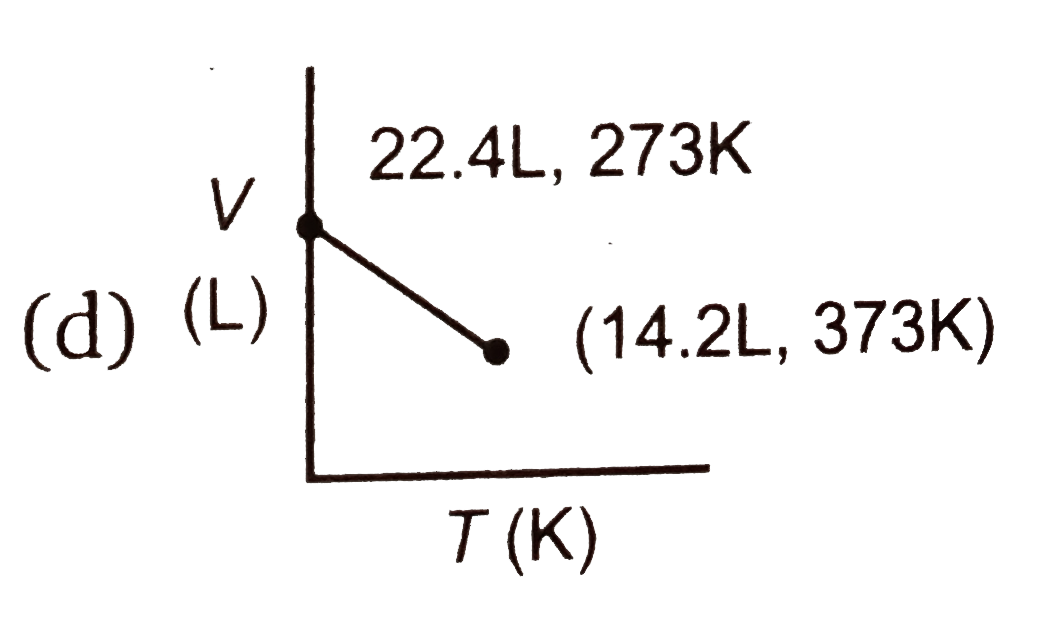
Use V1T1=V2T2 .
Topper's Solved these Questions
- GASEOUS STATEBook:P BAHADURChapter:GASEOUS STATEExercise:Exercise B
Explore 1 Video
- GASEOUS STATEBook:P BAHADURChapter:GASEOUS STATEExercise:Exercise 4
Explore 1 Video
- GASEOUS STATEBook:P BAHADURChapter:GASEOUS STATEExercise:Exercise 3
Explore 1 Video
- CHEMICAL EQUILIBRIUMBook:P BAHADURChapter:CHEMICAL EQUILIBRIUMExercise:Exercise
Explore 134 Videos
- IONIC EQUILIBRIUMBook:P BAHADURChapter:IONIC EQUILIBRIUMExercise:Exercise
Explore 85 Videos
Similar Questions
Which of the following volume (V) - temperature (T) plots represents the behaviour of one mole of an ideal gas at one atmospheric pressure?
View SolutionWhich of the following volume (V)-temperature (T) plots represents the behaviour of one mole of an ideal gas at one atmoshperic pressure?
View Solution
Knowledge Check
Which of the following volume (V) - temperature (T) plots represents the behaviour of one mole of an ideal gas at one atmospheric pressure?
A B
B C
C D
D
Which one of the following volume (V)- temperature (T) plots represents the behaviour of one mole of an ideal gas at one atmosphere?
A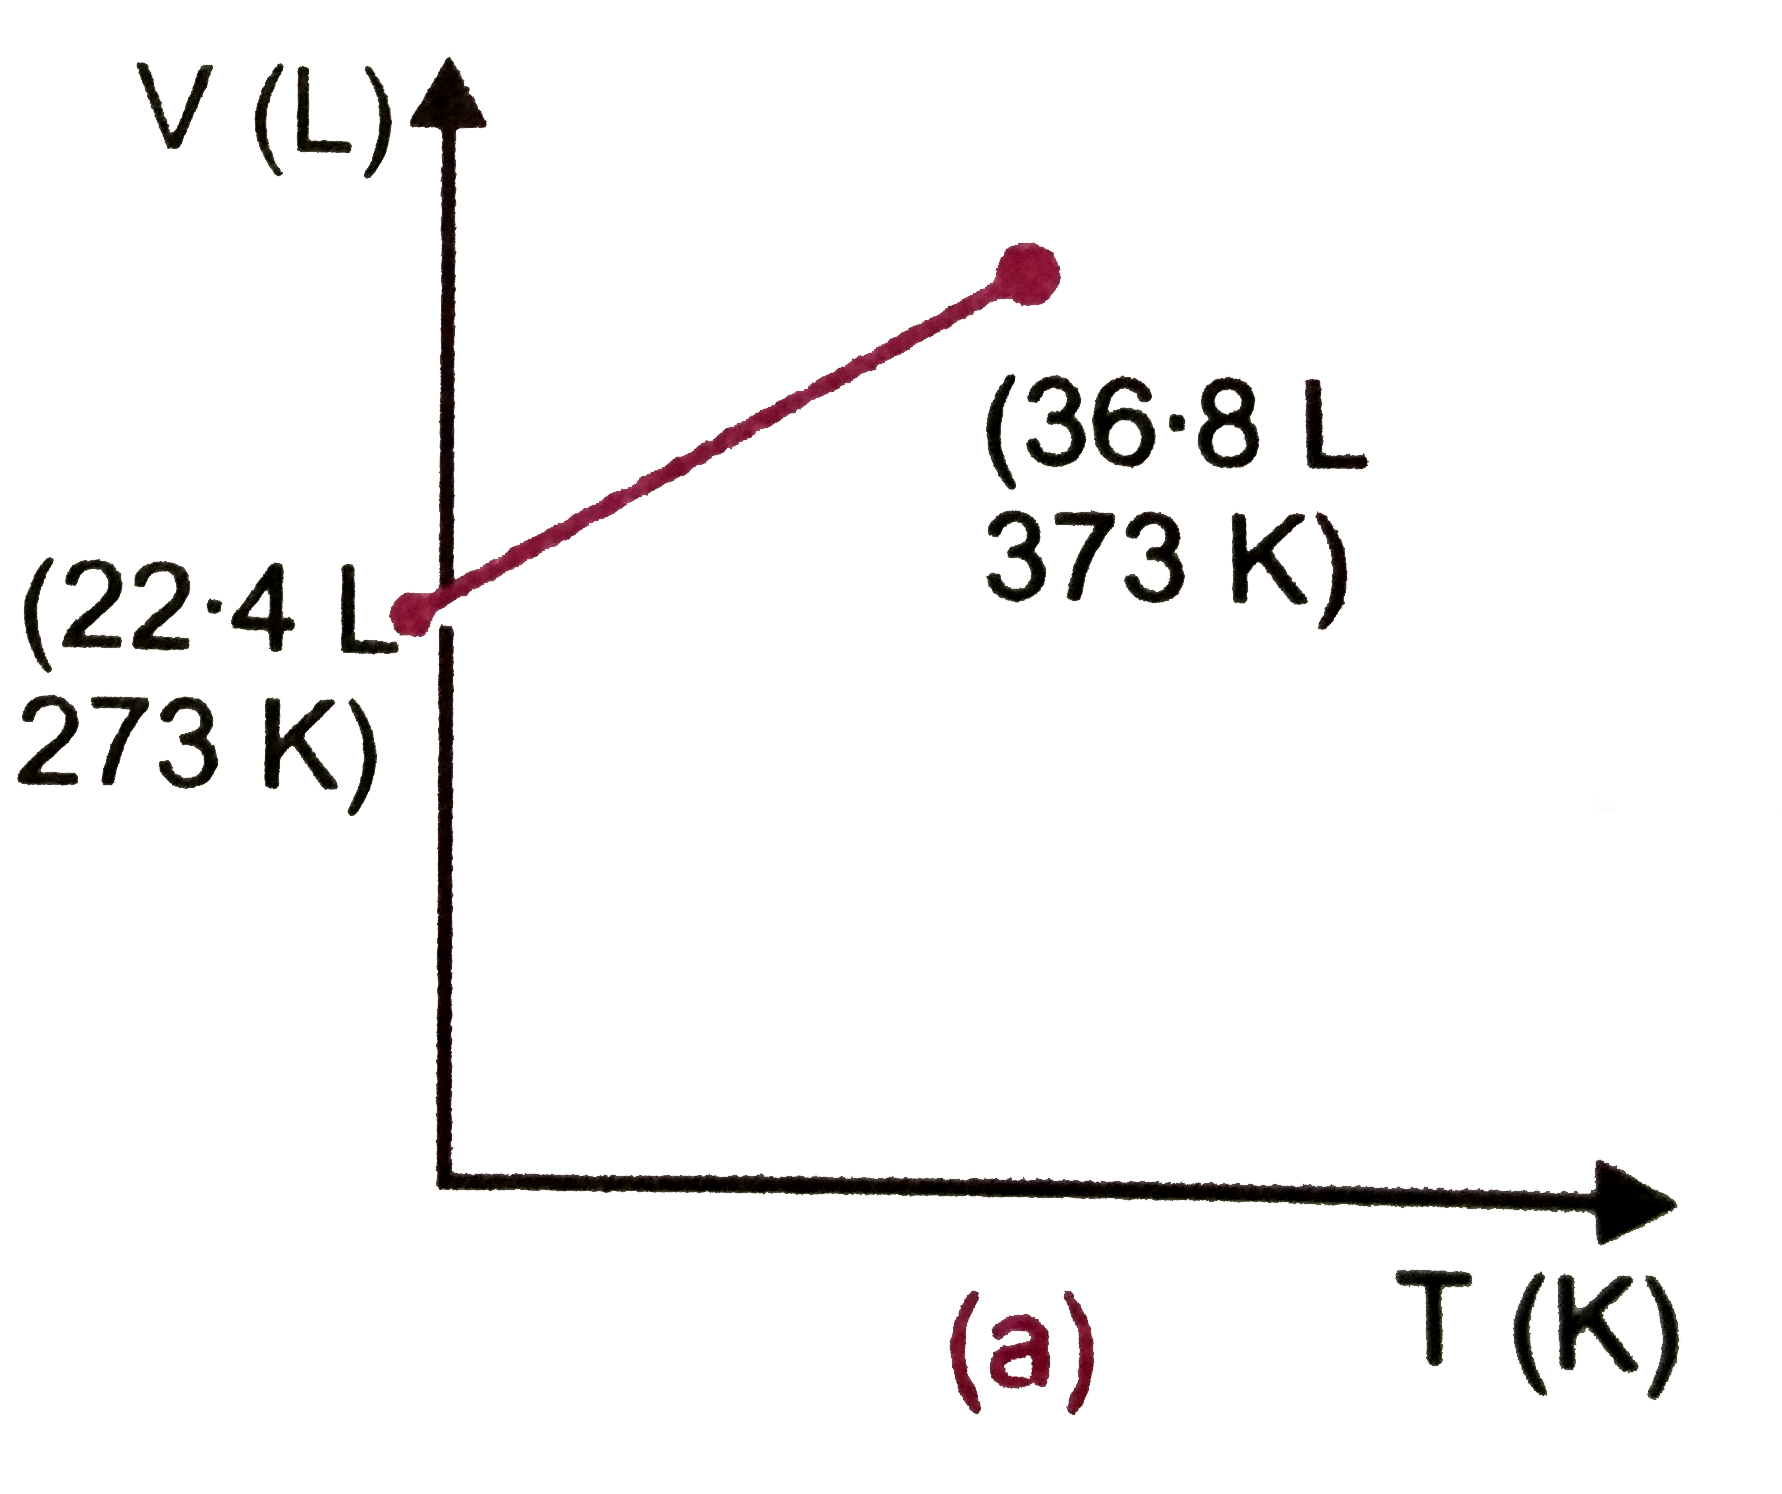 B
B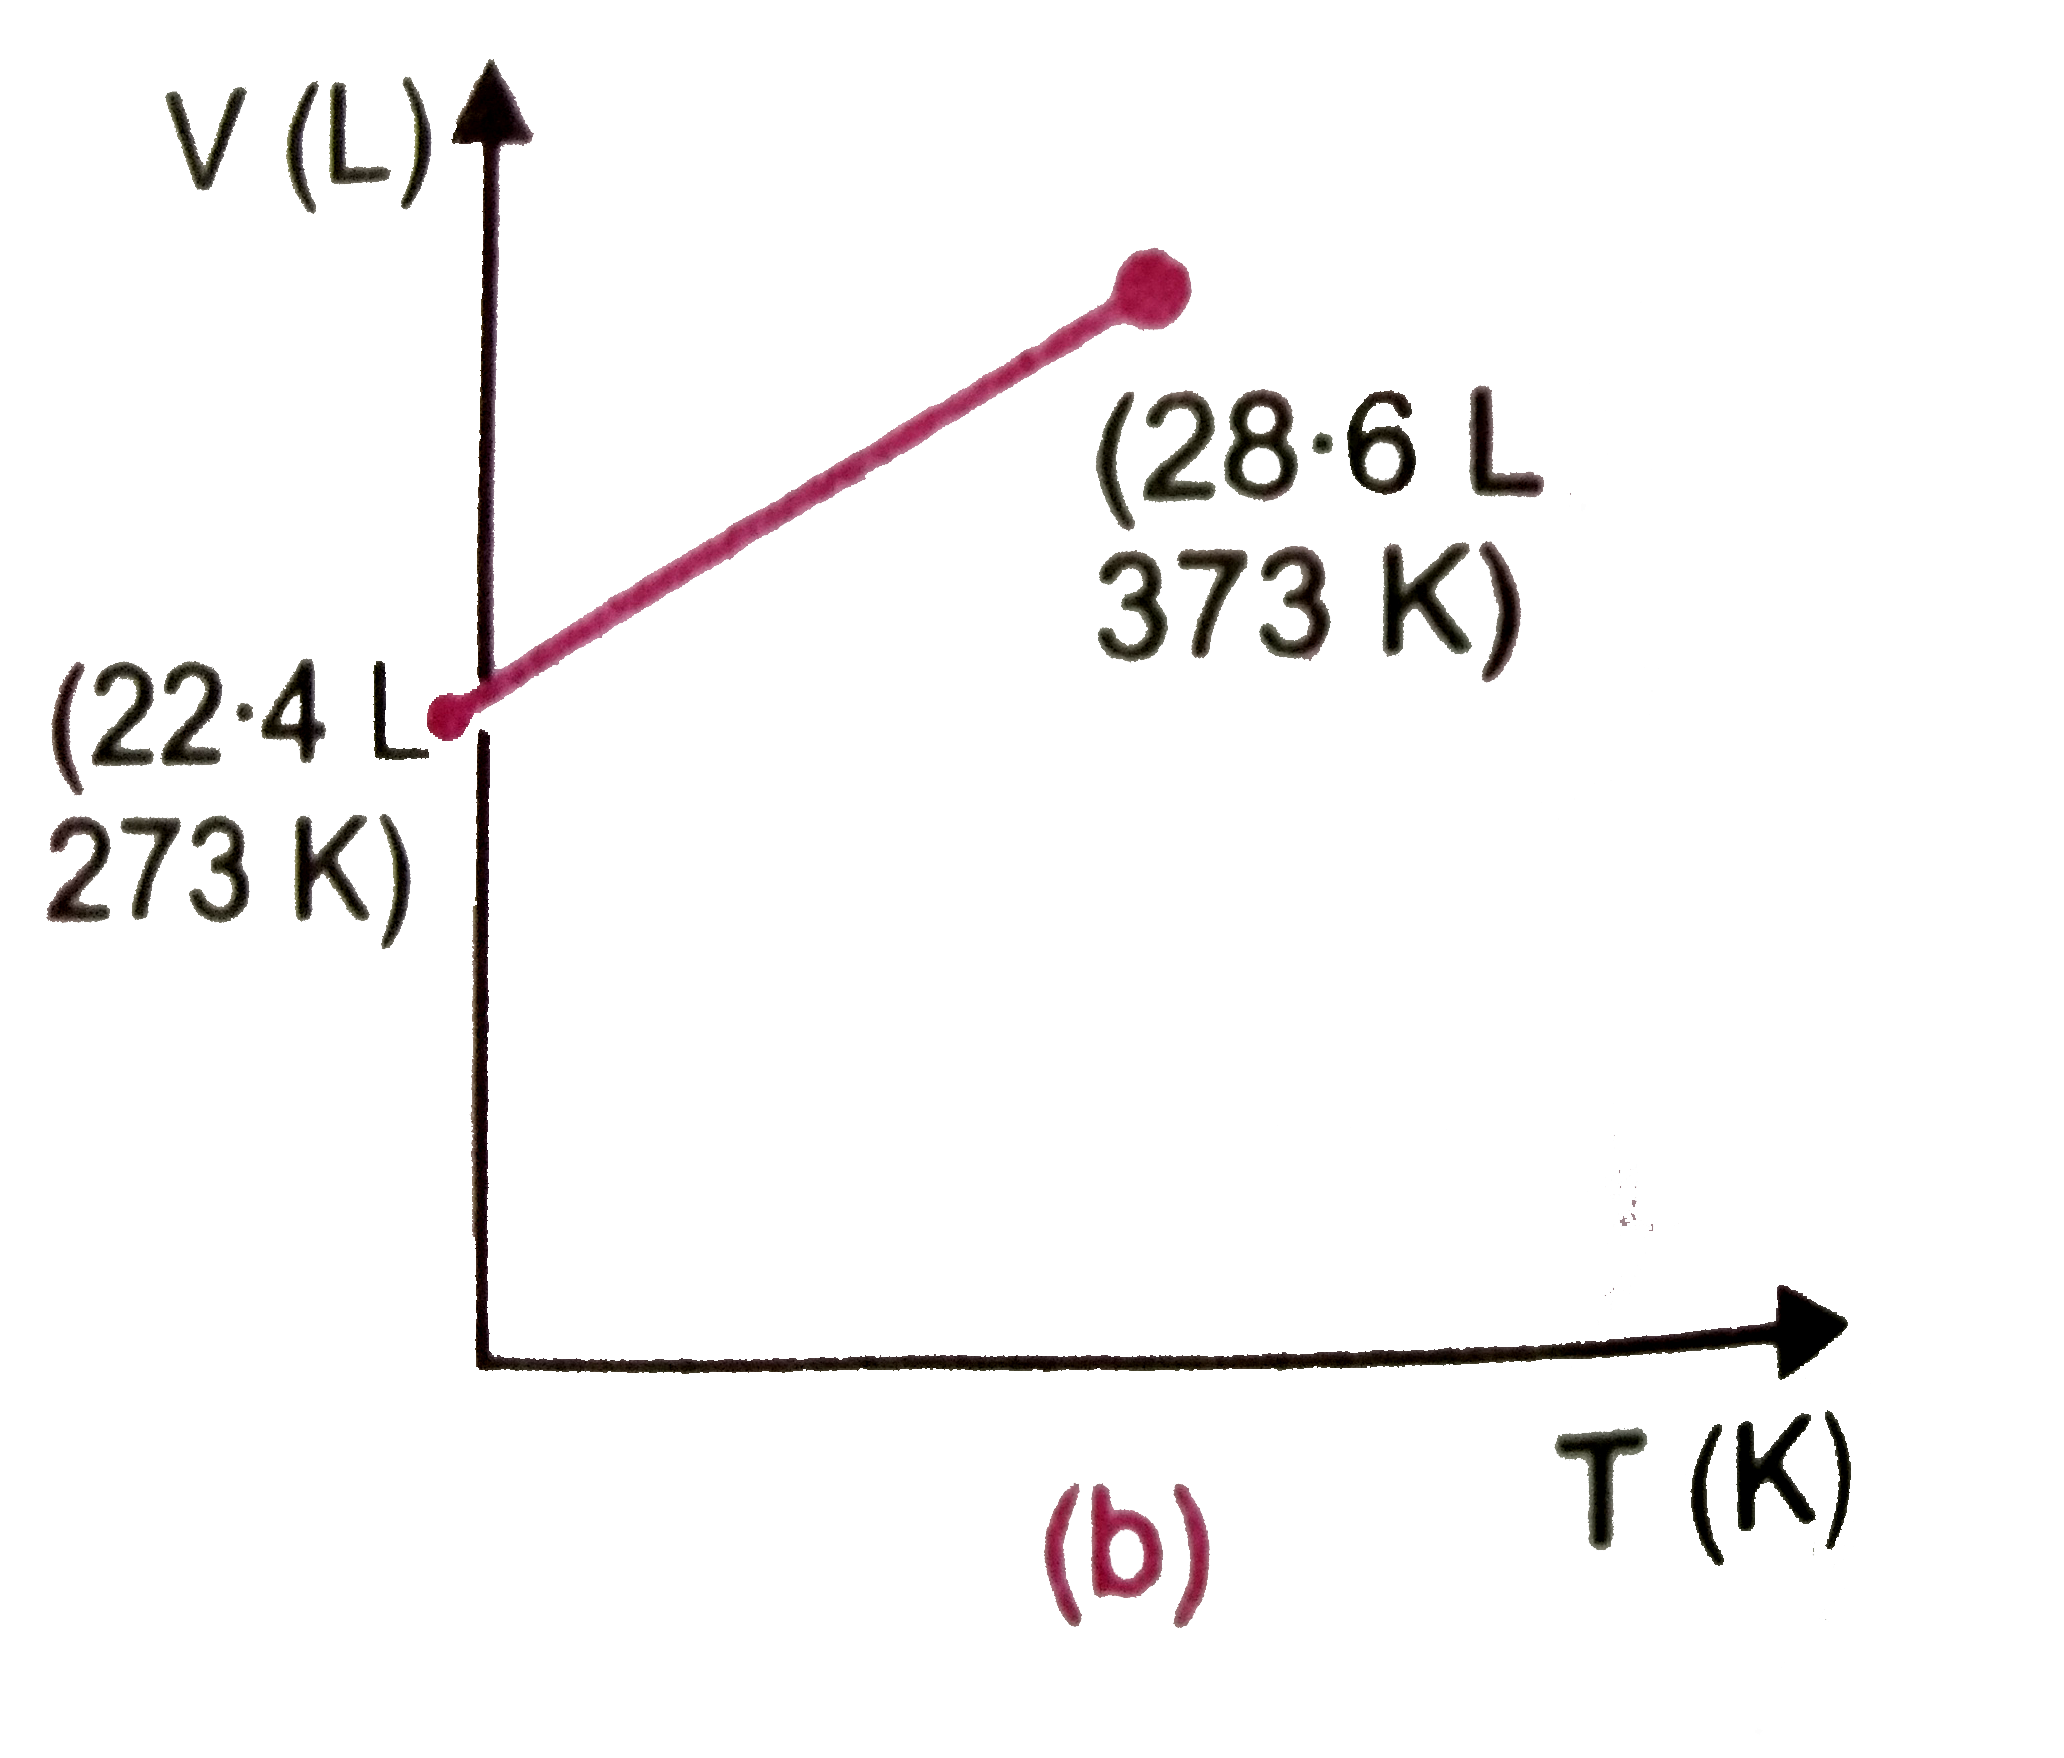 C
C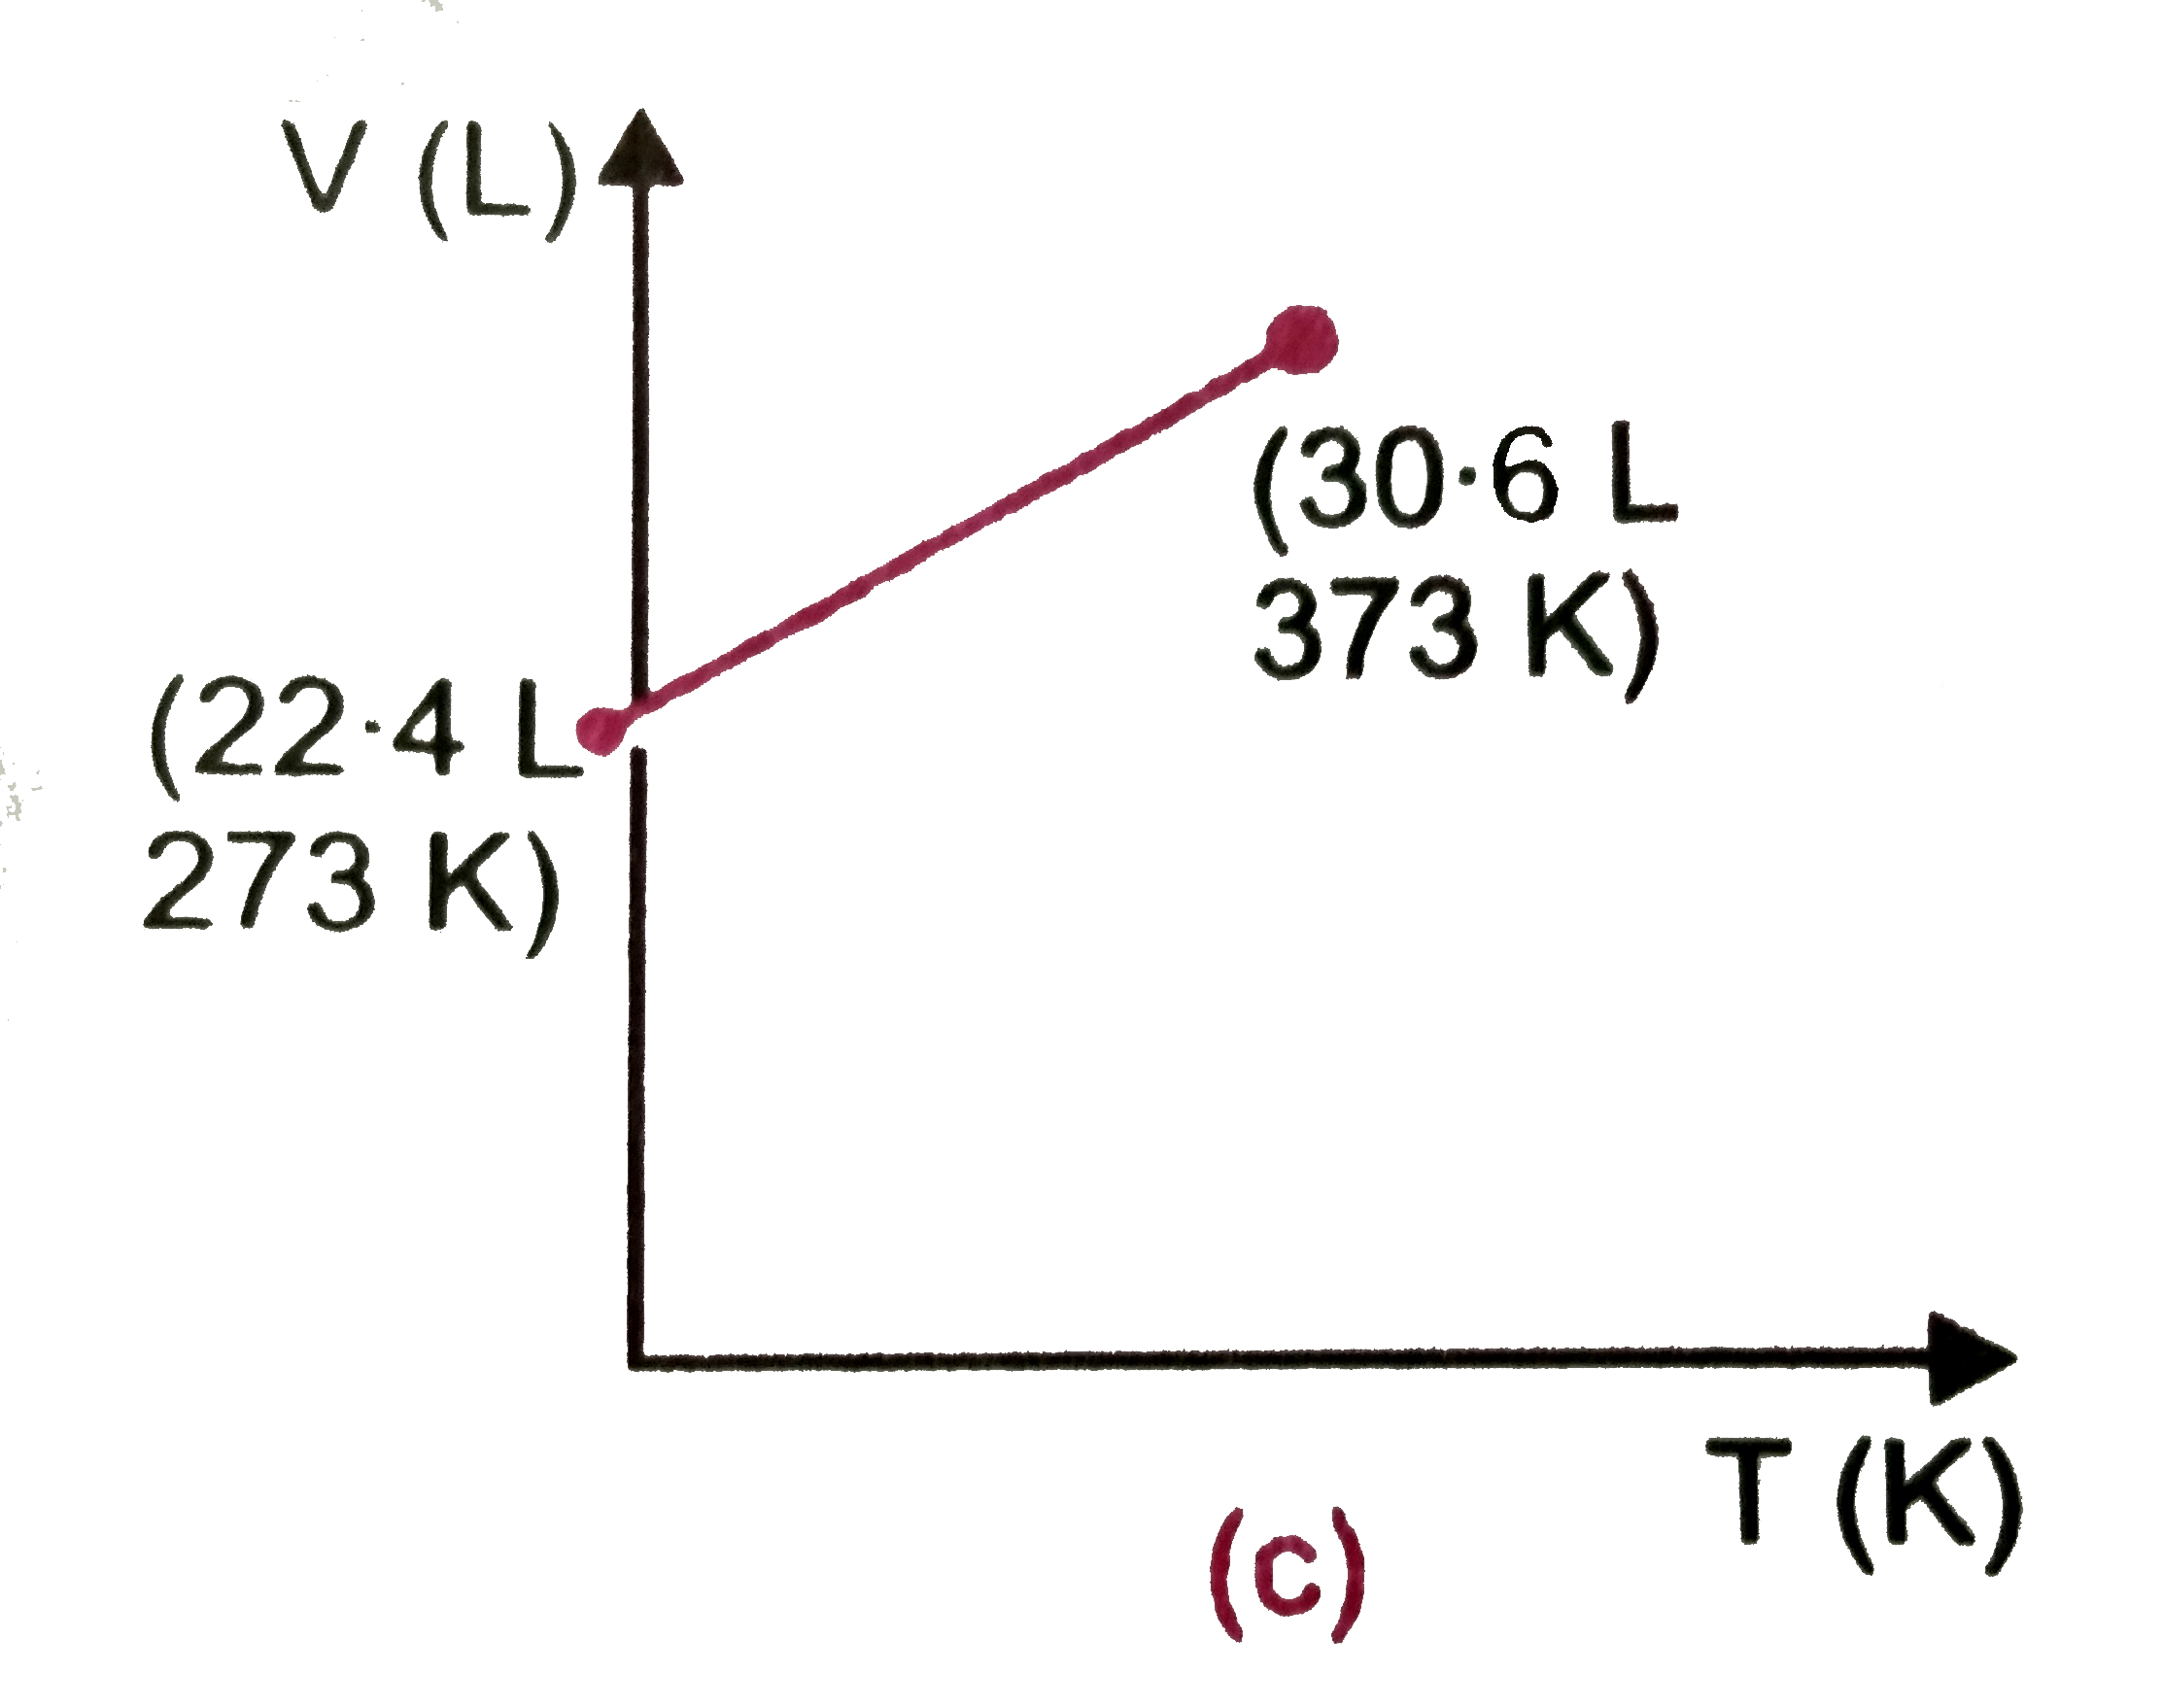 D
D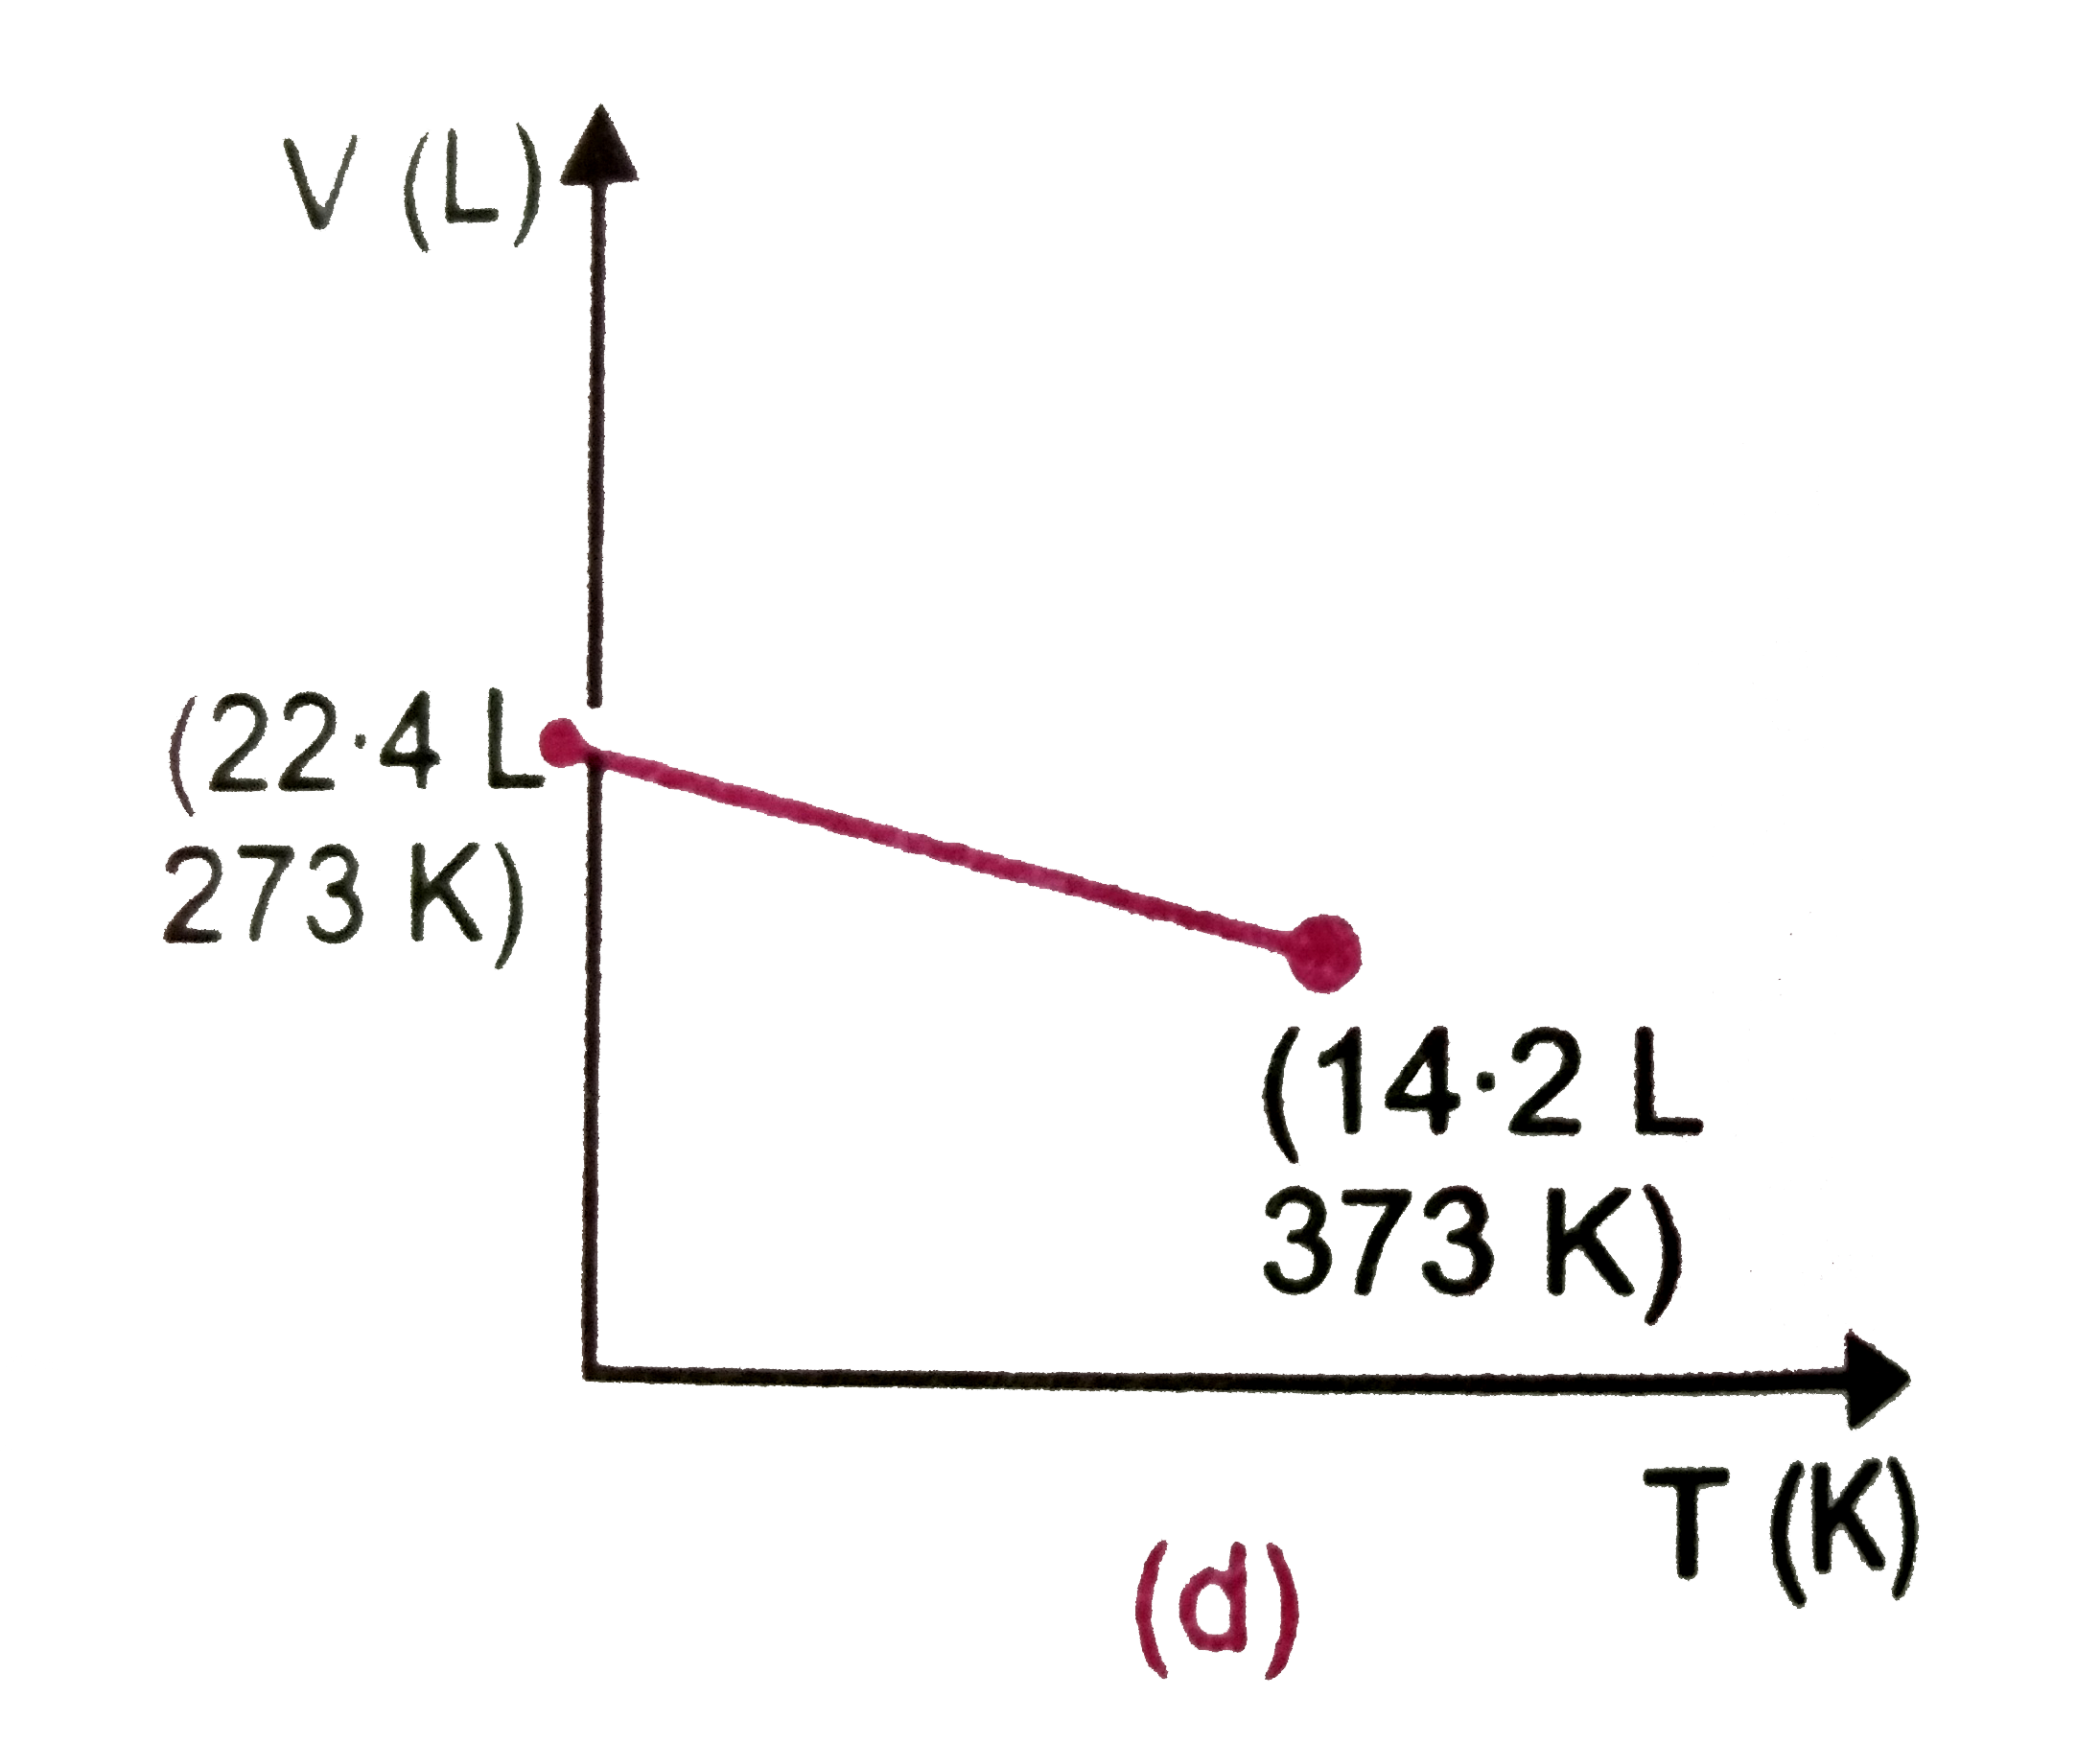
Which of the following volume (V) temperature (T) plots represents the behaviour of one mole of an ideal gas at one atmospheric pressure:
A B
B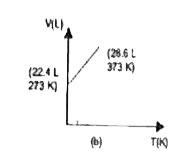 C
C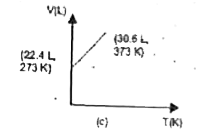 D
D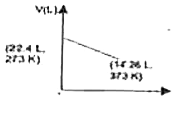
Which of the following volume-temperature (V−I) plots represents the behaviour of 1mole of an ideal gas at the atmospheric pressure?
View SolutionWhich one of the following volume (V)- temperature (T) plots represents the behaviour of one mole of an ideal gas at one atmosphere?
View SolutionThe graph that does represent the behaviour of an ideal gas is :
View SolutionWhich of the following graphs represent the behaviour of an ideal gas ?
View SolutionWhich of the following plots represents the behavior of an ideal binary liquid solution ?
View Solution
