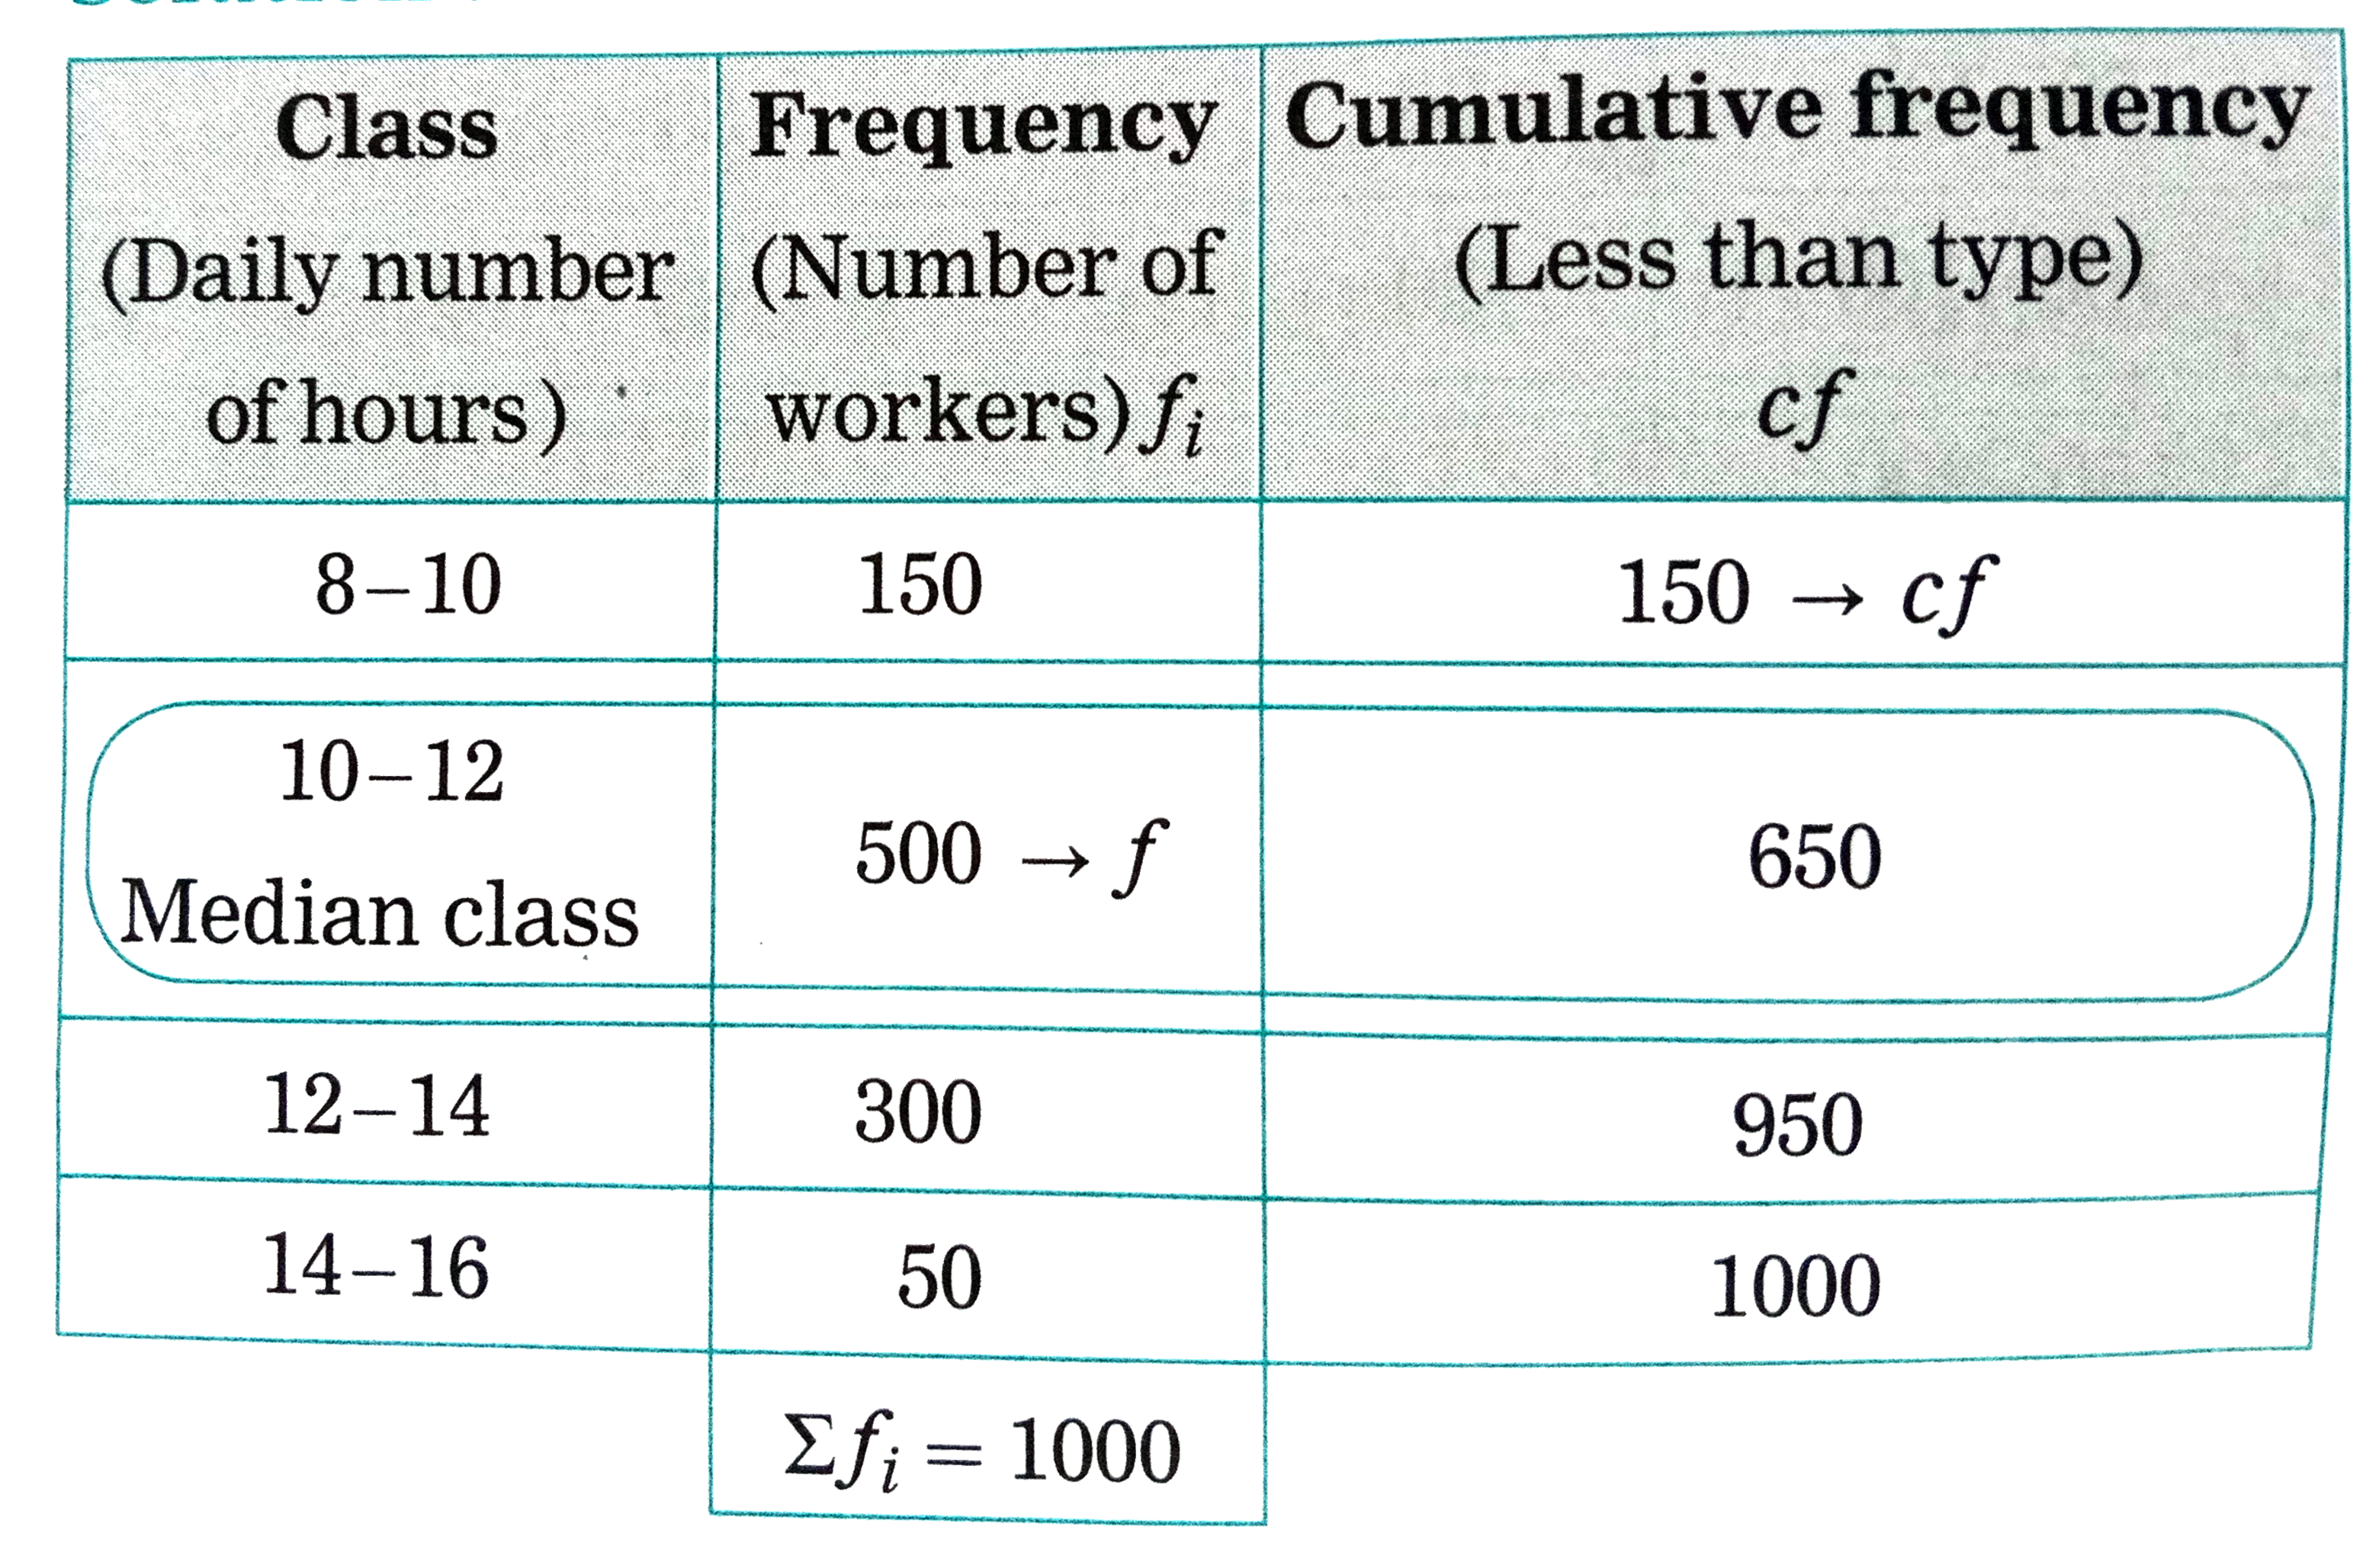
The following table shows classification of number of workers and the number of hours they work in a software company. Find the median of the number of hours they work.

The correct Answer is:The median of the number of hours they work daily is 11.4 .

Here, total of frequencies N=Σfi=1000
N2=10002=500. Cumulative frequency which is just greater than 500 is 650.
∴ the corresponding class 10−12 is the median class.
L = 10, f = 500 ( Frequency of the median class ),
cf=150,h=2
Median =L+⎡⎣N2−cff⎤⎦×h
=10+[500−150500]×2
=10+(350500)×2
=10+350250=10+1.4=11.4
Topper's Solved these Questions
- BOOK - NAVNEET PUBLICATION - MAHARASHTRA BOARDCHAPTER - STATISTICSEXERCISE - PRACTICE SET 6.34videos
STATISTICS
- BOOK - NAVNEET PUBLICATION - MAHARASHTRA BOARDCHAPTER - STATISTICSEXERCISE - PRACTICE SET 6.44videos
STATISTICS
- BOOK - NAVNEET PUBLICATION - MAHARASHTRA BOARDCHAPTER - STATISTICSEXERCISE - PRACTICE SET 6.16videos
STATISTICS
- BOOK - NAVNEET PUBLICATION - MAHARASHTRA BOARDCHAPTER - SIMILARITYEXERCISE - SUBJECTIVE TYPE20videos
SIMILARITY
- BOOK - NAVNEET PUBLICATION - MAHARASHTRA BOARDCHAPTER - THEOREMS EXERCISE - CIRCLE15videos
THEOREMS
Similar Questions
The following table shows the classification of number of vehicles and their speeds on Mumbai-Pune express way. Find the median of the data.
 View Solution
The following table shows the classification of number of vehicles and their speeds on Mumbai - Pune expressway. Find the median of the data .
 View Solution
The following table shows the classification of number of vehicles and their speeds on Mumbai-pune express way.Find the median of the data.
 View Solution
The following table shows the classification of percentages of marks of students and the number of students.Draw a frequency polygen from the table.
 View Solution
The following frequency distribution table shows the classification of the number of vehicles and the volume of petrol filled in them. Find the mode of the volume.
 View Solution
The following table shows the classification of percentages of marks of students and the number of students. Draw a frequency polygon from the table.
 View Solution
The following table shows the number of working hours and the number of employees employed in a small scale industry. No. of working hours No. of employees 3 – 5 7 5 – 7 10 7 – 9 18 9 – 11 57 11 – 13 14 13 – 15 8 The average number of working hours of an employee is (a) 8.5 (b) 9.5 (c) 10.5 (d) None of these
View SolutionThe following table shows the frequency table of daily wages of 50 workers in a trading company. Find the mean wages of a worker, by assumed mean method.
 View Solution
The following table shows the number of patients of differents age groups admitted to a hospital for treatement on a day. Find the median age of the patients.
 View Solution
In a company 60% workers are males. It the number of females. Workers in the company is 800. What is the number of male workers in the company ?
View Solution

