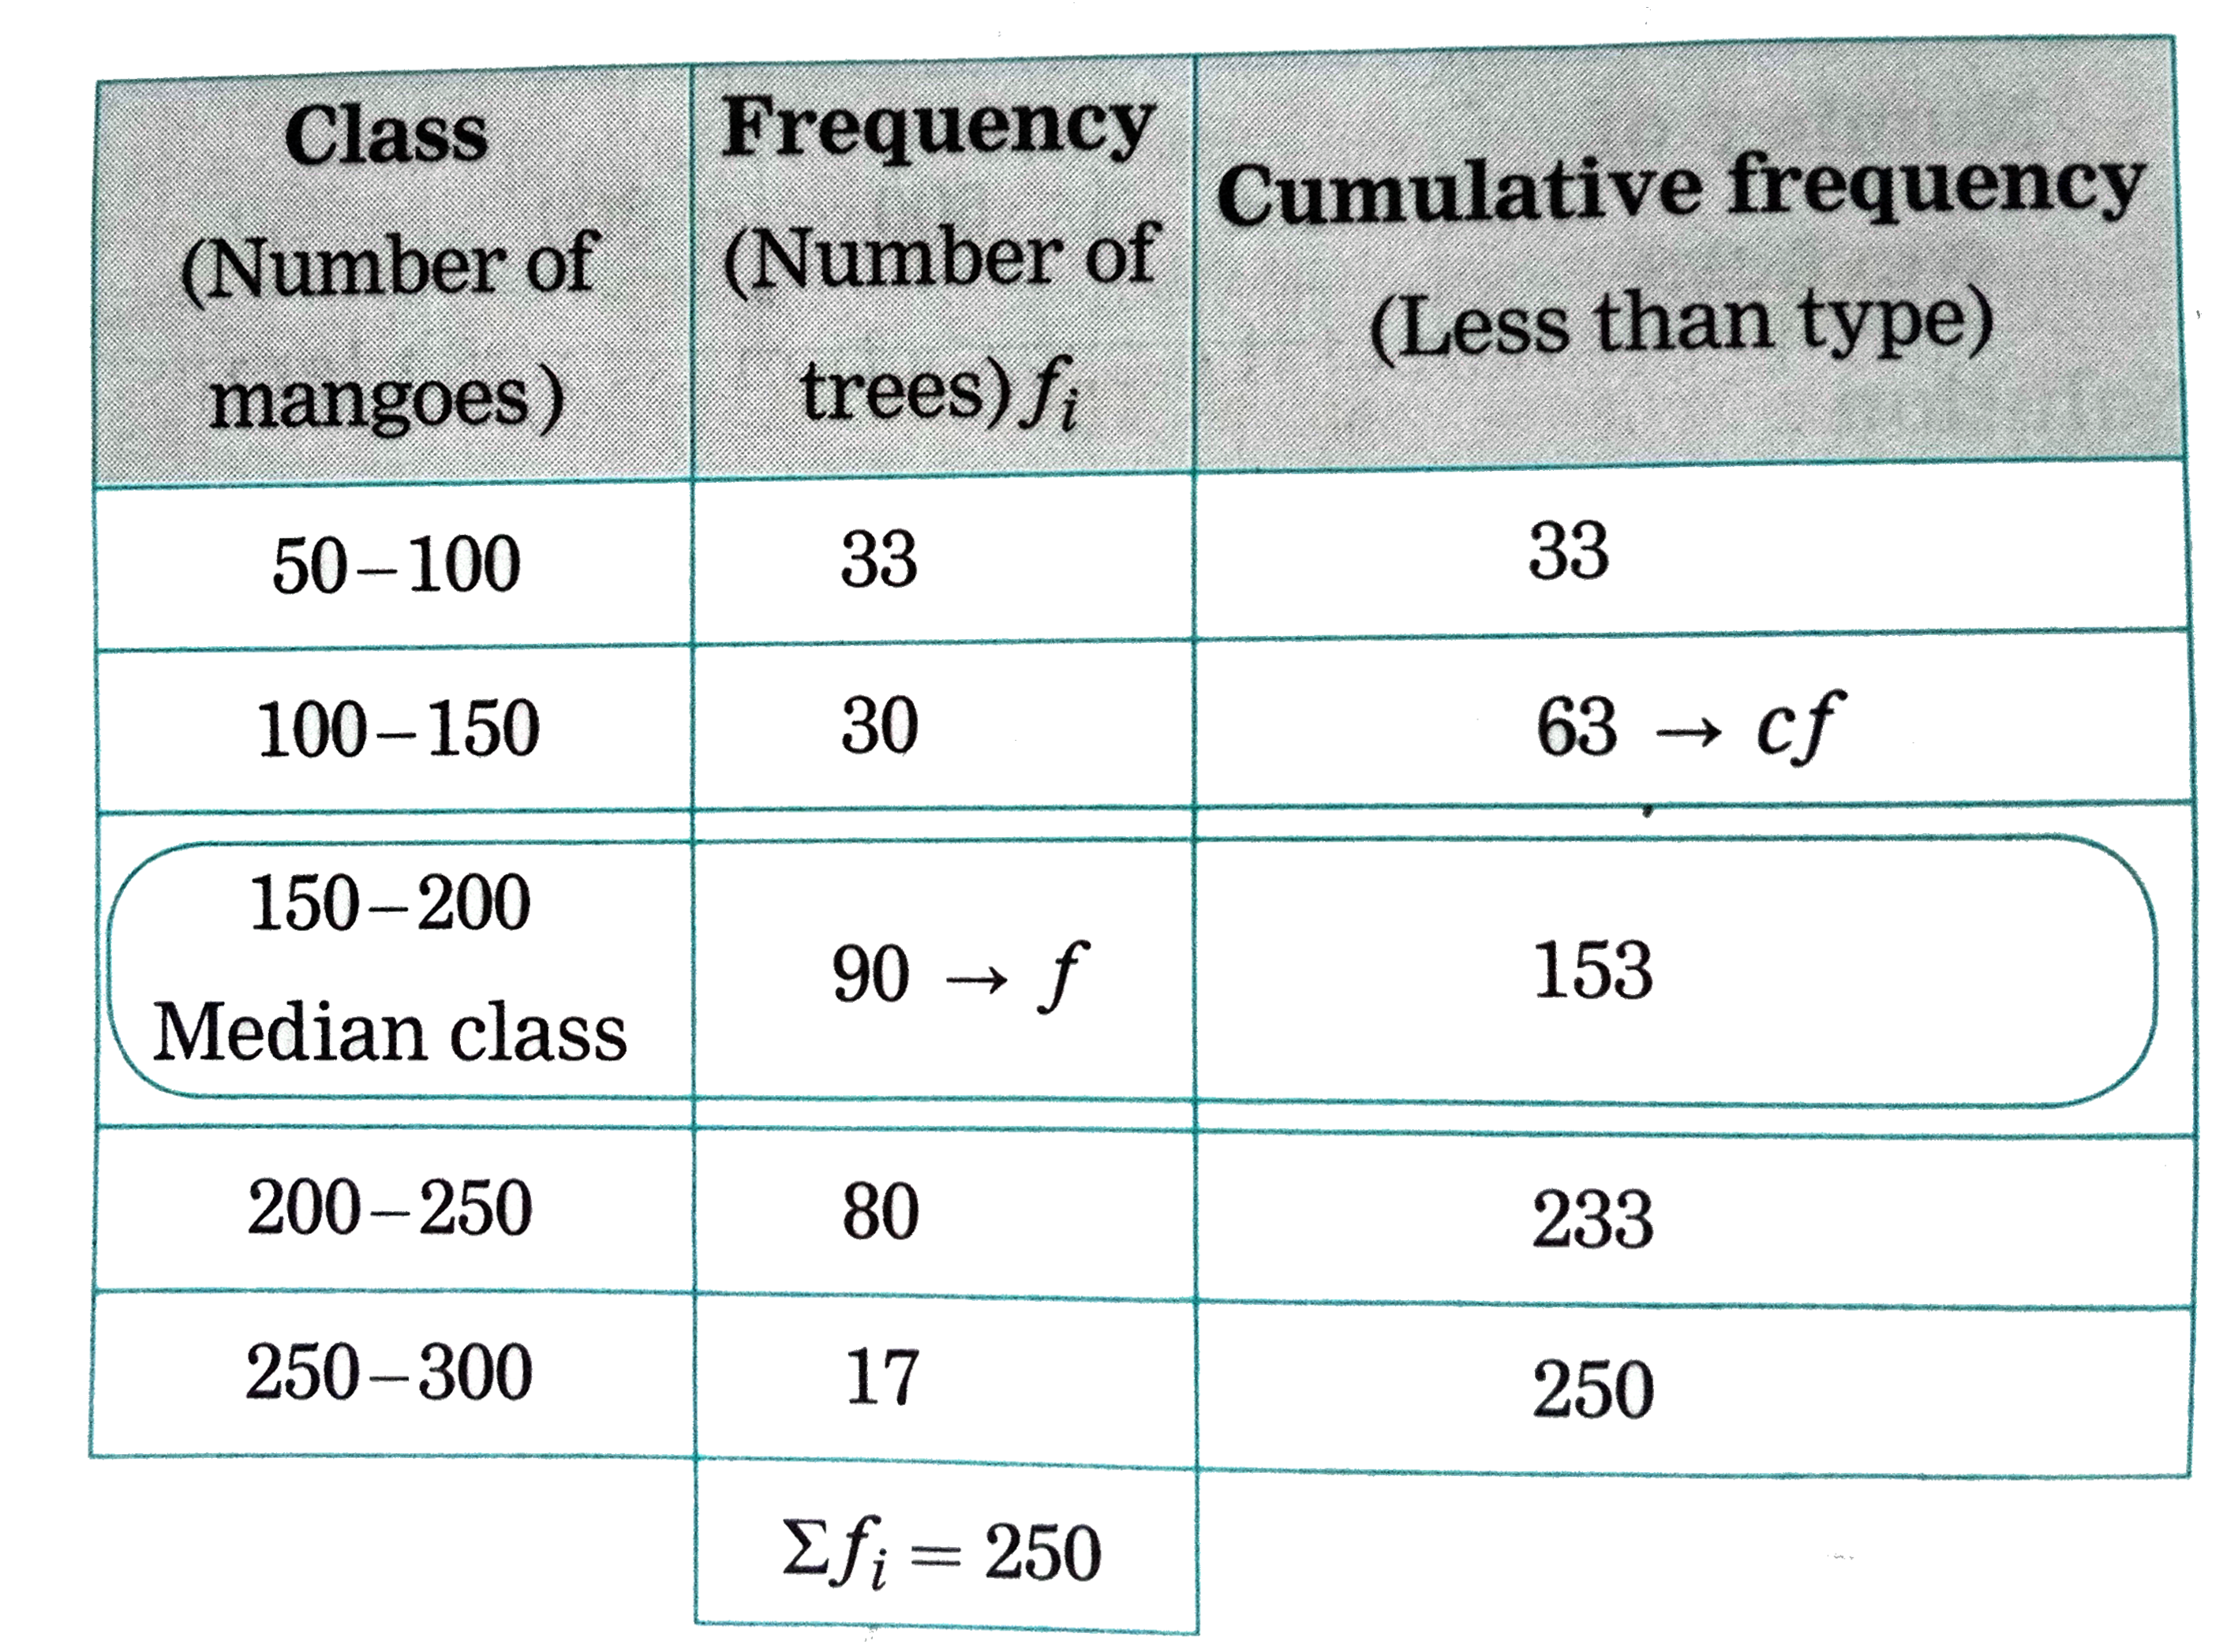
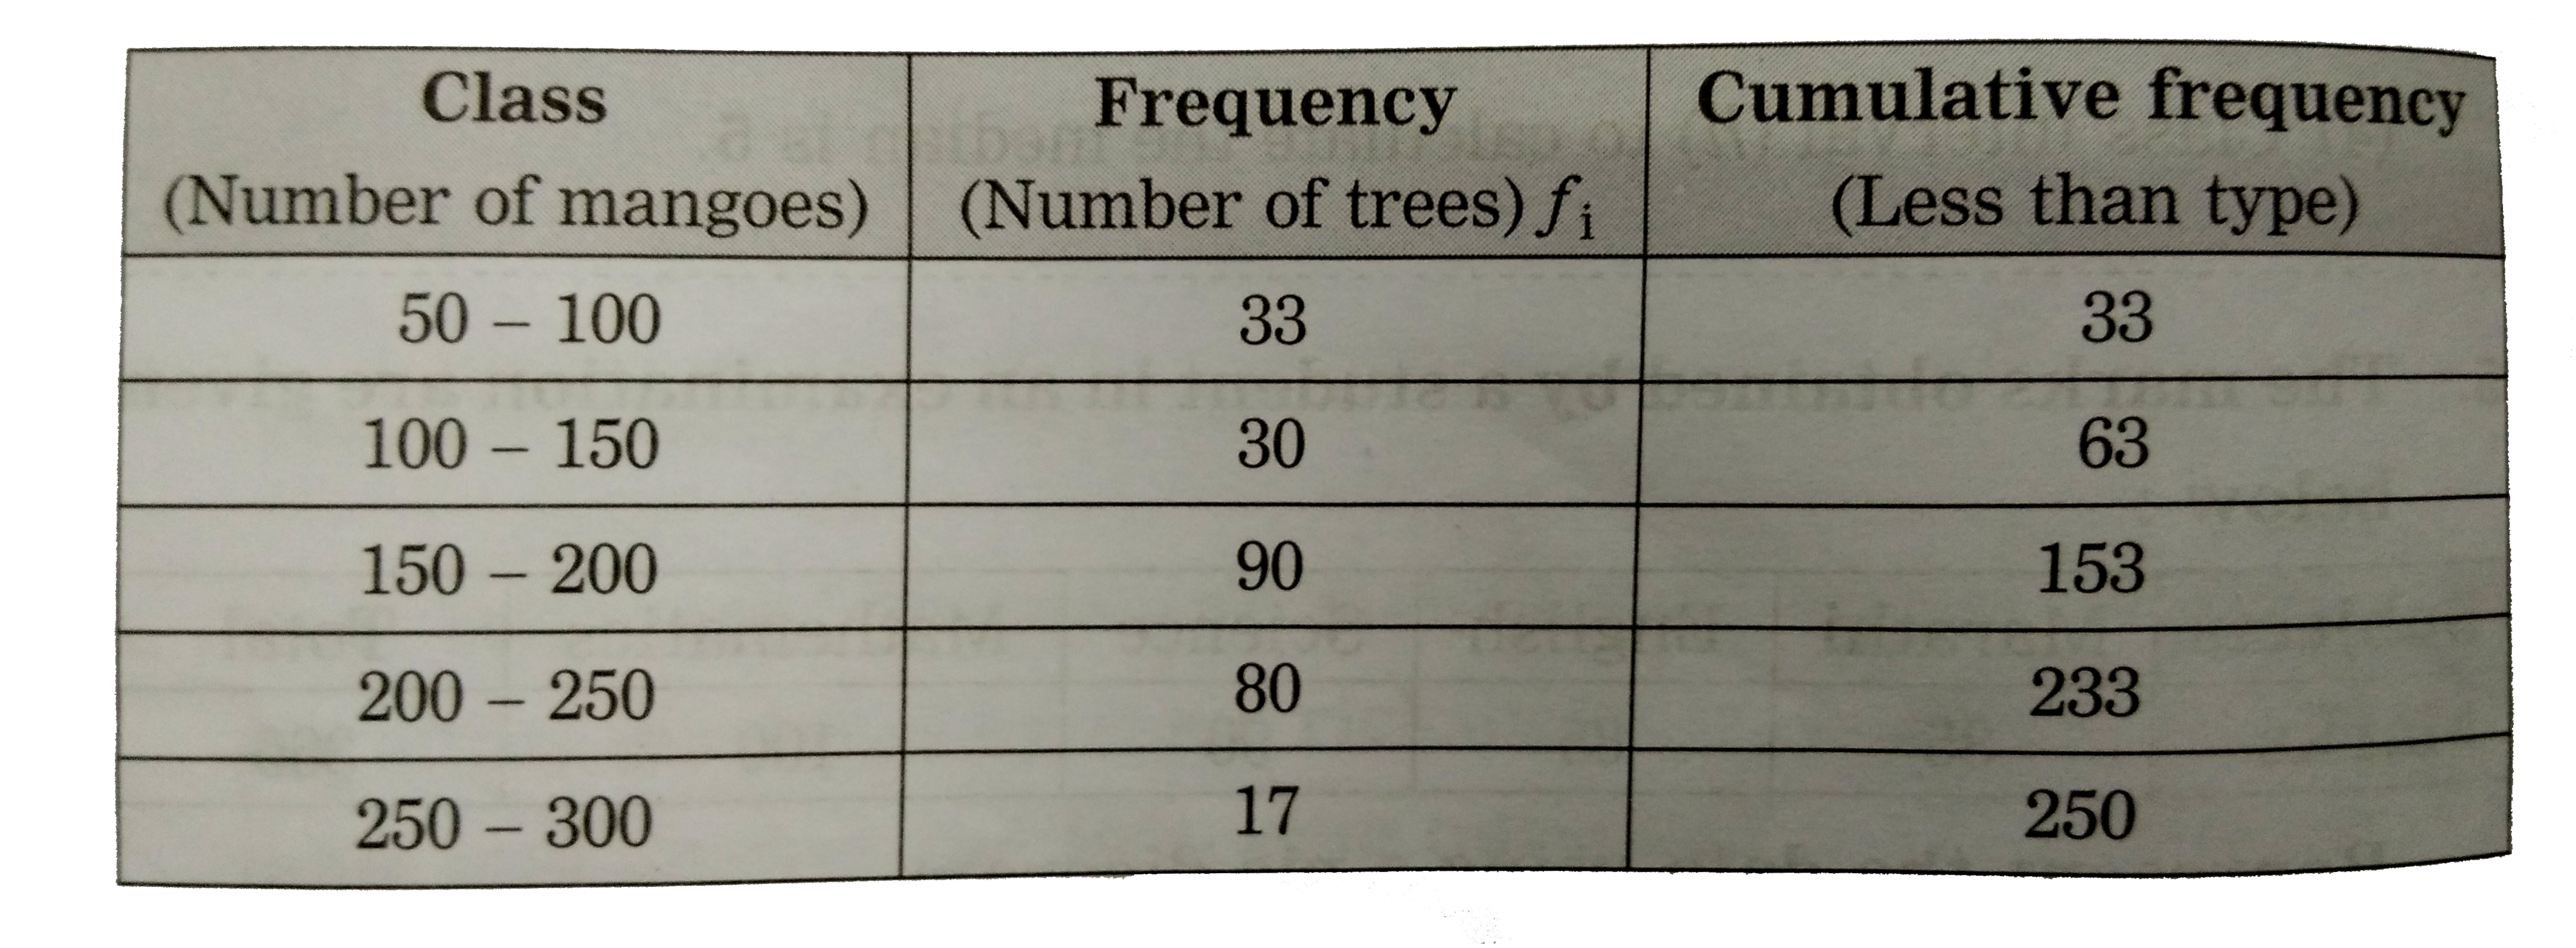
The frequency distribution table shows the number of mango trees in a grove and their yield of mangoes. Find the median of data.

The correct Answer is:The median of the data is 184 mangoes.

Here, total of frequencies N=Σfi=250
N2=2502=125
Cumulative frequency which is just greater than class .
L=150,f=90,cf=63,h=50
Median =L+⎡⎣N2−cff⎤⎦×h
=150+[150−6390]×50
=150+6290×50≈150+34.4≈184.4
But the number of mangoes cannot be in fraction
∴ the number of mangoes is 184.
Topper's Solved these Questions
- STATISTICSBOOK - NAVNEET PUBLICATION - MAHARASHTRA BOARDCHAPTER - STATISTICSEXERCISE - PRACTICE SET 6.3
4 Videos
- STATISTICSBOOK - NAVNEET PUBLICATION - MAHARASHTRA BOARDCHAPTER - STATISTICSEXERCISE - PRACTICE SET 6.4
4 Videos
- STATISTICSBOOK - NAVNEET PUBLICATION - MAHARASHTRA BOARDCHAPTER - STATISTICSEXERCISE - PRACTICE SET 6.1
6 Videos
- SIMILARITYBOOK - NAVNEET PUBLICATION - MAHARASHTRA BOARDCHAPTER - SIMILARITYEXERCISE - SUBJECTIVE TYPE
20 Videos
- THEOREMS BOOK - NAVNEET PUBLICATION - MAHARASHTRA BOARDCHAPTER - THEOREMS EXERCISE - CIRCLE
15 Videos
Similar Questions
The frequency distribution table shows the number of mango tree in a grove and their yield of mangoes.Find the megian of data.

View SolutionThe following frequency distribution table shows the number of mango trees in a grove, their yield of mangoes and also the cumulative frequency. Complete the following activity to find the median of the data.

Here, total of frequencies N=250.
N2=2502=125
The cumulative frequency which is just greater than 125 is □
∴ the corresponding class □ is the median class.
L=150,f=90,cf=□,h=50
Median =L+[□f]×h
=150+[□90]×50
=150+□90×50≈184.4
The median of the data is 184.4 mangoes.
View SolutionFrom the frequency distribution table from the following data

View SolutionObserve the following frequency distribution table. It shows the distances travelled by 60 public transport buses in a day. Find the median of the distance travelled.

View SolutionThe following frequency distribution table shows the classification of the number of vehicles and the volume of petrol filled in them. Find the mode of the volume.

View SolutionThe following table shows the classification of number of vehicles and their speeds on Mumbai-Pune express way. Find the median of the data.

View SolutionThe following table shows frequency distribution of the number of saplings planted by the students of a school :

Find the modal number of saplings planted.
View SolutionThe following table shows the classification of number of vehicles and their speeds on Mumbai - Pune expressway. Find the median of the data .

View SolutionThe following table shows the classification of number of vehicles and their speeds on Mumbai-pune express way.Find the median of the data.

View SolutionThe following table shows frequency distribution of marks of 100 students of 10th class which they obtianed in a practice examination. Find the median of the marks.

View Solution
