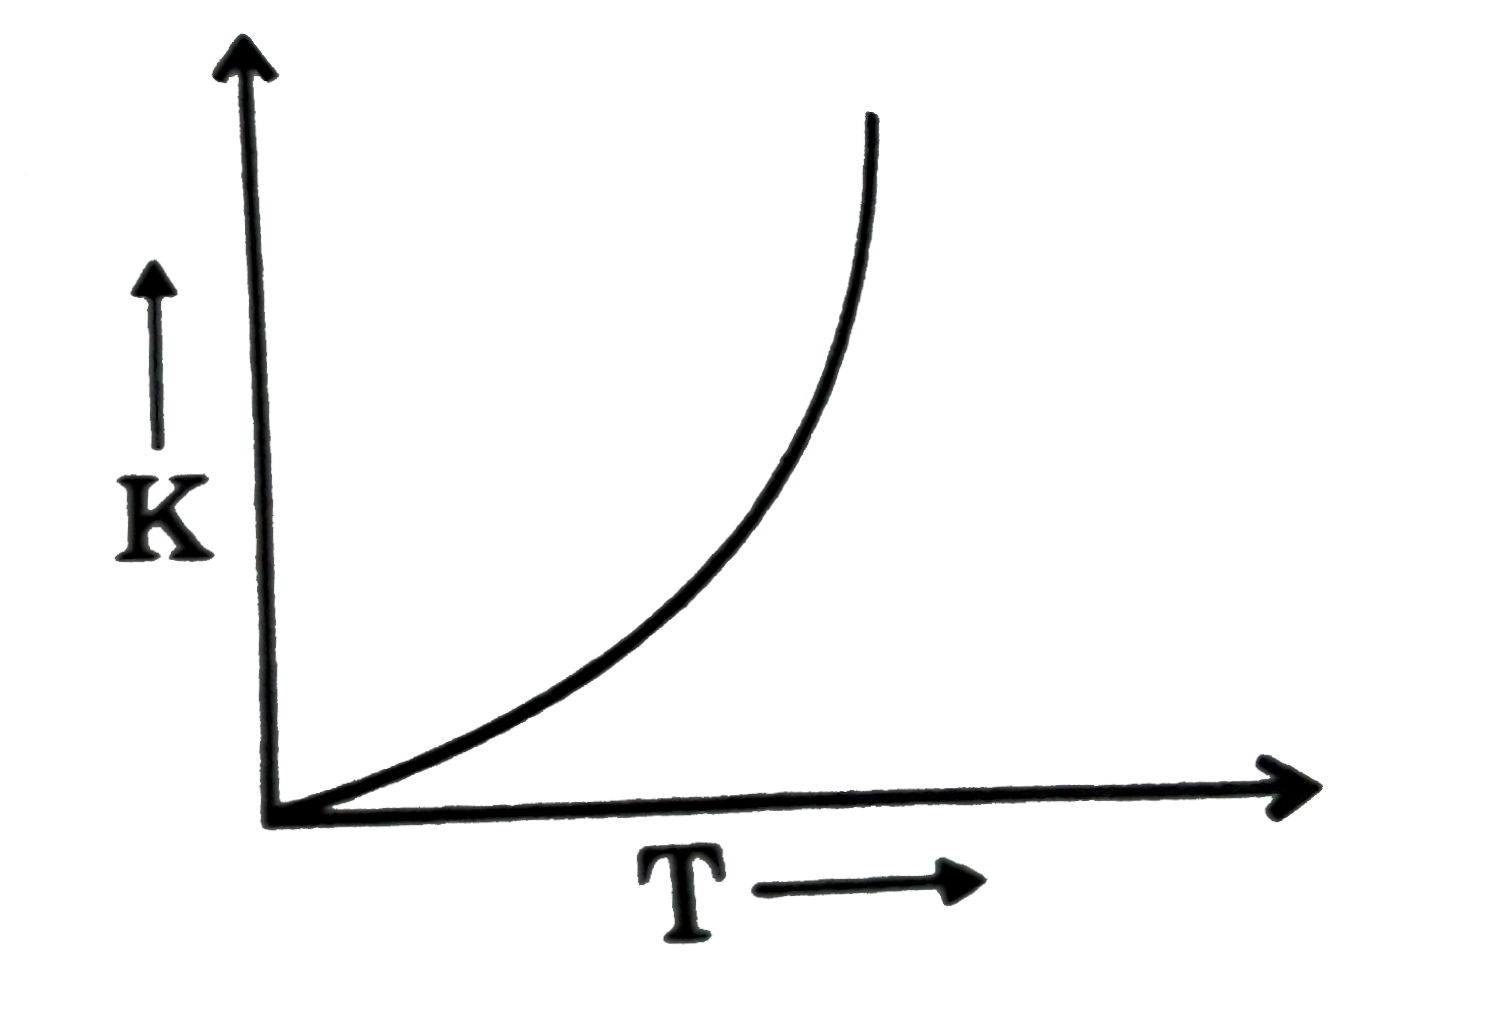
Rate constant vs temperature graph looks like: If the activation energy for the reaction is 100 kJ/mol, then what is the maximum temperature for this graph trend to be valid ? (R=253J/mol/K)

10000K
12000K
120000K
1000K
The correct Answer is:B
Step by step video, text & image solution for Rate constant vs temperature graph looks like: If the activation energy for the reaction is 100 kJ/mol, then what is the maximum temperature for this graph trend to be valid ? (R = (25)/(3)J//mol//K) by Chemistry experts to help you in doubts & scoring excellent marks in Class 12 exams.
Topper's Solved these Questions
- BOOK - GRB PUBLICATIONCHAPTER - GRAPHICAL INTERPRETATIONEXERCISE - I.Electrochemistry1videos
GRAPHICAL INTERPRETATION
- BOOK - GRB PUBLICATIONCHAPTER - GRAPHICAL INTERPRETATIONEXERCISE - Electrochemistry9videos
GRAPHICAL INTERPRETATION
- BOOK - GRB PUBLICATIONCHAPTER - GRAPHICAL INTERPRETATIONEXERCISE - H. Chemical Kinetics1videos
GRAPHICAL INTERPRETATION
- BOOK - GRB PUBLICATIONCHAPTER - F-BLOCK ELEMENTSEXERCISE - Subjective type7videos
F-BLOCK ELEMENTS
- BOOK - GRB PUBLICATIONCHAPTER - HYDROCARBON (ALIPHATIC)EXERCISE - Previous years jee questions28videos
HYDROCARBON (ALIPHATIC)
Similar Questions
Knowledge Check
- Question 1 - Select One
The activation energy of a reaction is 9.0kcal/mol.
The increase in the rate consatnt when its temperature is increased from 298K to 308K isA0.63B0.5C1D0.1 - Question 2 - Select One
What is the activation energy for a reaction if its rate doubles when the temperature is raised from 20∘C to 35∘C? (R=8.314Jmol K−)
A269kJ mol−1B34.7 kJ mol−1C15.1kJ mol−1D342kJ mol−1 - Question 3 - Select One
What is the activation energy for a reaction if its rate doubles when the temperature is raised from 20∘C to 35∘C?
(R=8.314 J mol−1K−1)A34.7 kJ mol−1B15.1 kJ mol−1C342 kJ mol−1D269 kJ mol−1
The activation energy of a reaction is 9.0kcal/mol.
The increase in the rate consatnt when its temperature is increased from 298K to 308K isView SolutionThe activation energy for most of the reaction is approximately 50kJmol−1. The rate for temperature coefficient for such reaction will be
View SolutionThe activation energy of a reaction is 9 kcal/mol. The increase in the rate constant when its temperature is raised from 395 to 300K is approximately
View SolutionThe activation energy of a reaction is 5 kcal/mol. The increase in the rate constant when its temperature is raised from 300 to 305 K is approximately
View SolutionThe activation energy for most of the reaction is approximately 50 kJ mol−1 The value of temperature coefficient for such reaction will be
View Solution

