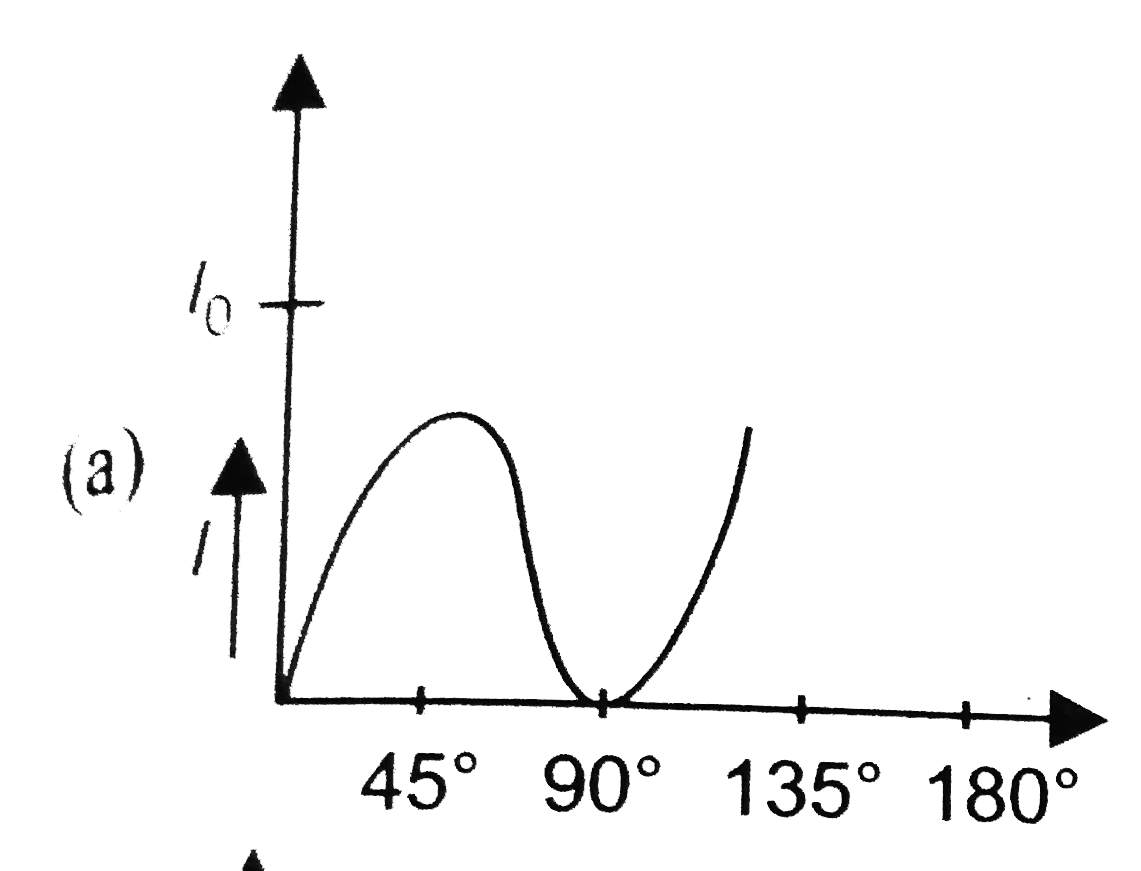
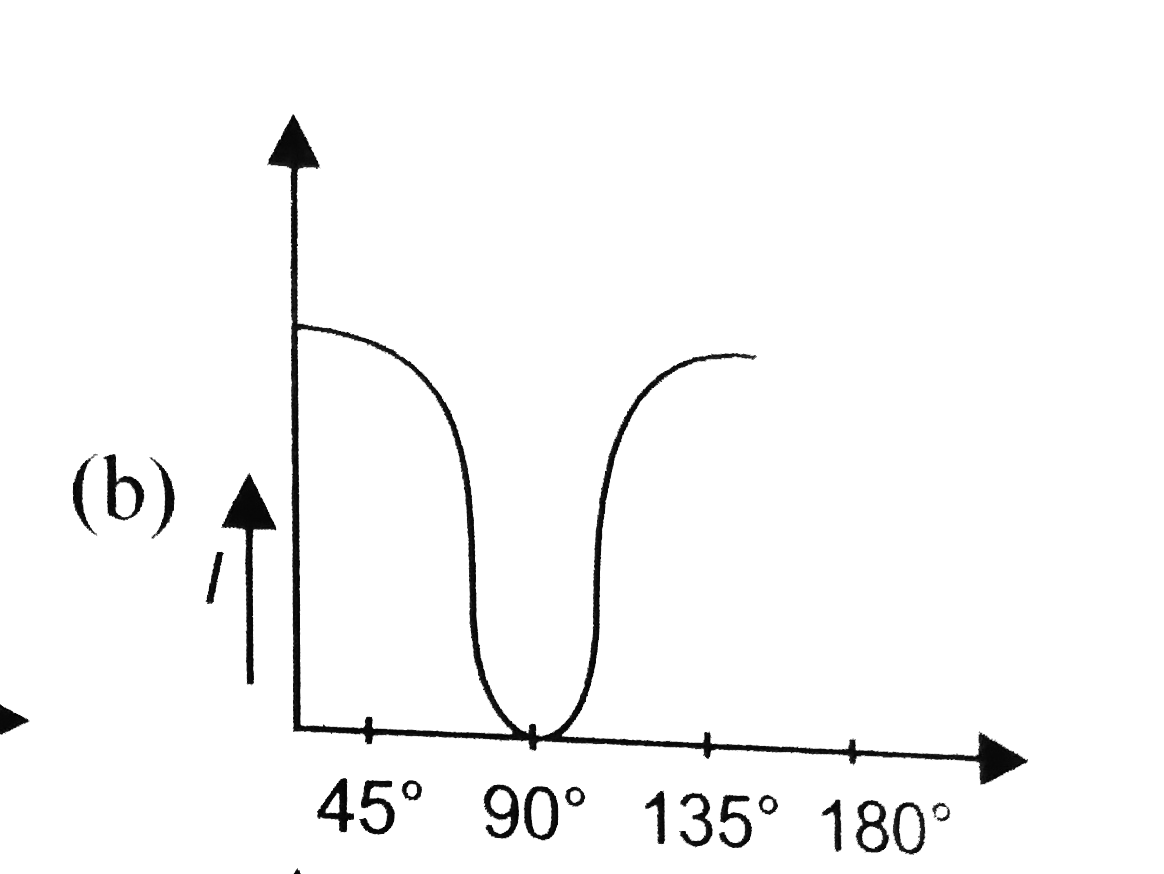
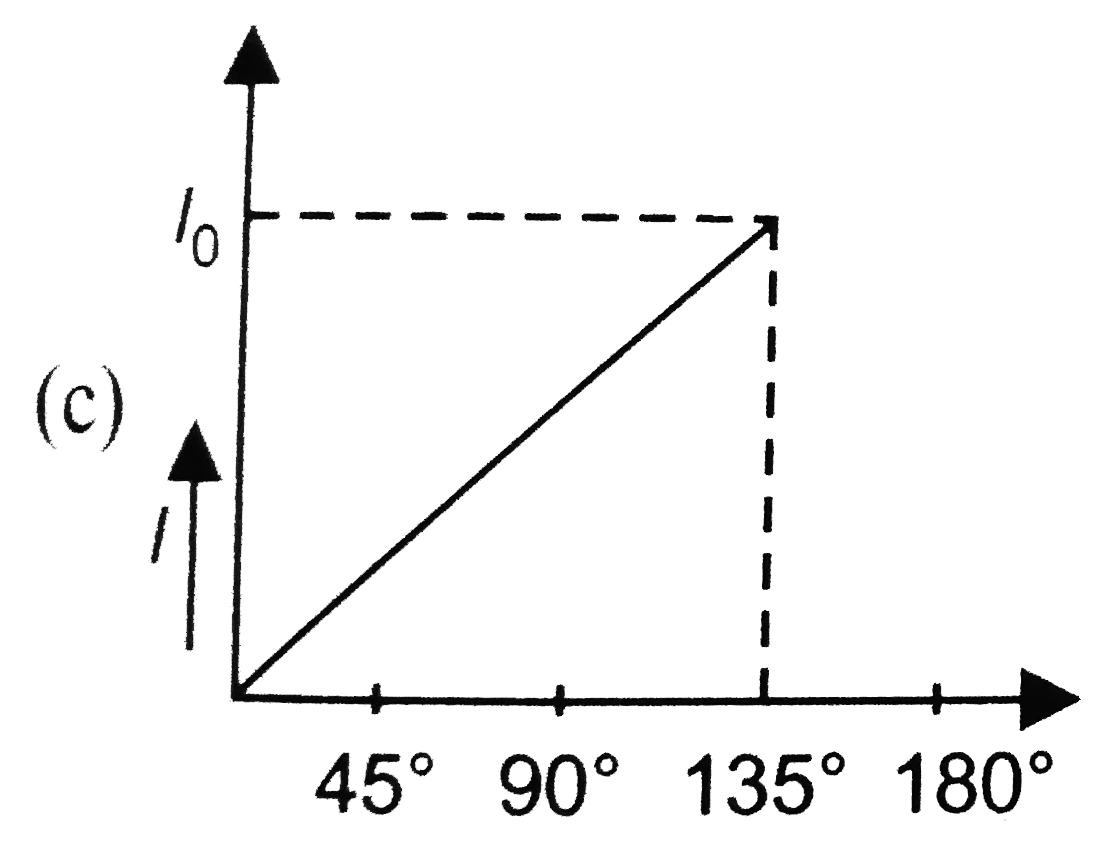
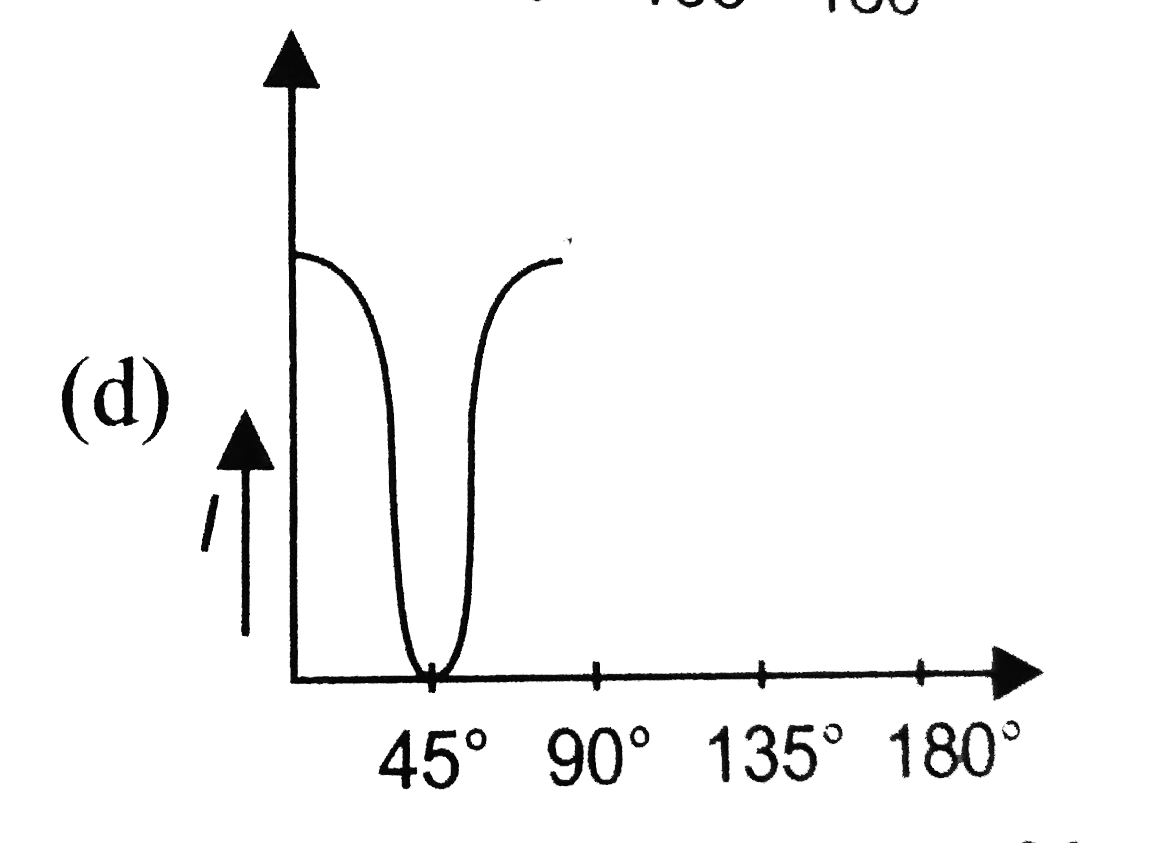
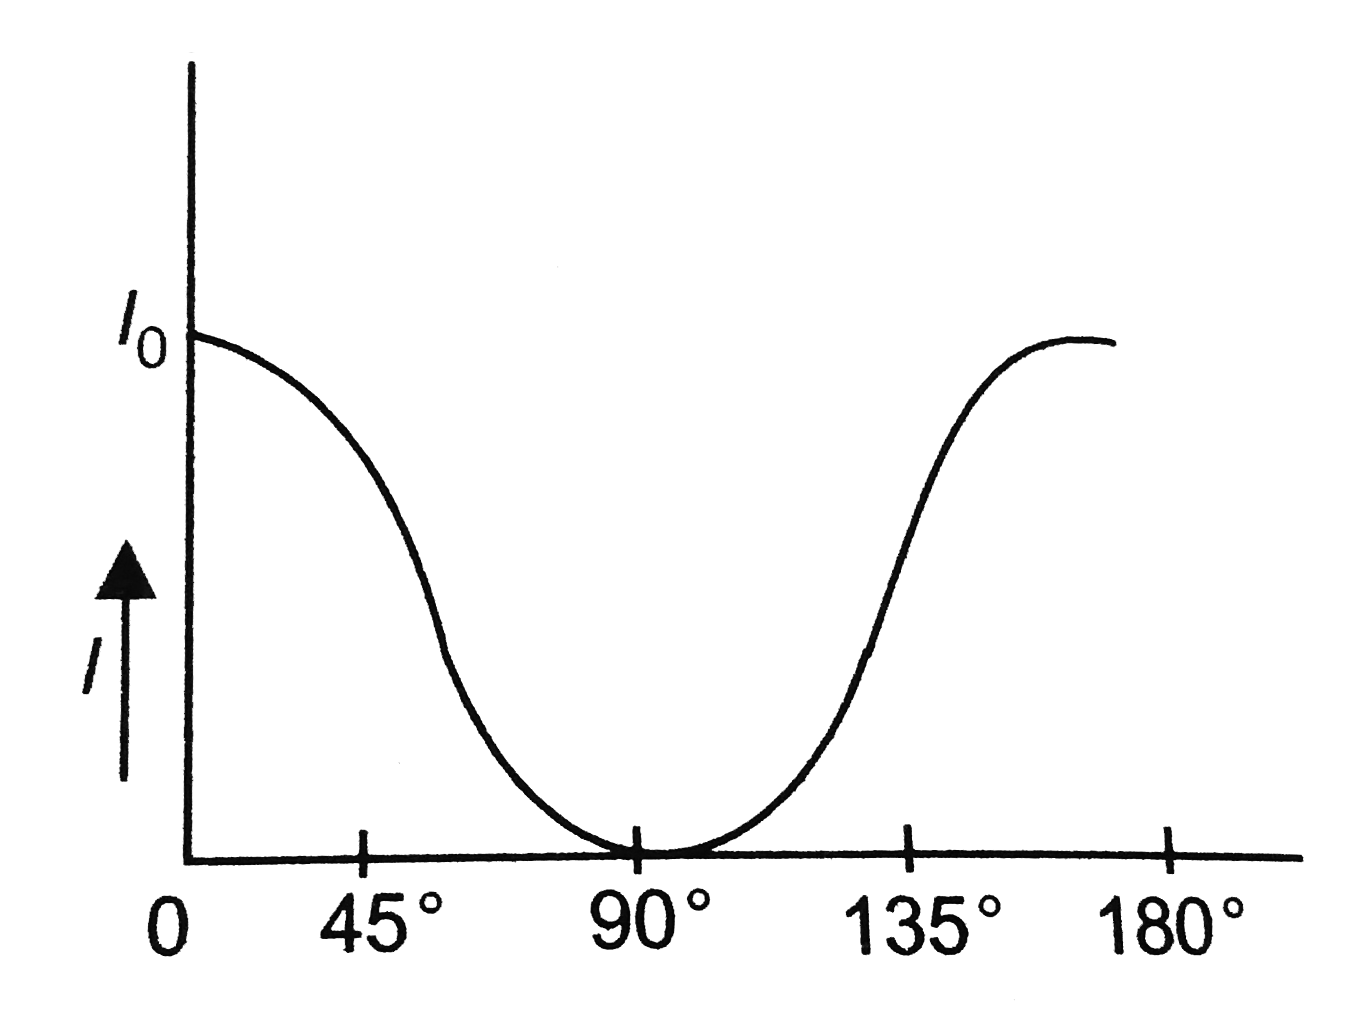
The graph showing the dependence of intensity transmitted light on the angle between polariser are analyser, is
The correct Answer is:B
According to law of Malus, when a beam of complately plane polarised light is incident on an analyser, the resulant intensity o flight (I) transmitted from the analyser varies directly as the square of the cosine of the angle (θ) between planes of transmission of analyser and polariser.
i.e., I∝cos2θ
and I=I0cosθ ..(i)
where I0= intensity of the light from polariser.
From Eq. (i), we note that if the transmission axes of polariser and analyser are parallel (i.e., θ=0∘ or 180∘), then I=I0. it means that intensity of transmitted light is maximum. when the transmission axes of polariser and analyser are perpendicular (i.e, θ=90∘), then I=Icos290∘=0. It means the intensity of transmitted light is minimum.
On plotting a graph between I and θ as givwn by relation (i), we get the curve as shown in figure.
Topper's Solved these Questions
- MOCK TESTBOOK - A2ZCHAPTER - MOCK TESTEXERCISE - Mock Test 3
44 Videos
- MOCK TESTBOOK - A2ZCHAPTER - MOCK TESTEXERCISE - Mock Test 3
44 Videos
- MAGNETISM AND MATTERBOOK - A2ZCHAPTER - MAGNETISM AND MATTEREXERCISE - Section D - Chapter End Test
30 Videos
- NUCLEAR PHYSICSBOOK - A2ZCHAPTER - NUCLEAR PHYSICSEXERCISE - Section D - Chapter End Test
29 Videos
Similar Questions
Name one device for producing polarized light. Draw a graph showing the dependence of intensity of transmitted light on the angle between polarizer and analyser.
View SolutionDraw a graph that shows the dependence of intensity of transmitted light on the angie between Polariser and analyser.
View Solution
Knowledge Check
The graph showing the dependence of intensity of transmitted light on the angle between polariser and analyser is
A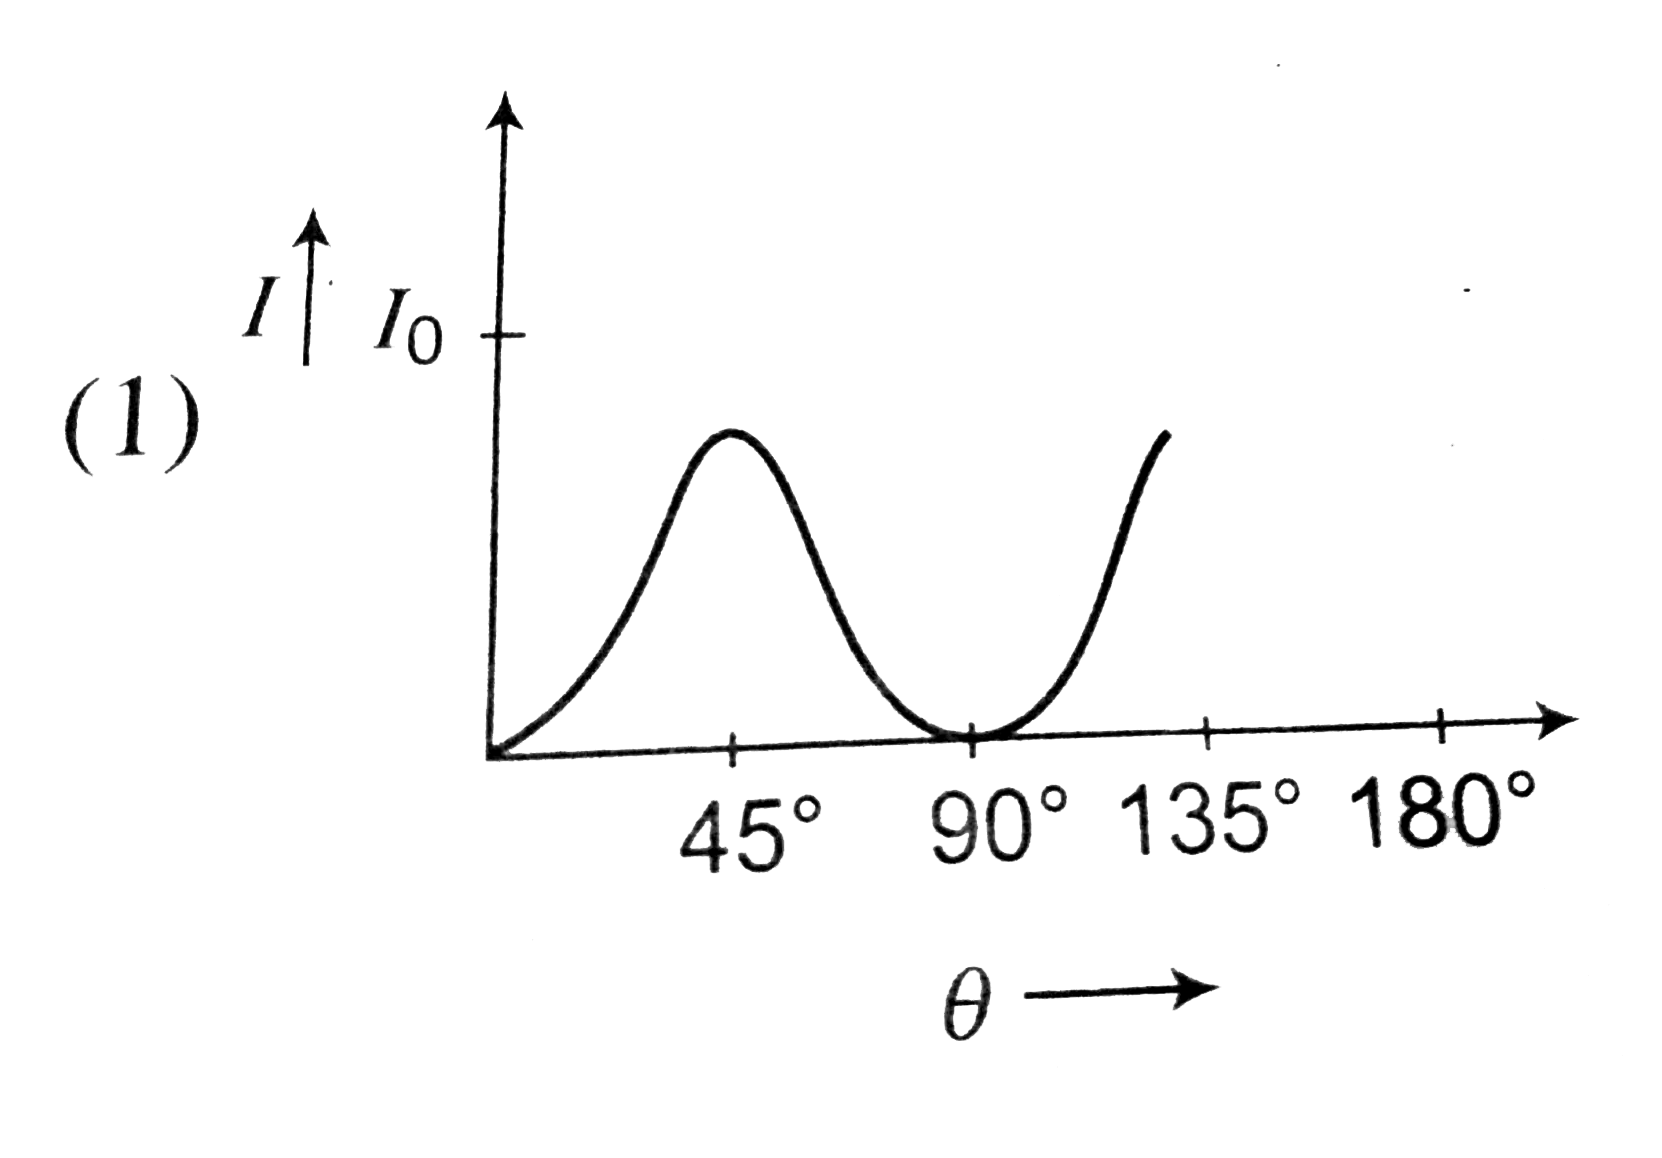 B
B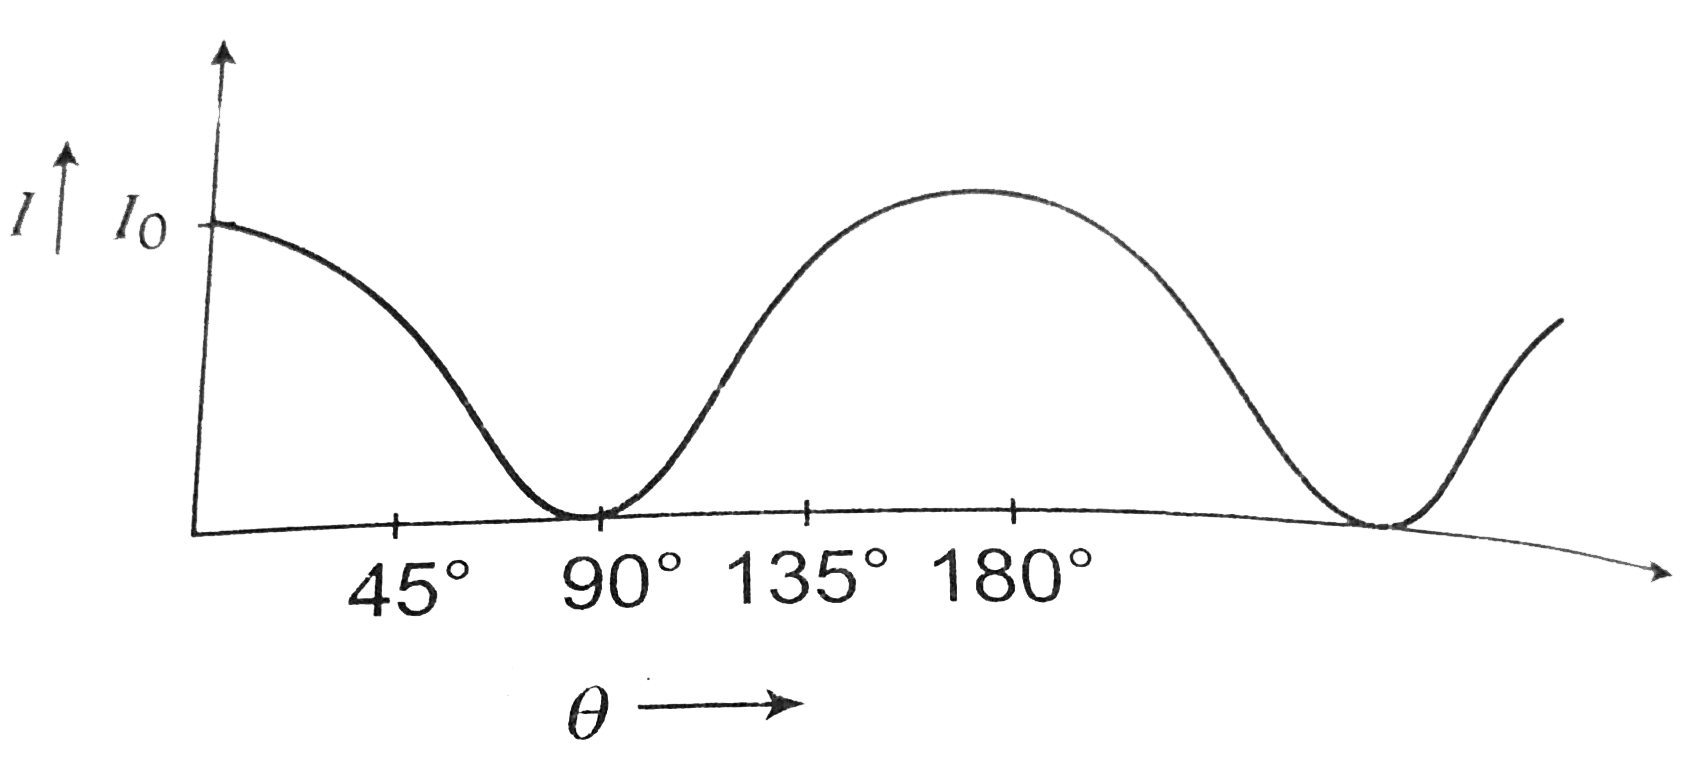 C
C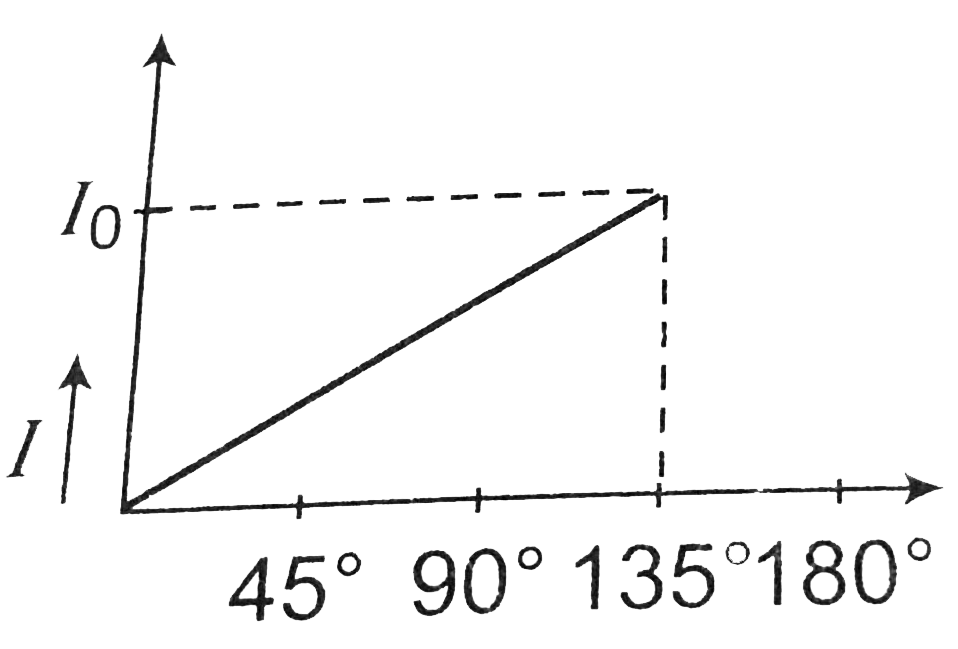 D
D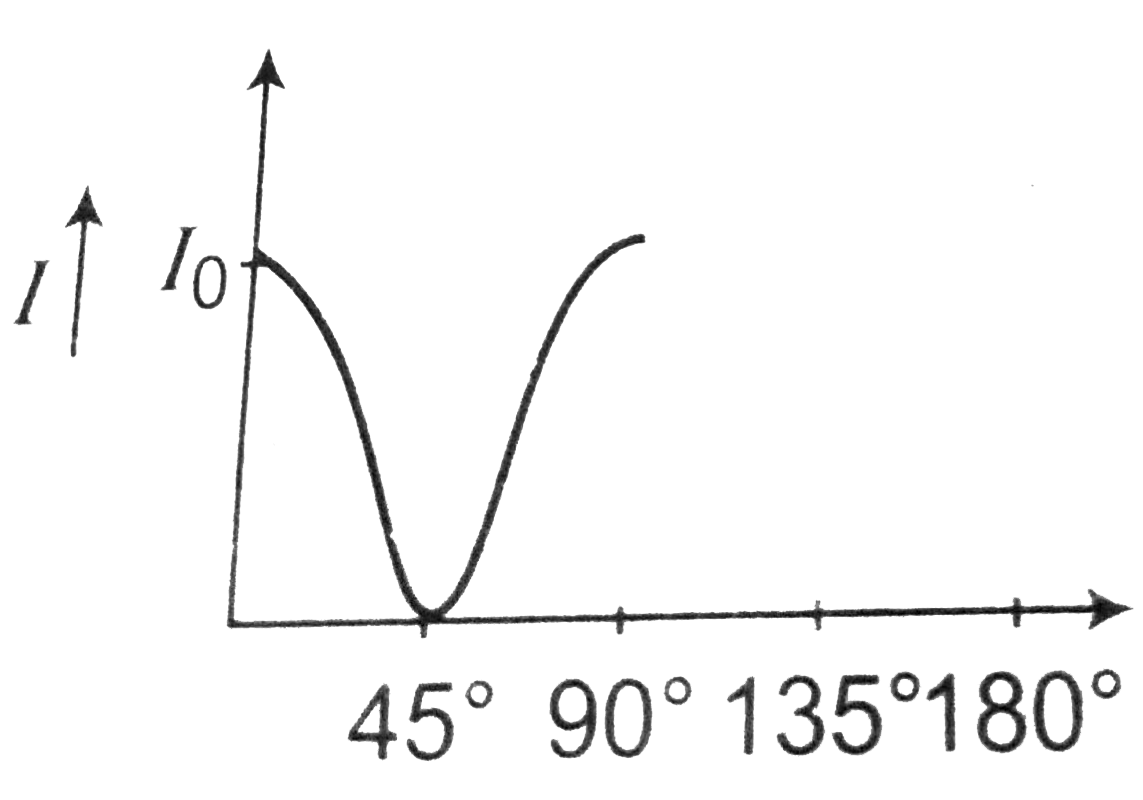
Draw the graph showing the variation of intensity of polarised light transmitted by an analyser.
View Solution(i) State law of Malus.
(ii) Draw a graph showing the variation of intensity (I) of polarised light transmitted by an analyser with angle (θ) between polariser and analyser.
(iii) What is the value of refractive index of a medium of polarising angle 60∘ ?
View Solution(a) State law of Malus.
(b) Draw a graph showing the variation of intensity (I) of polarised light transmitted by an analyser with angle (θ) between polariser and analyser.
(c) What is the value of refractive index of a medium of polarising angle 60∘ ?
View SolutionWhat is plane polarised light ? Two polaroids are placed at 90∘ to each other and the transmitted intensity is zero. What happens when one more polaroid is placed between these two, bisecting the angle between them ? How will the intensity of transmitted light vary on further rotating the third polaroid ?
(b) If a light beam shows no intensity variation when transmitted through a polaroid, which is rotated, does it mean that the light is unpolarised ? Explain briefly.
View SolutionWhat is is plane polarised light ? Two polaroids are placed at 90∘ to each other and the transmitted intensity is zero. What happens when one more polaroid is placed between these two, bisecting the angle betweeen them ? How will the intensity of transmitted light vary on further rotating the third polaroid ?
(b) If a light beam shows no intensity variation when trasmitted through a polaroid which is rotated, does it mean that the light is un-polarised ? Explain briefly.
View Solution(a) When an unpolarised light of intensity I0 is passed through a polaroid, what is the intensity of the linearly polarised light ? Does it depend on the orientation of the polaroid ? Explain your answer.
(b) A plane polarised beam of light is passed through a polaroid. show graphically the variation of the intensity of the transmitted light with angle of rotation of the polaroid in complete one rotation.
View SolutionFind an expression for intensity of transmitted light when a polaroid sheet is rotated between I polaroids. In which position of the polaroid sheet will the transmitted intensity be maximum ?
View Solution
