Draw the graph showing the variation of intensity of polarised light transmitted by an analyser.
The graph showing the variation of intensity of polarised light transmitted by an analyser.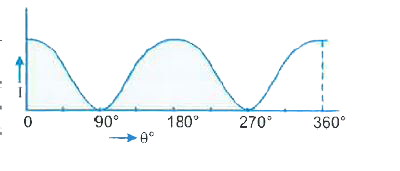
Topper's Solved these Questions
- WAVE OPTICSBOOK - U-LIKE SERIESCHAPTER - WAVE OPTICSEXERCISE - SHORT ANSWER QUESTIONS
29 Videos
- WAVE OPTICSBOOK - U-LIKE SERIESCHAPTER - WAVE OPTICSEXERCISE - LONG ANSWER QUESTIONS-I
31 Videos
- WAVE OPTICSBOOK - U-LIKE SERIESCHAPTER - WAVE OPTICSEXERCISE - ASSERTION-REASON TYPE QUESTIONS
5 Videos
- SEMICONDUCTOR ELECTRONICS : MATERIALS, DEVICES AND SIMPLE CIRCUITSBOOK - U-LIKE SERIESCHAPTER - SEMICONDUCTOR ELECTRONICS : MATERIALS, DEVICES AND SIMPLE CIRCUITSEXERCISE - SECTION B
1 Videos
Similar Questions
(a) State law of Malus.
(b) Draw a graph showing the variation of intensity (I) of polarised light transmitted by an analyser with angle (θ) between polariser and analyser.
(c) What is the value of refractive index of a medium of polarising angle 60∘ ?
View Solution(a) State law of Malus.
(b) Draw a graph showing the variation of intensity (I) of polarised light transmitted by an analyser with angle (θ) between polariser and analyser.
(c) What is the value of refractive index of a medium of polarising angle 60∘ ?
View Solution
Knowledge Check
The graph showing the dependence of intensity of transmitted light on the angle between polariser and analyser is
A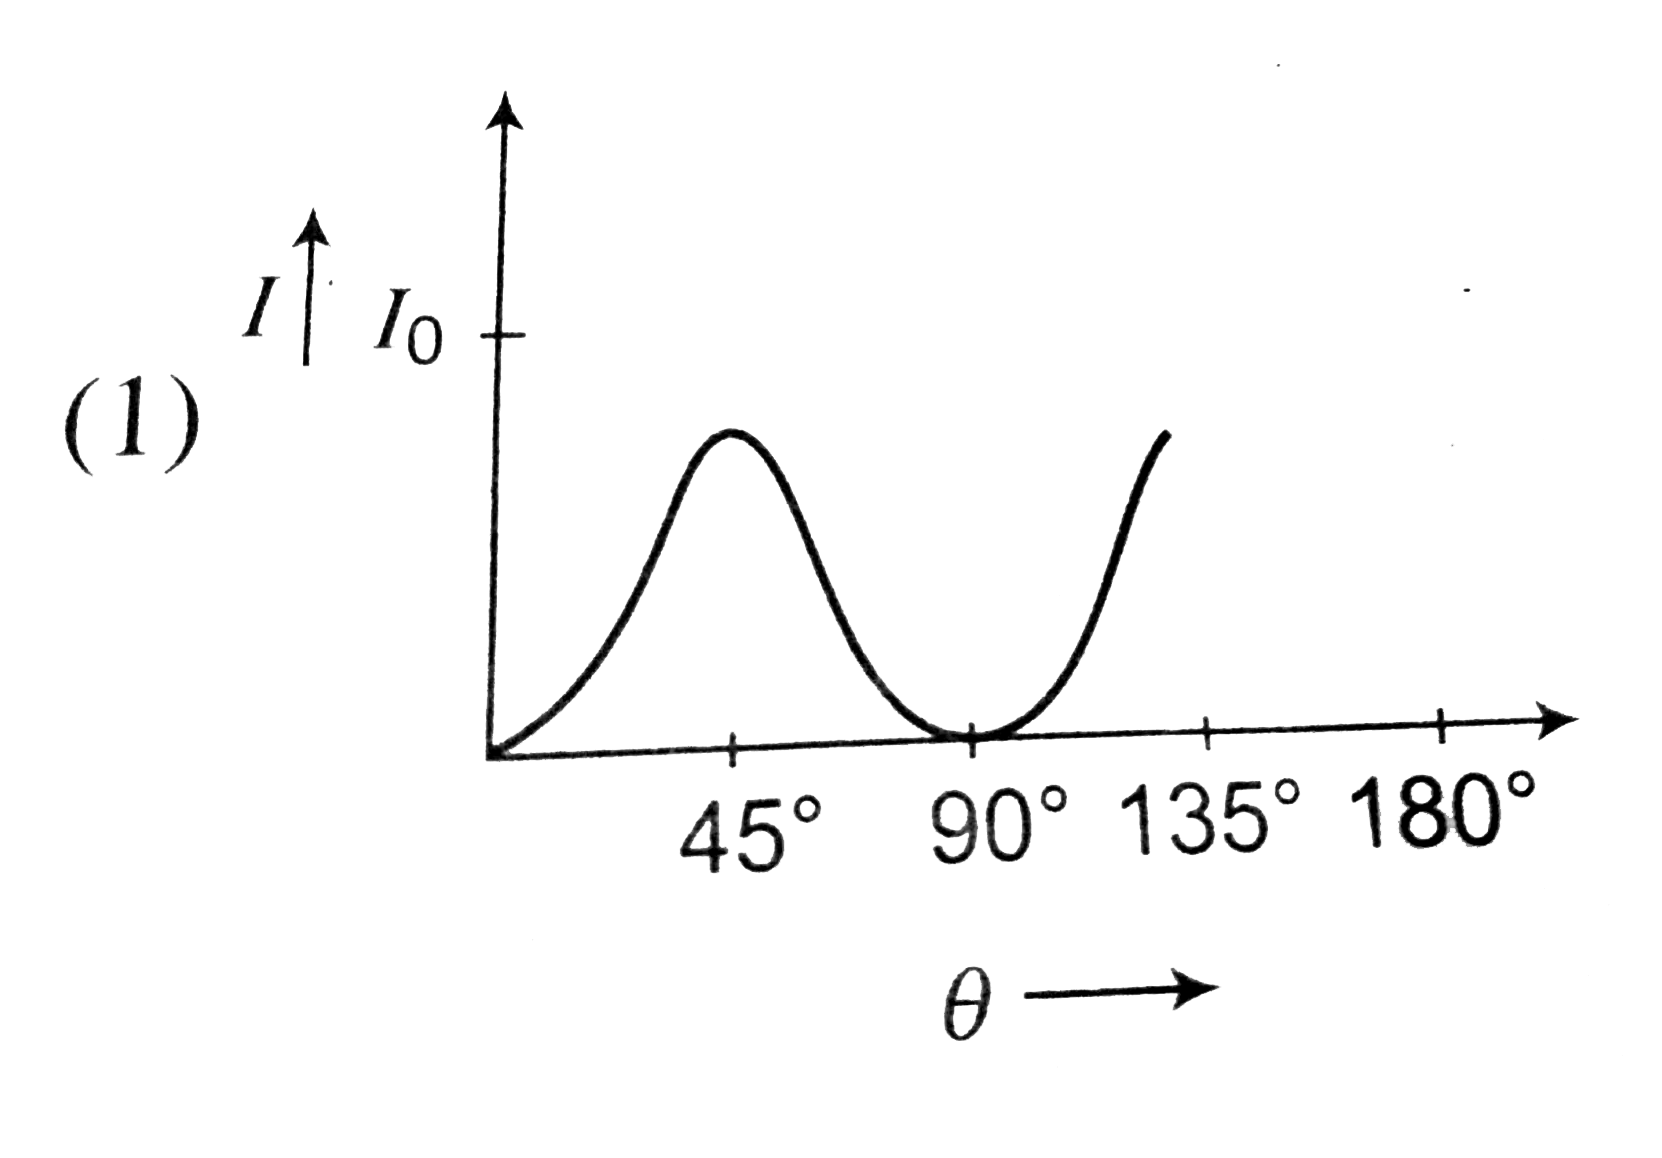 B
B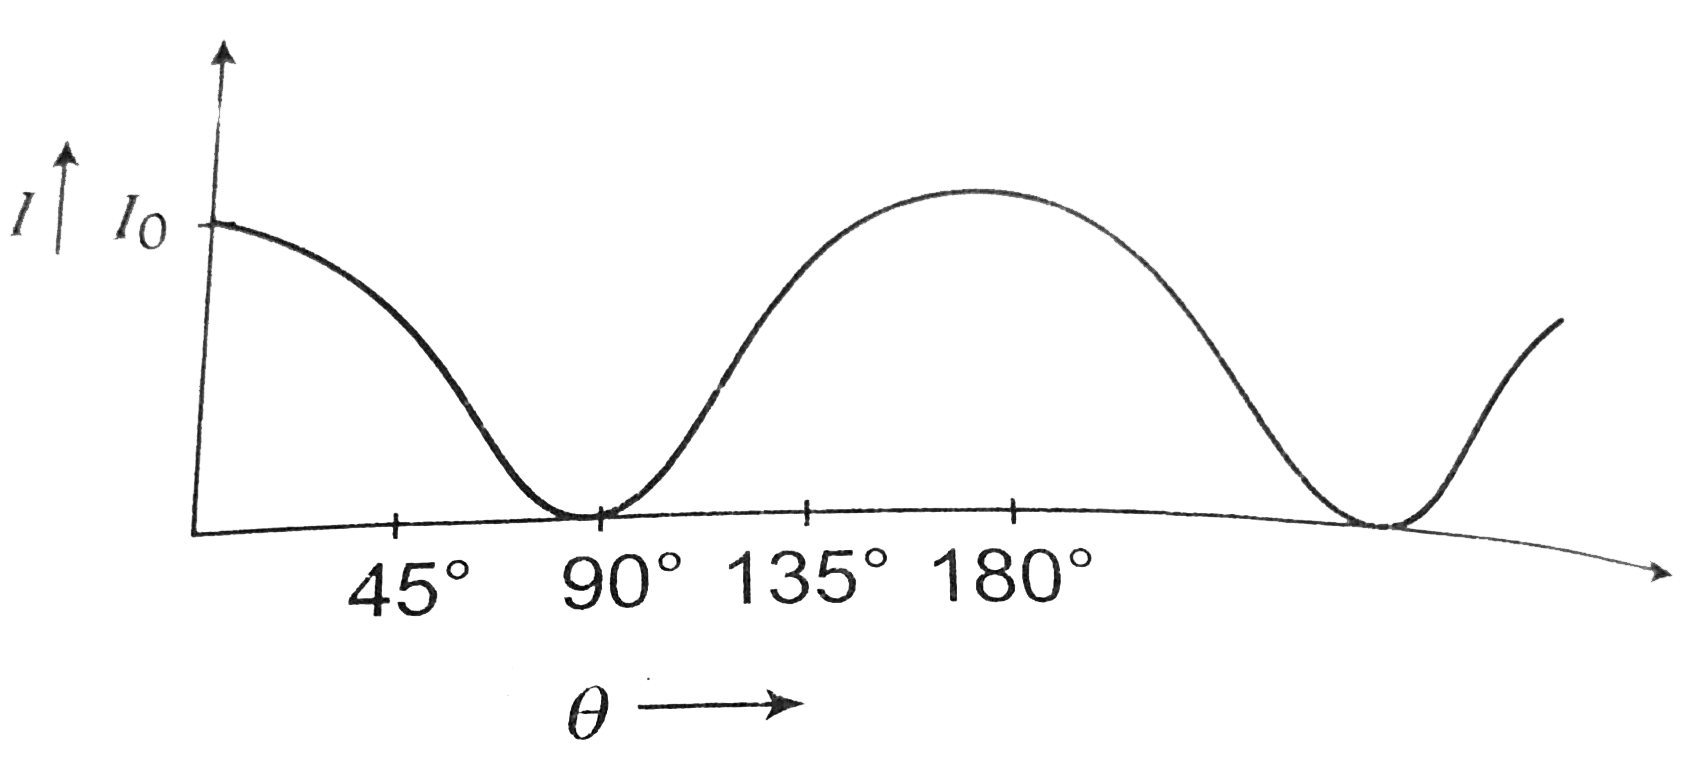 C
C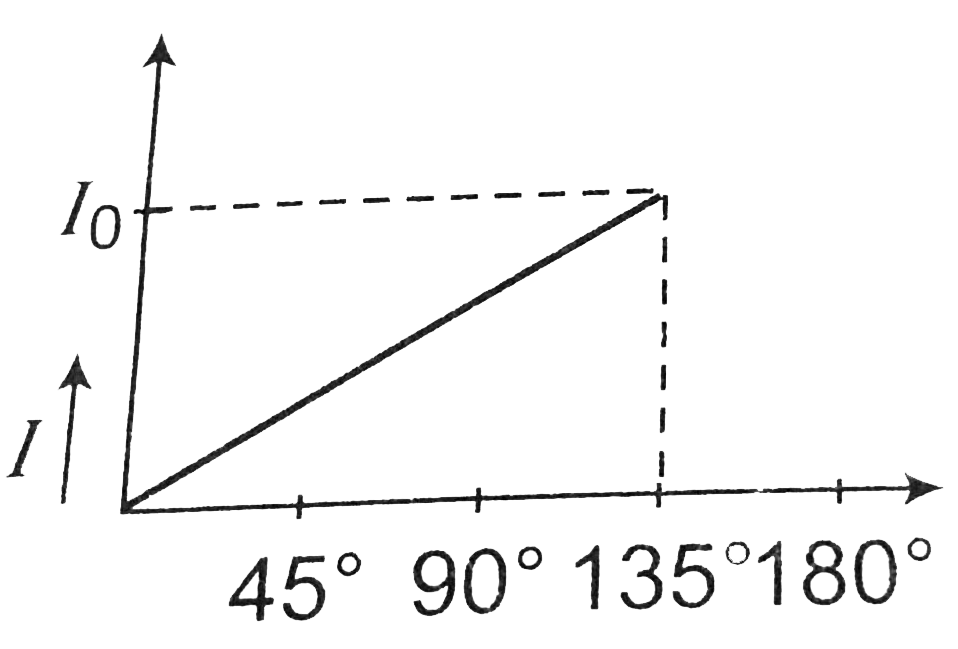 D
D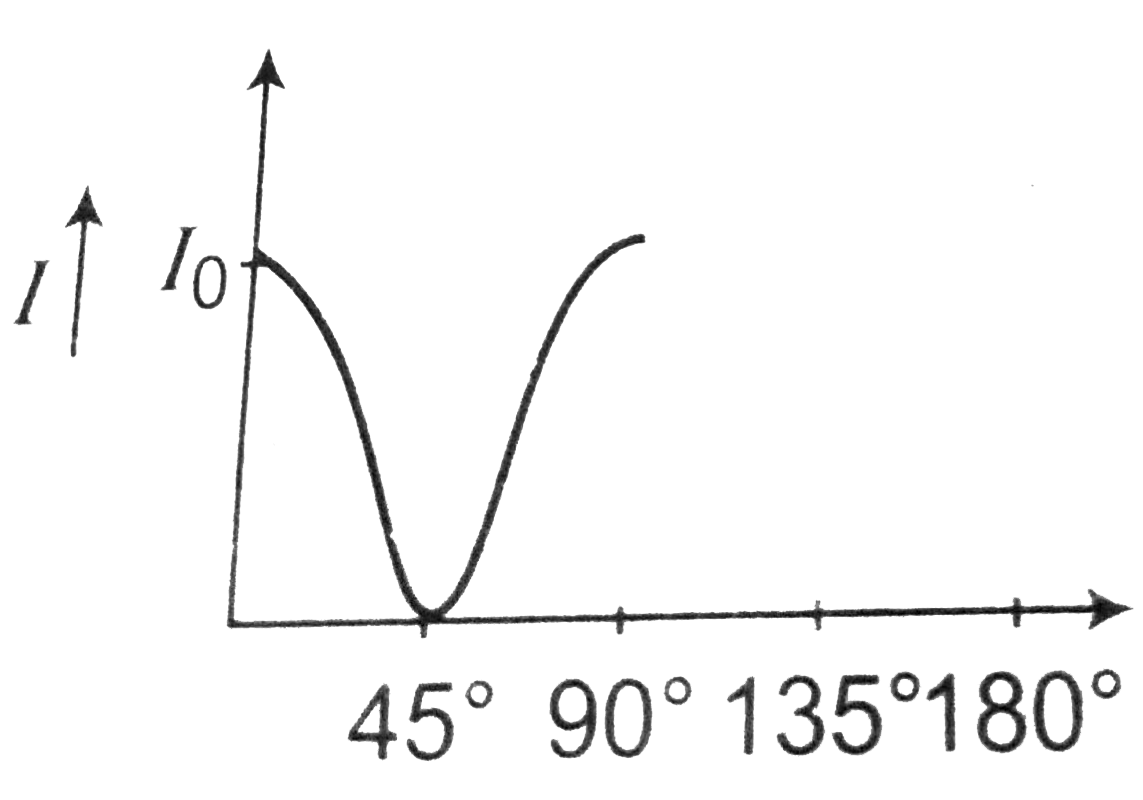
The polariser and analyser are inclined to each other at 60∘. The intensity of polarised light emerging from polariser is I. The intensity of the unpolarised light incident on the polariser is
AI0B34I0C12I0D14I0The graph showing the dependence of intensity transmitted light on the angle between polariser are analyser, is
A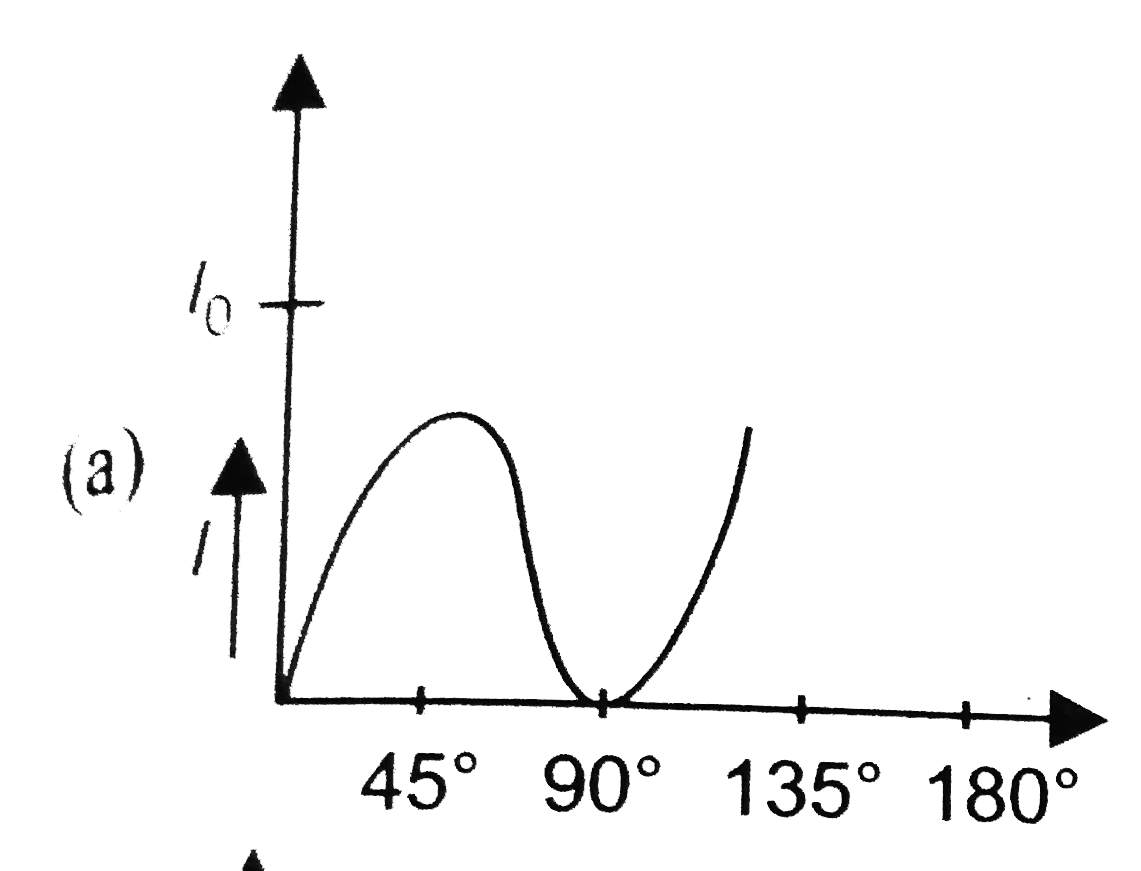 B
B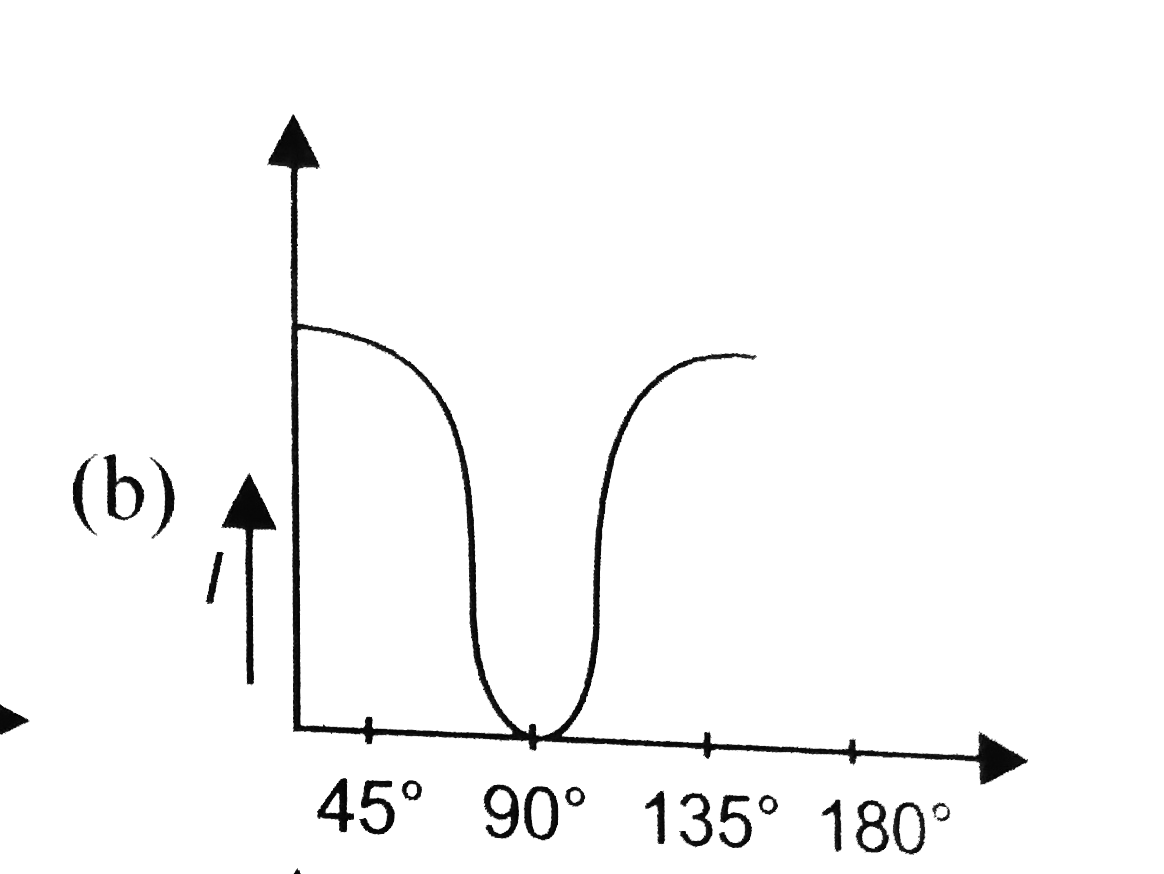 C
C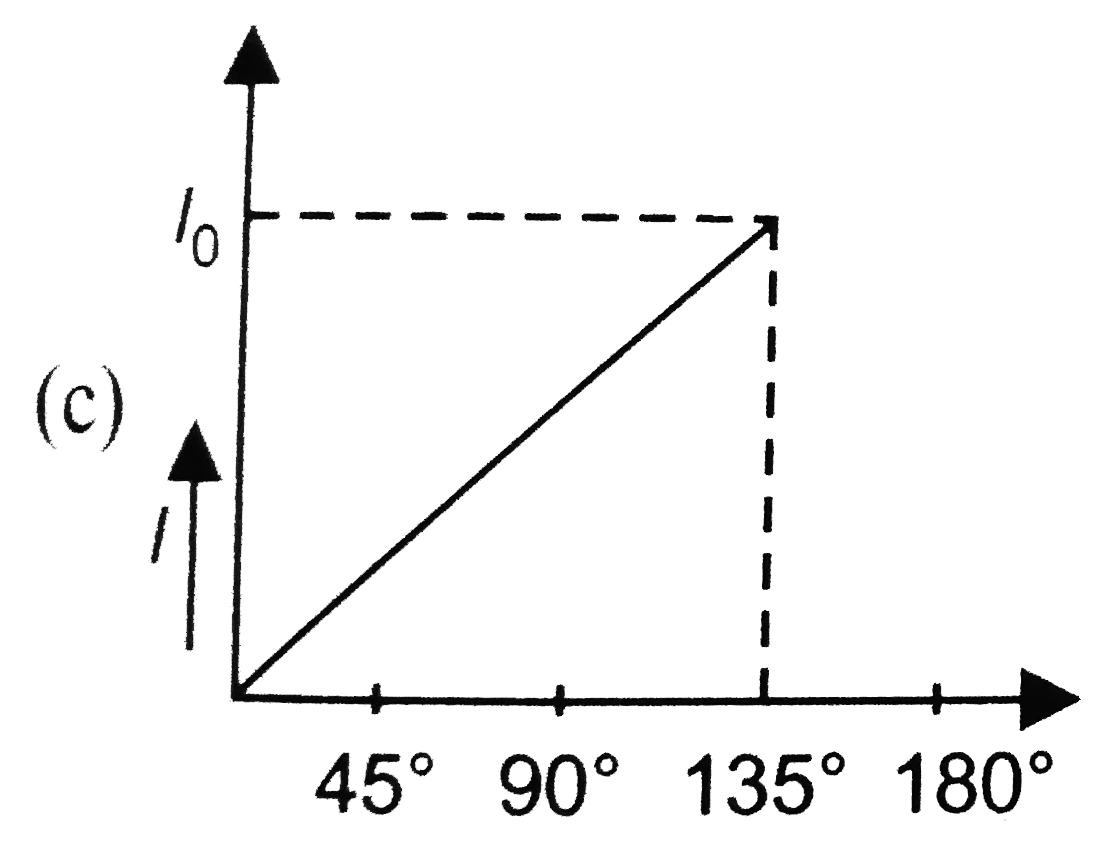 D
D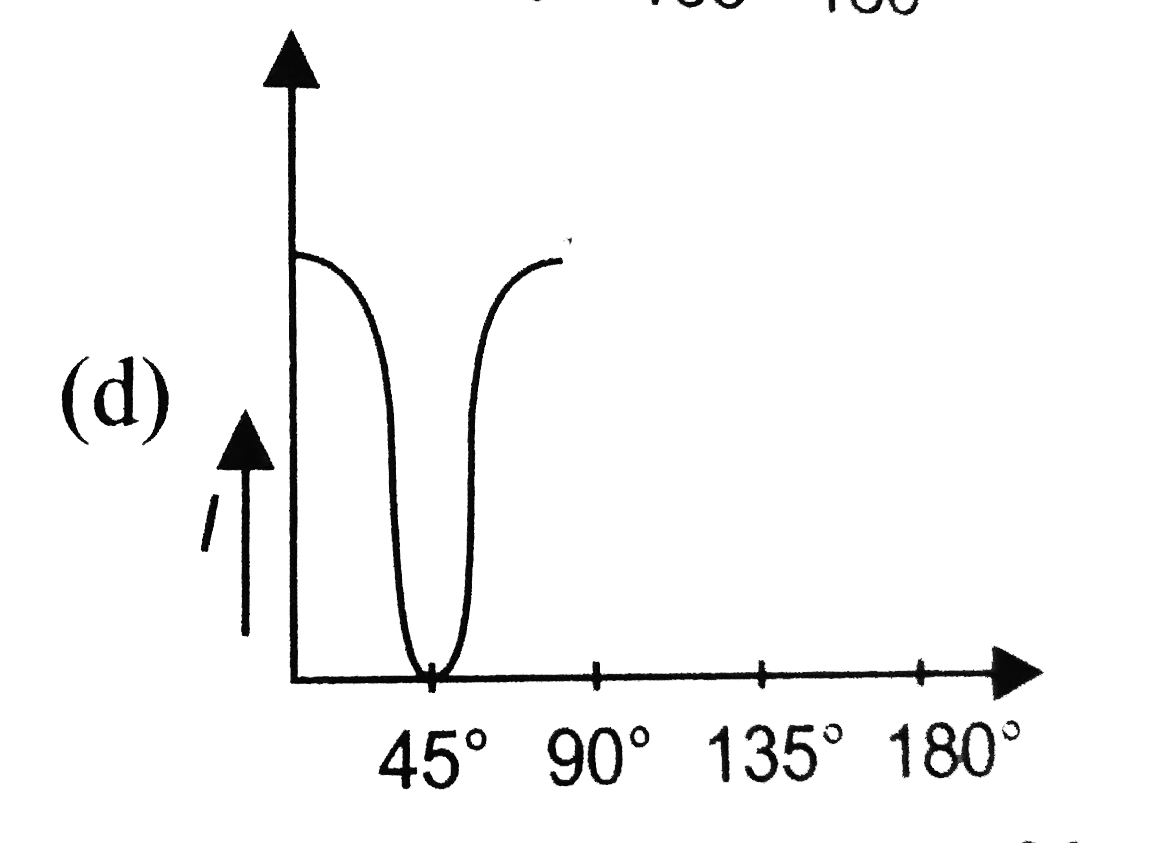
(i) State law of Malus.
(ii) Draw a graph showing the variation of intensity (I) of polarised light transmitted by an analyser with angle (θ) between polariser and analyser.
(iii) What is the value of refractive index of a medium of polarising angle 60∘ ?
View SolutionThe angle between polariser and analyser is 30∘. The ratio of intensity of incident light and transmitted by the analyser is
View SolutionName one device for producing polarized light. Draw a graph showing the dependence of intensity of transmitted light on the angle between polarizer and analyser.
View SolutionDraw a labelled graph to show variation in intensity of diffracted light with angular position, in a single slit diffraction experiment.
View SolutionDraw a graph that shows the dependence of intensity of transmitted light on the angie between Polariser and analyser.
View Solution
