Draw a graph that shows the dependence of intensity of transmitted light on the angie between Polariser and analyser.
To solve the problem of drawing a graph that shows the dependence of the intensity of transmitted light on the angle between the polarizer and analyzer, we can follow these steps:
1. Understand the Setup:
- We have a polarizer and an analyzer. The polarizer allows light to pass through in a specific direction, while the analyzer can further filter this light based on its orientation.
2. Define Variables:
- Let I0 be the initial intensity of the light before it passes through the polarizer.
- Let I1 be the intensity of light after passing through the polarizer. According to Malus's Law, I1=I02 (assuming the polarizer reduces the intensity by half).
3. Apply Malus's Law:
- When the light passes through the analyzer, the transmitted intensity I can be expressed as:
I=I1cos2θ=I02cos2θ
- Here, θ is the angle between the polarizer and the analyzer.
4. Analyze the Function:
- The intensity I varies with θ from 0° to 180°.
- At θ=0°, I=I02.
- At θ=90°, I=0.
- At θ=180°, I=I02 again, since cos2180°=1.
5. Graph the Function:
- On the x-axis, plot the angle θ ranging from 0° to 180°.
- On the y-axis, plot the intensity I.
- The curve will start at I02 when θ=0°, decrease to 0 at θ=90°, and then return to I02 at θ=180°.
6. Label the Graph:
- Label the axes appropriately: the x-axis as "Angle (θ)" and the y-axis as "Intensity (I)".
- Mark the points where the intensity is maximum, minimum, and returns to maximum.
Final Graph:
The graph will show a cosine squared relationship, starting from I02, dropping to 0 at 90°, and returning to I02 at 180°.
- We have a polarizer and an analyzer. The polarizer allows light to pass through in a specific direction, while the analyzer can further filter this light based on its orientation.
- Let I0 be the initial intensity of the light before it passes through the polarizer.
- Let I1 be the intensity of light after passing through the polarizer. According to Malus's Law, I1=I02 (assuming the polarizer reduces the intensity by half).
- When the light passes through the analyzer, the transmitted intensity I can be expressed as:
I=I1cos2θ=I02cos2θ
- Here, θ is the angle between the polarizer and the analyzer.
- The intensity I varies with θ from 0° to 180°.
- At θ=0°, I=I02.
- At θ=90°, I=0.
- At θ=180°, I=I02 again, since cos2180°=1.
- On the x-axis, plot the angle θ ranging from 0° to 180°.
- On the y-axis, plot the intensity I.
- The curve will start at I02 when θ=0°, decrease to 0 at θ=90°, and then return to I02 at θ=180°.
- Label the axes appropriately: the x-axis as "Angle (θ)" and the y-axis as "Intensity (I)".
- Mark the points where the intensity is maximum, minimum, and returns to maximum.
The graph will show a cosine squared relationship, starting from I02, dropping to 0 at 90°, and returning to I02 at 180°.
Topper's Solved these Questions
- ELECTROMAGNETIC WAVE & WAVE OPTICSBOOK - FIITJEECHAPTER - ELECTROMAGNETIC WAVE & WAVE OPTICSEXERCISE - SOLVED PROBLEMS Objective: Level-I
10 Videos
- ELECTROMAGNETIC WAVE & WAVE OPTICSBOOK - FIITJEECHAPTER - ELECTROMAGNETIC WAVE & WAVE OPTICSEXERCISE - SOLVED PROBLEMS Objective: Level-II
10 Videos
- ELECTROMAGNETIC WAVE & WAVE OPTICSBOOK - FIITJEECHAPTER - ELECTROMAGNETIC WAVE & WAVE OPTICSEXERCISE - ASSIGNMENT PROBLEMS Objective : Level-II (MULTI CHOICE SINGLE CORRECT)
21 Videos
- ELECTROMAGNETIC INDUCTION AND AC CURRENTBOOK - FIITJEECHAPTER - ELECTROMAGNETIC INDUCTION AND AC CURRENTEXERCISE - Example
15 Videos
- ELECTROSTANTICSBOOK - FIITJEECHAPTER - ELECTROSTANTICSEXERCISE - MATRIX MATCH TYPE
1 Videos
Similar Questions
Name one device for producing polarized light. Draw a graph showing the dependence of intensity of transmitted light on the angle between polarizer and analyser.
View Solution(a) State law of Malus.
(b) Draw a graph showing the variation of intensity (I) of polarised light transmitted by an analyser with angle (θ) between polariser and analyser.
(c) What is the value of refractive index of a medium of polarising angle 60∘ ?
View Solution
Knowledge Check
The graph showing the dependence of intensity of transmitted light on the angle between polariser and analyser is
A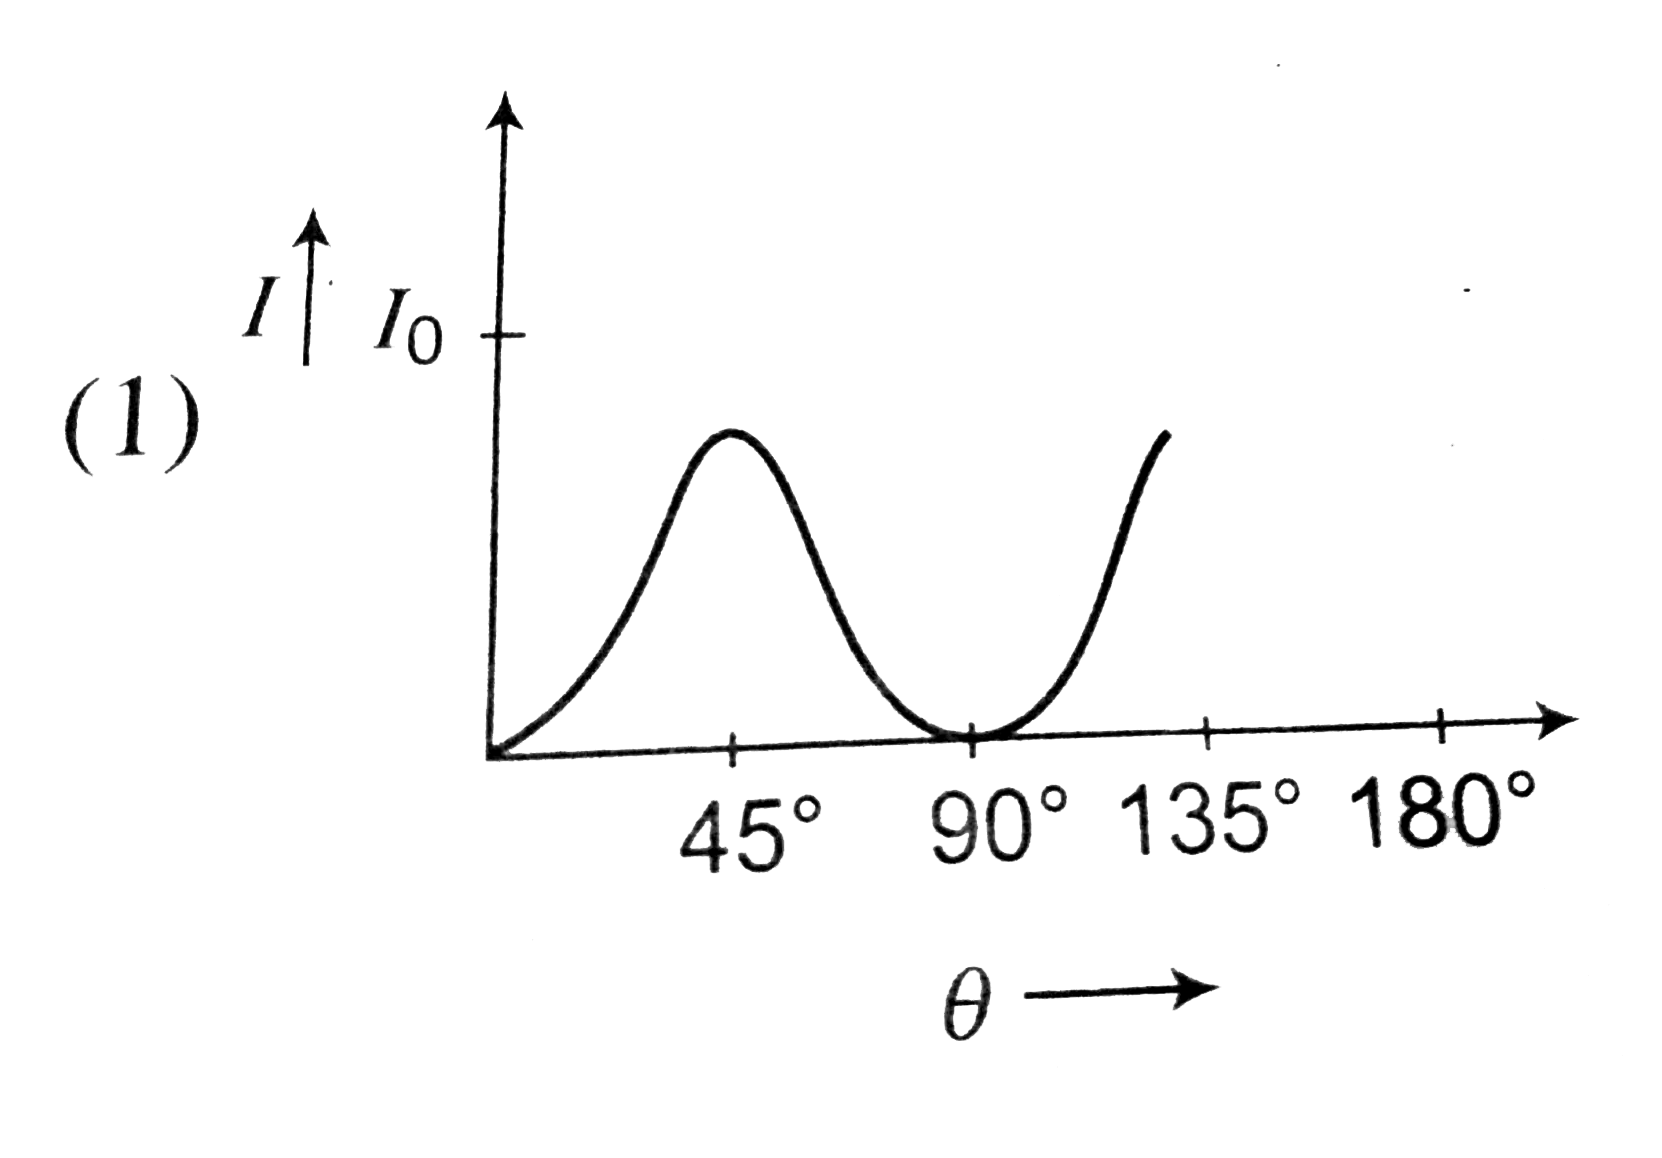 B
B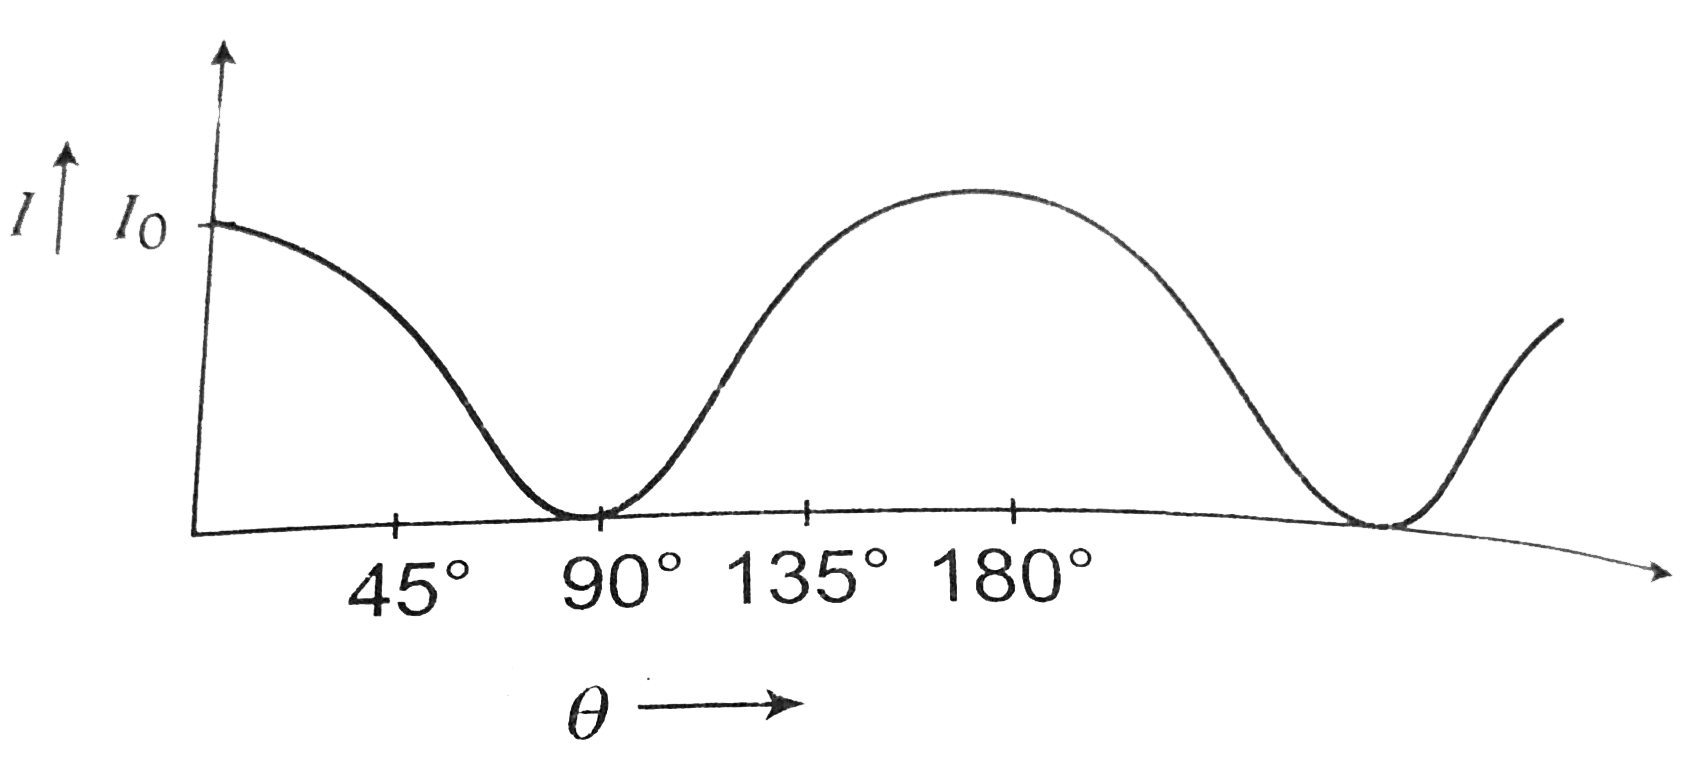 C
C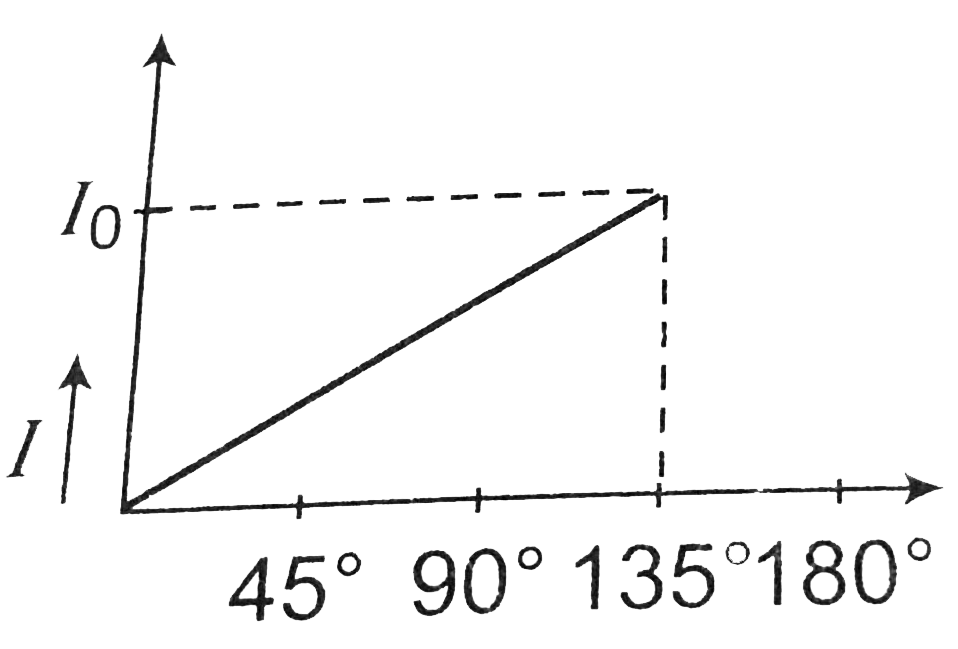 D
D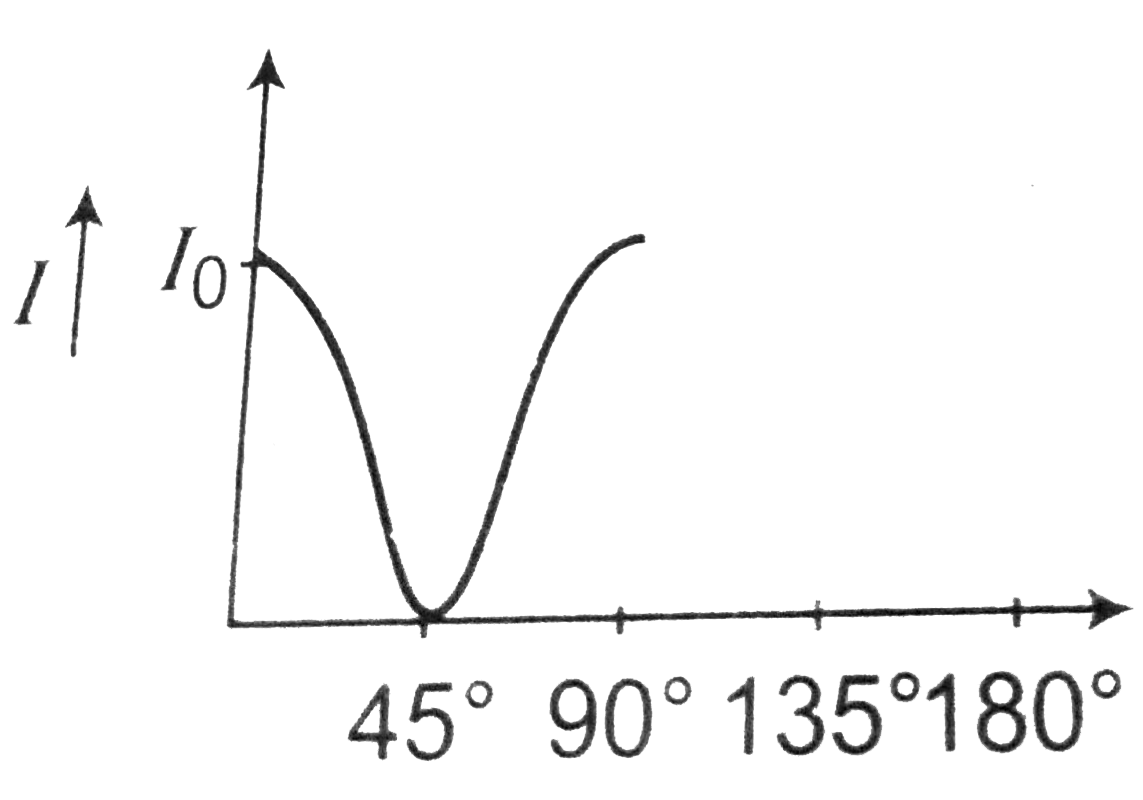
The graph showing the dependence of intensity transmitted light on the angle between polariser are analyser, is
A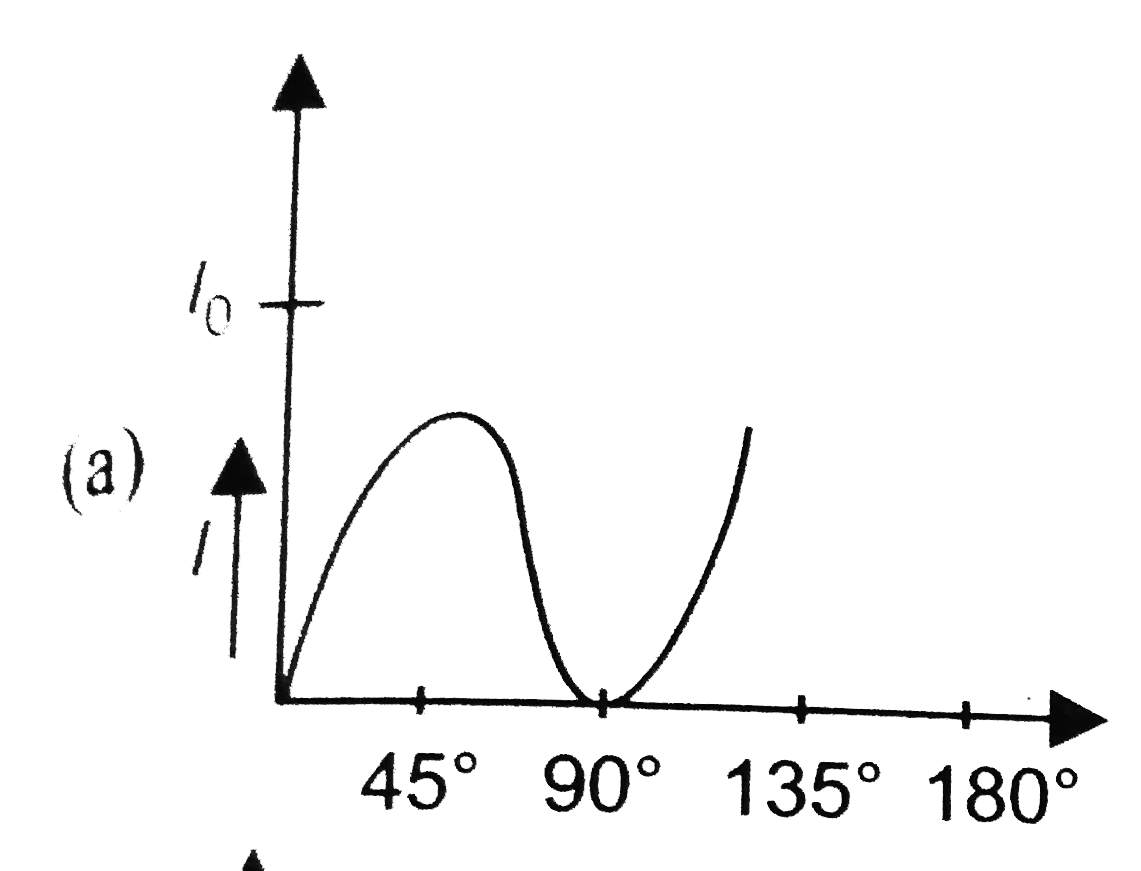 B
B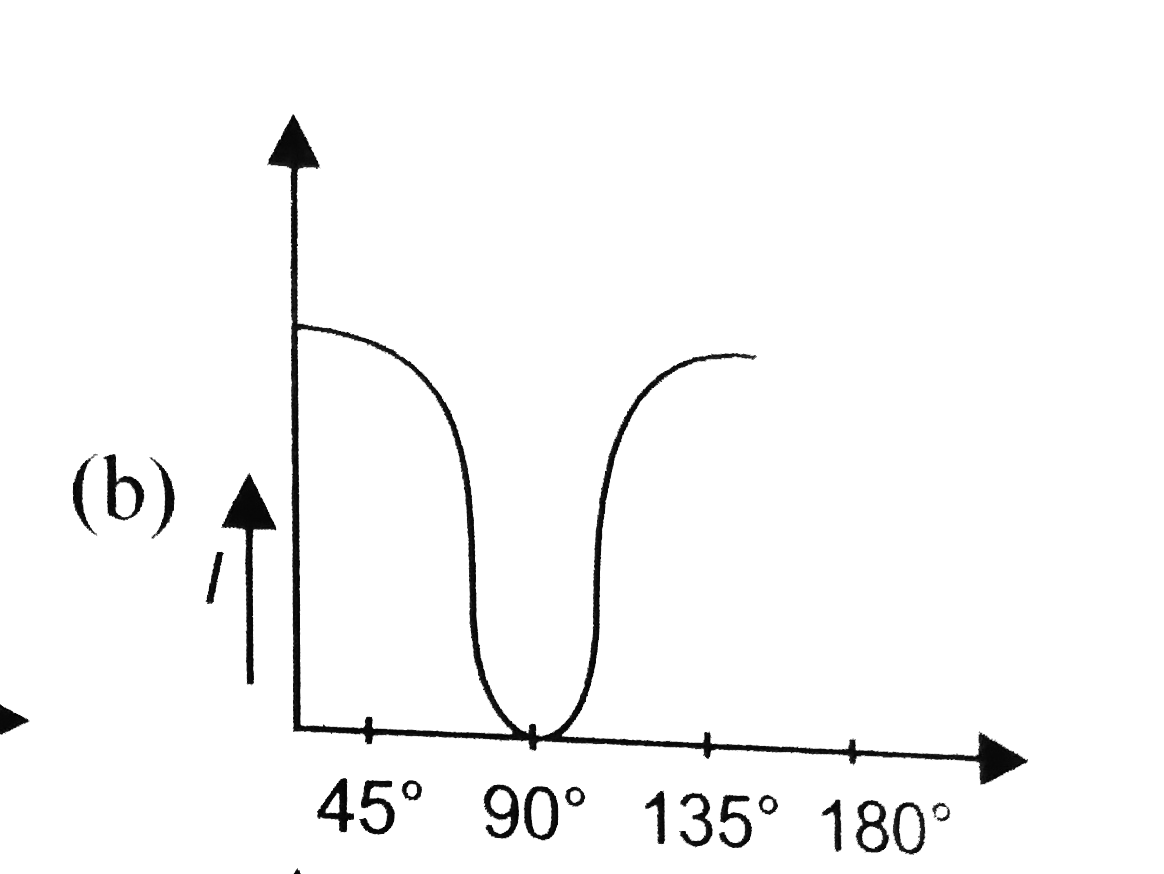 C
C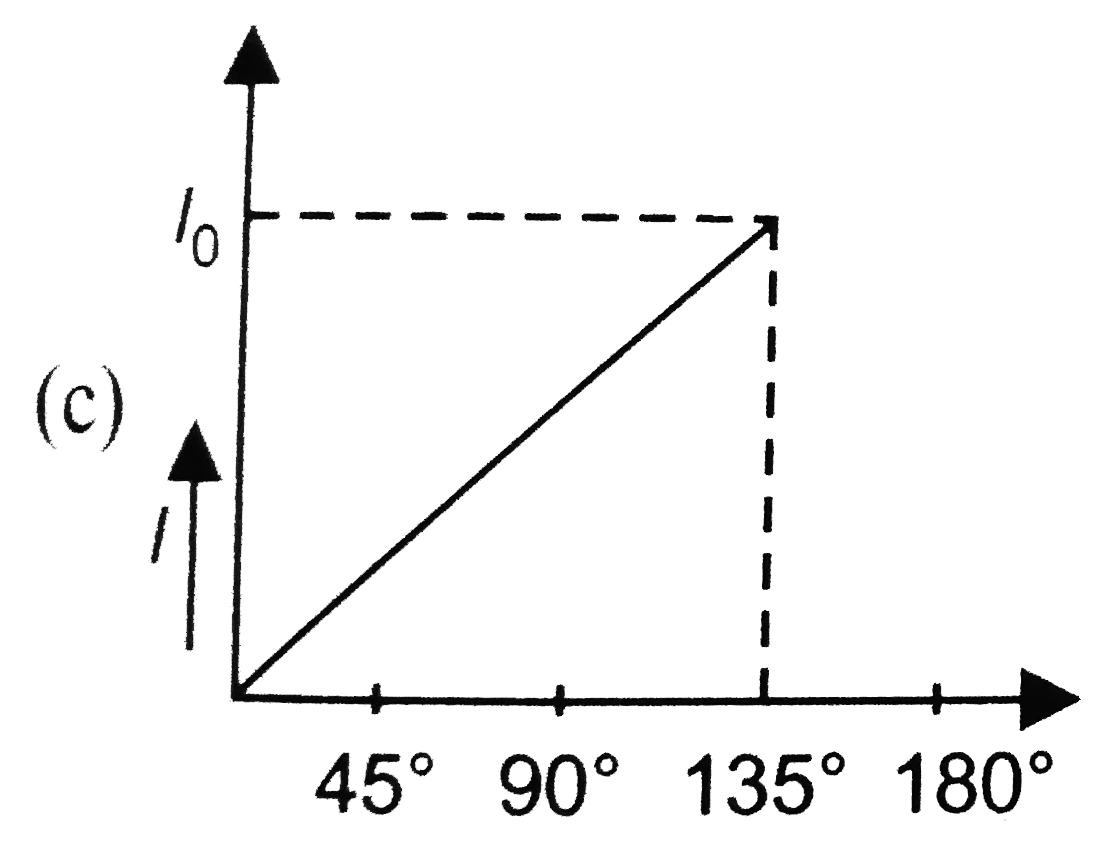 D
D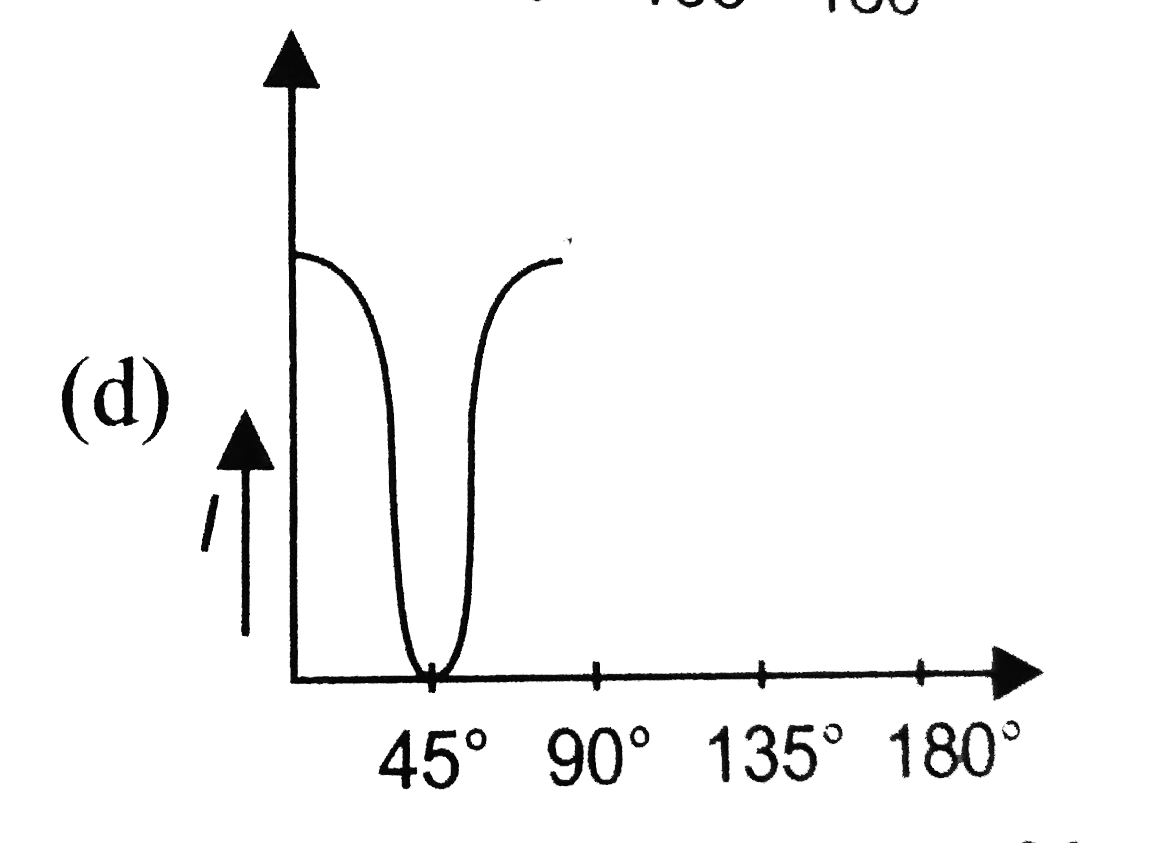
Intensity of light depends upon
AVelocityBWavelengthCAmplitudeDFrequency
(i) State law of Malus.
(ii) Draw a graph showing the variation of intensity (I) of polarised light transmitted by an analyser with angle (θ) between polariser and analyser.
(iii) What is the value of refractive index of a medium of polarising angle 60∘ ?
View SolutionDraw the graph showing the variation of intensity of polarised light transmitted by an analyser.
View SolutionDisuss the intensity of transmitted light when a polaroid sheet is rotated between two crossed polaroids ?
View SolutionDefine the term 'linearly polarised light'.
When does the intensity of transmitted light become maximum, when a polaroid sheet is rotated between two crossed polaroids ?
View Solution(a) When an unpolarised light of intensity I0 is passed through a polaroid, what is the intensity of the linearly polarised light ? Does it depend on the orientation of the polaroid ? Explain your answer.
(b) A plane polarised beam of light is passed through a polaroid. show graphically the variation of the intensity of the transmitted light with angle of rotation of the polaroid in complete one rotation.
View Solution
