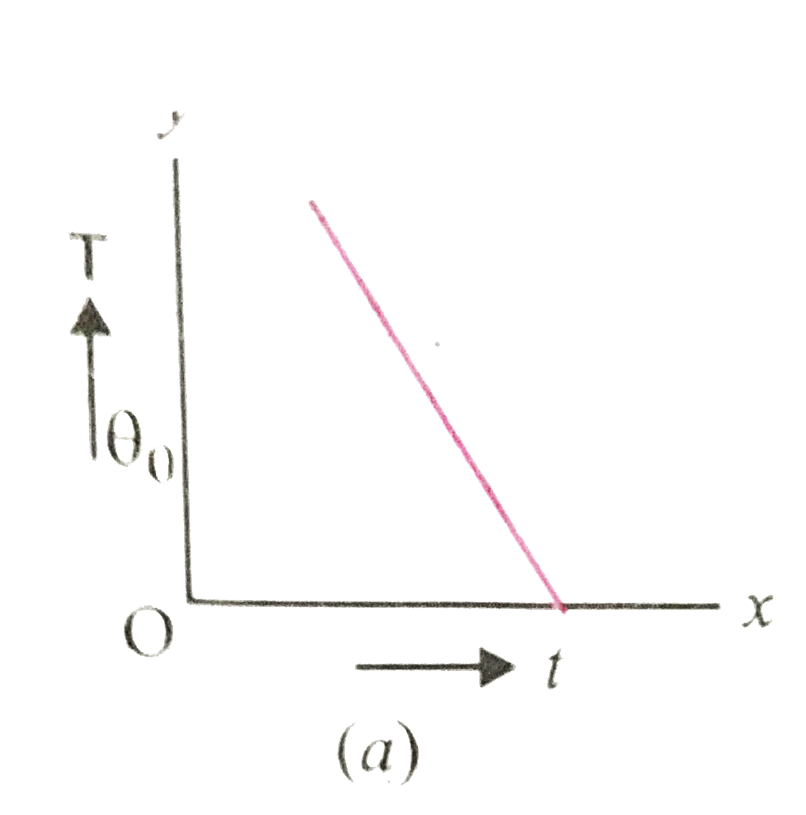
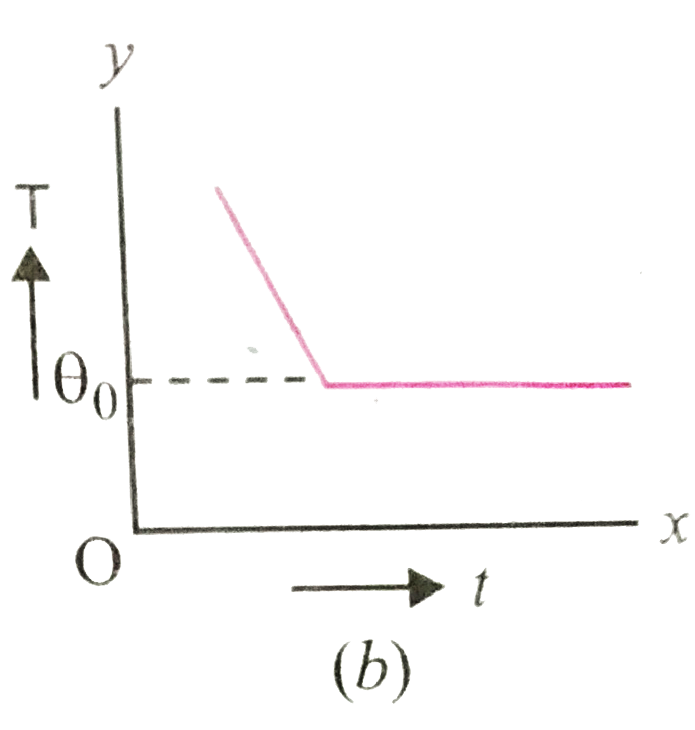
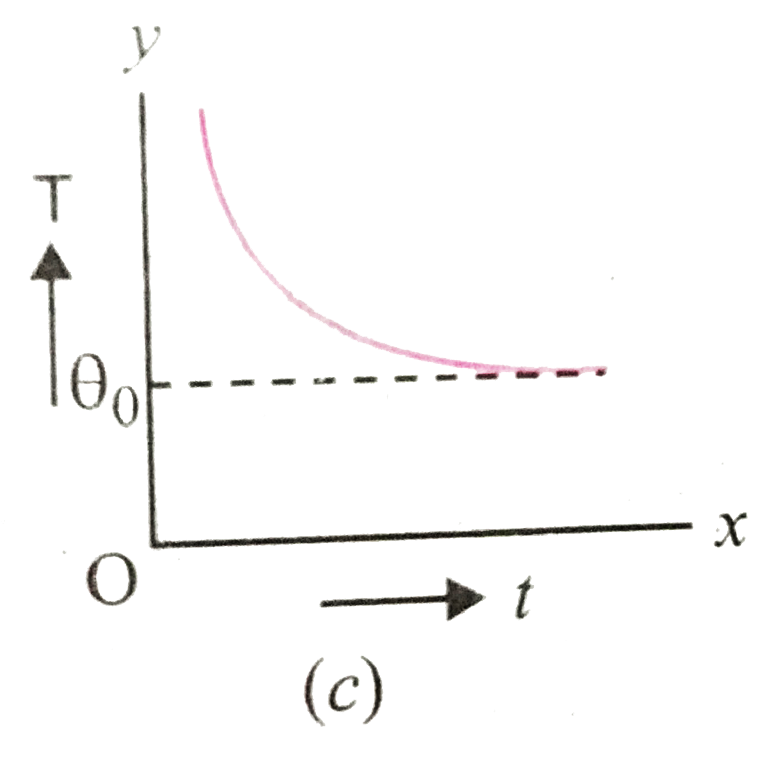
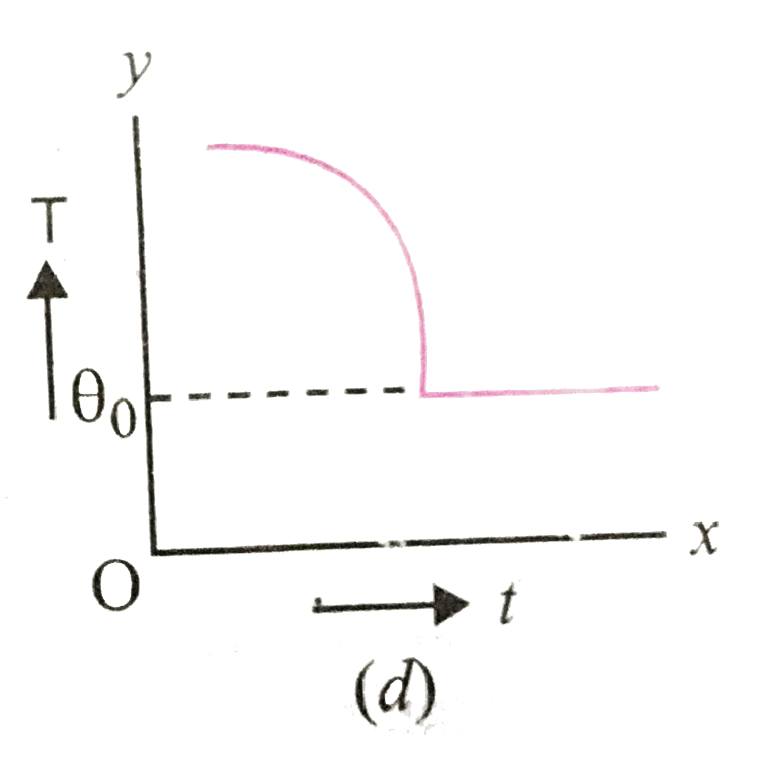
If a piece of metal is heated to temperature θ and the allowed to cool in a room which is at temperature θ0, the graph between the temperature T of the metal and time t will be closet to
The correct Answer is:C
Using Newton's Law of cooling, we find that the correct choice is graph (c).
Topper's Solved these Questions
- BOOK - PRADEEPCHAPTER - PROPERTIES OF BULK MATTEREXERCISE - Integer Type Questions12videos
PROPERTIES OF BULK MATTER
- BOOK - PRADEEPCHAPTER - PROPERTIES OF BULK MATTEREXERCISE - Asseration - Reason Type Question18videos
PROPERTIES OF BULK MATTER
- BOOK - PRADEEPCHAPTER - PROPERTIES OF BULK MATTEREXERCISE - Multiple choice questions-II14videos
PROPERTIES OF BULK MATTER
- BOOK - PRADEEPCHAPTER - PHYSICAL WORLD AND MEASUREMENTEXERCISE - Competiton Focus Jee Medical Entrance18videos
PHYSICAL WORLD AND MEASUREMENT
- BOOK - PRADEEPCHAPTER - RAY OPTICSEXERCISE - Problem For Practice(a)25videos
RAY OPTICS
Similar Questions
A sphere of radius r, density,ρ and specific heat s is heated to temperature θ and then cooled in an enclosure at temperature θ0 . How , the rate of fall of temperature is related with r, ρ and s?
View SolutionA piece of glass is heated to high temperature and then allowed to cool .If it cracks ,a possible reason for this is the following property of glass
View Solution
Knowledge Check
- Question 1 - Select One
Which metal is a liquid at room temperature ?
AHgBKCNaDTi - Question 2 - Select One
Which metal is a liquid at room temperature?
AAluminiumBMercuryCCopperDBrass - Question 3 - Select One
The graph between the (velocity)2 and temperature T of a gas is
A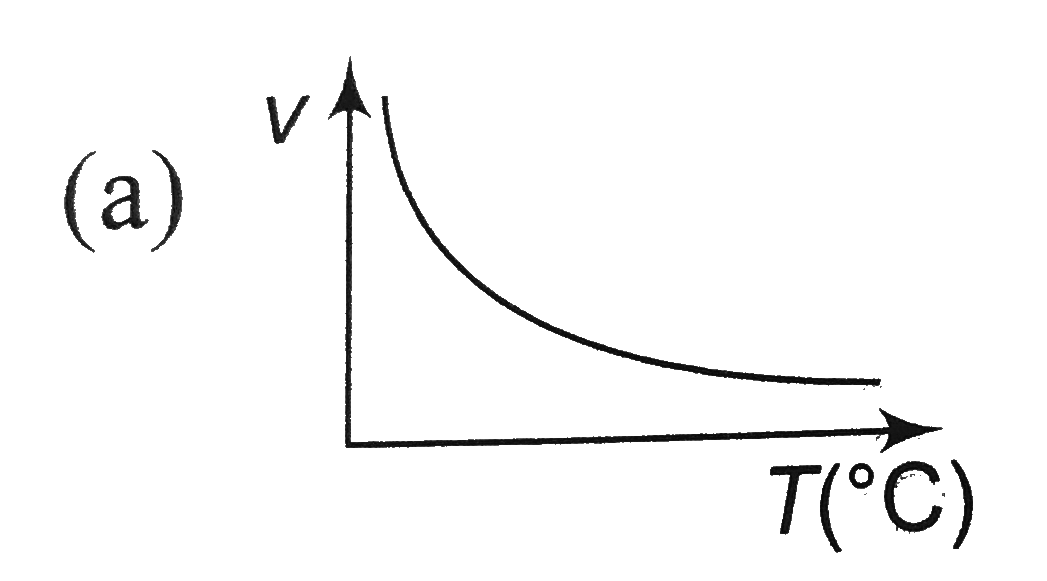 B
B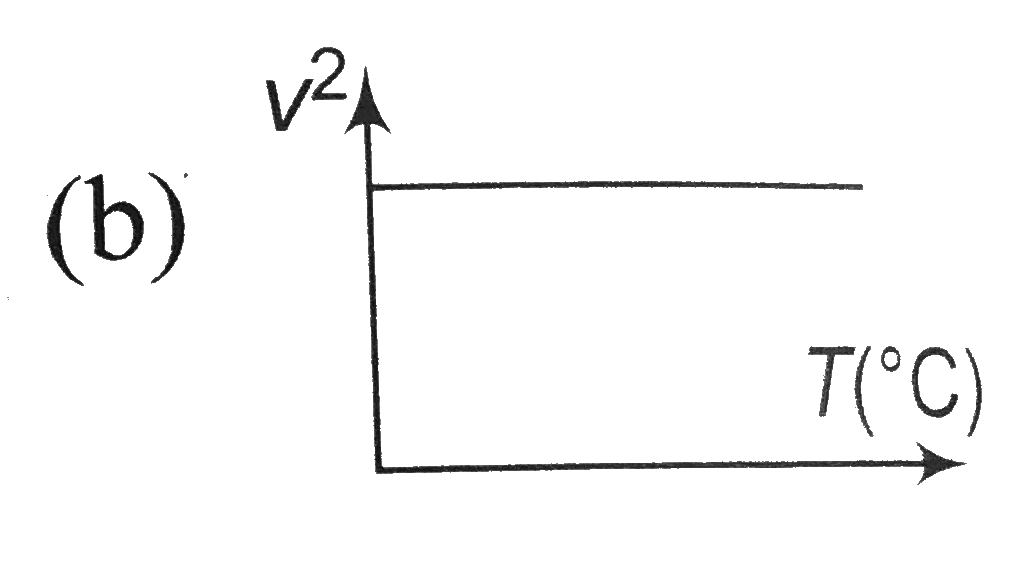 C
C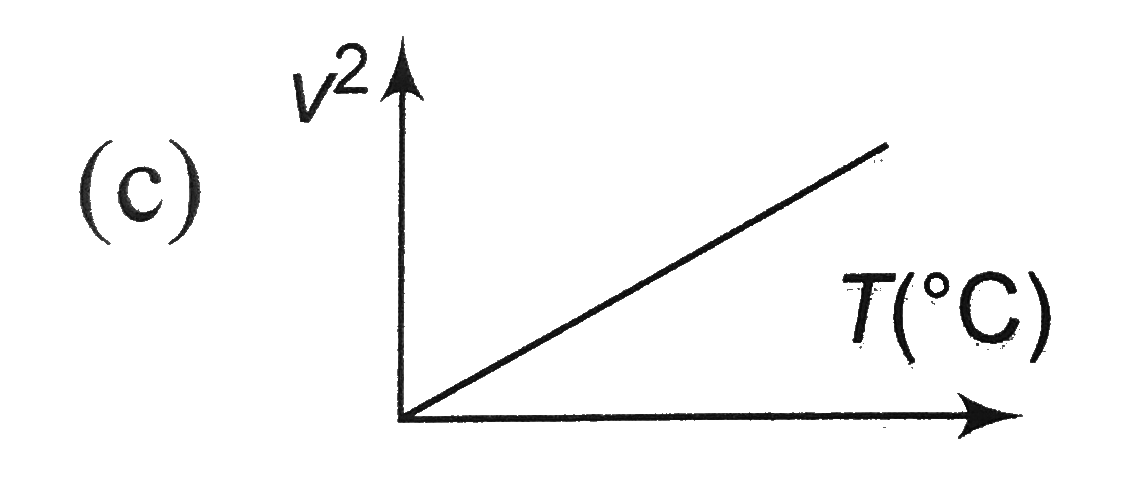 D
D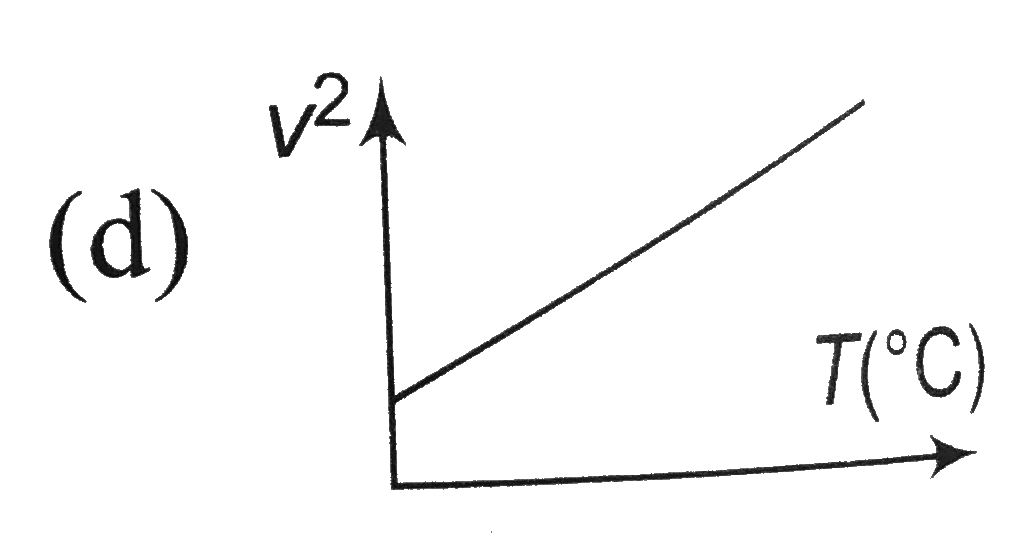
A piece of glass is heated to a high temperature and then allowed to cool. If it cracks, a probable reason for this is the following property of glass
View SolutionName a metal which is liquid at room temperature.
View SolutionA very thin metallic shell of radius r is heated to temperature T and then allowed to cool. The rate of cooling of shell is proportional to
View SolutionA non-metal which is gas at room temperature
View SolutionThe graph between surface tension and temperature T is
View Solution

