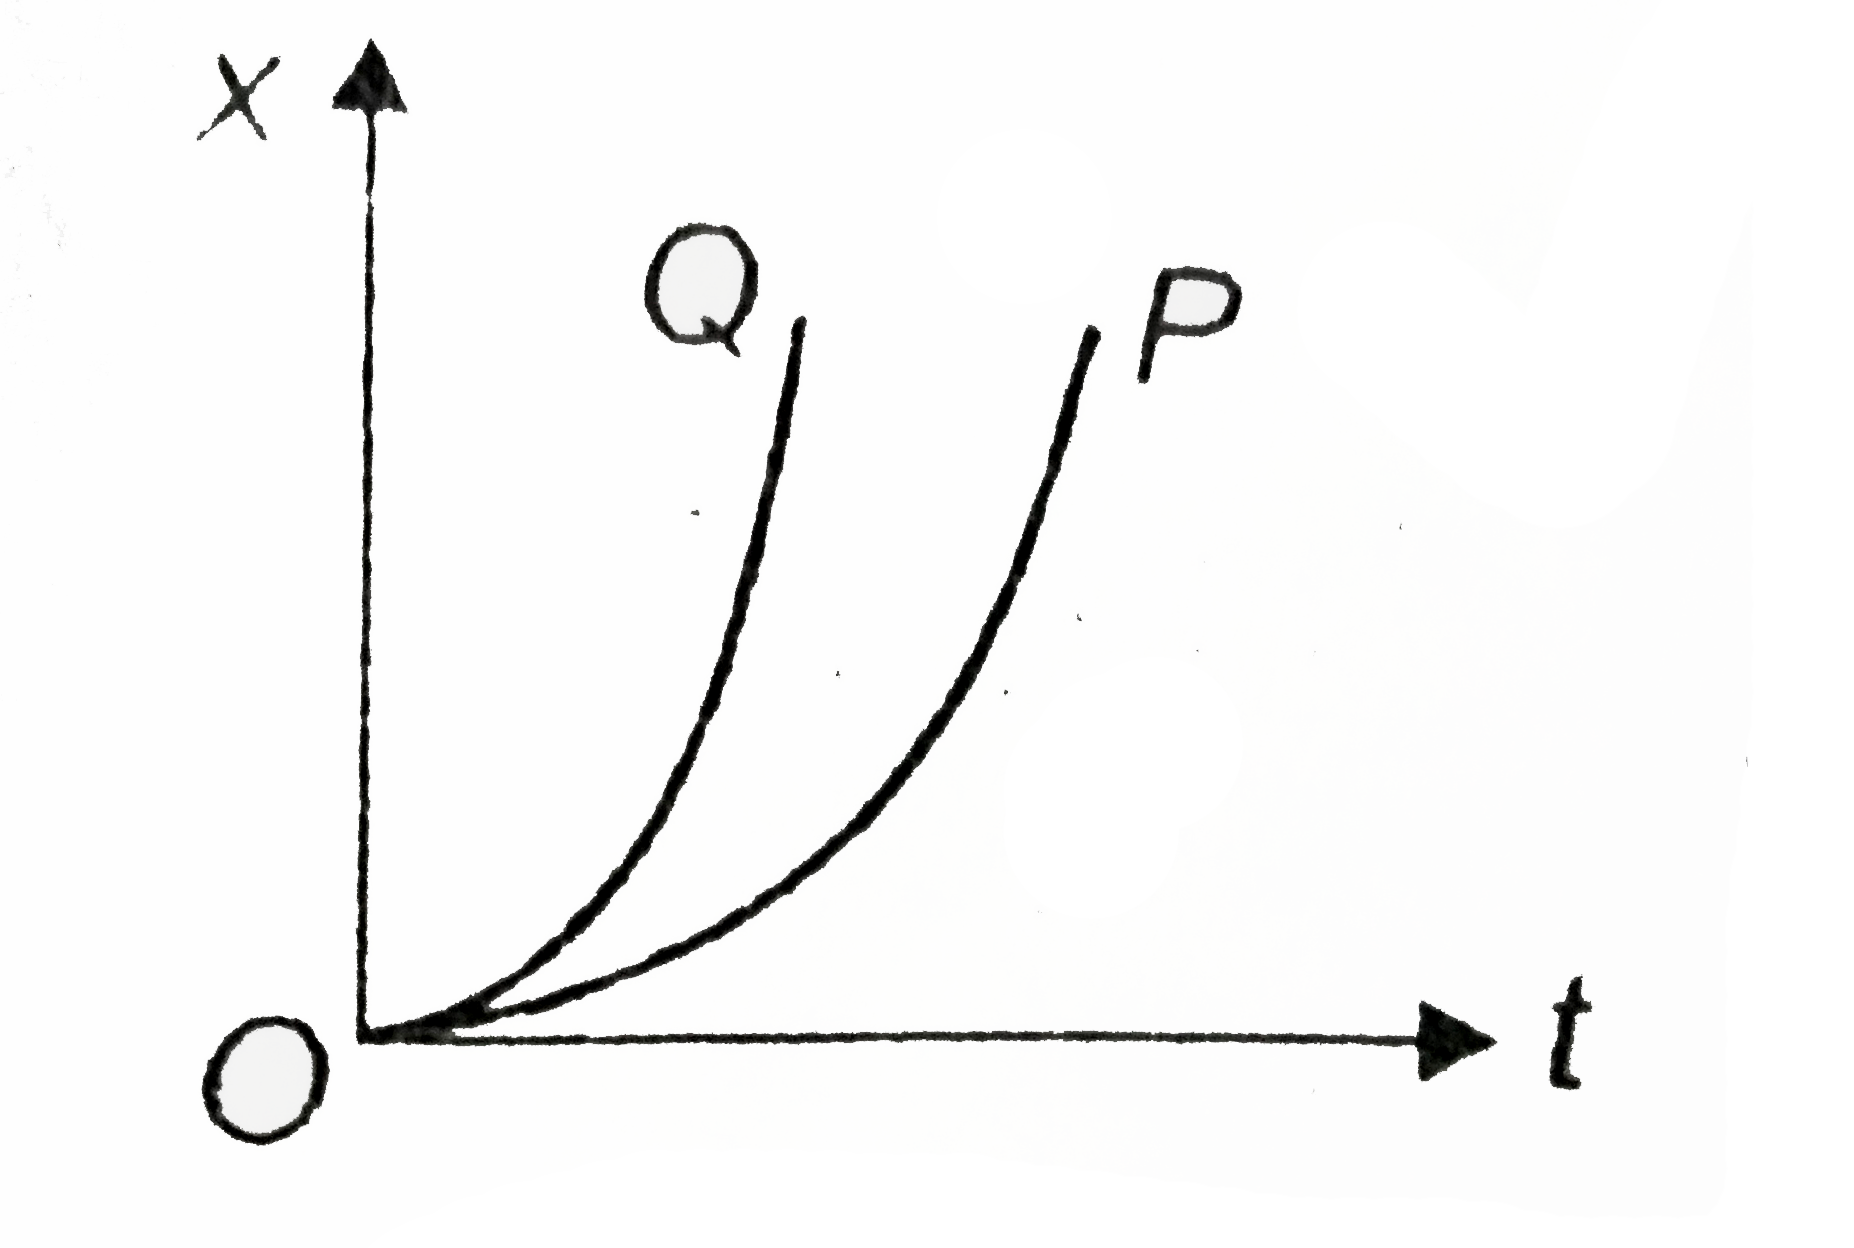
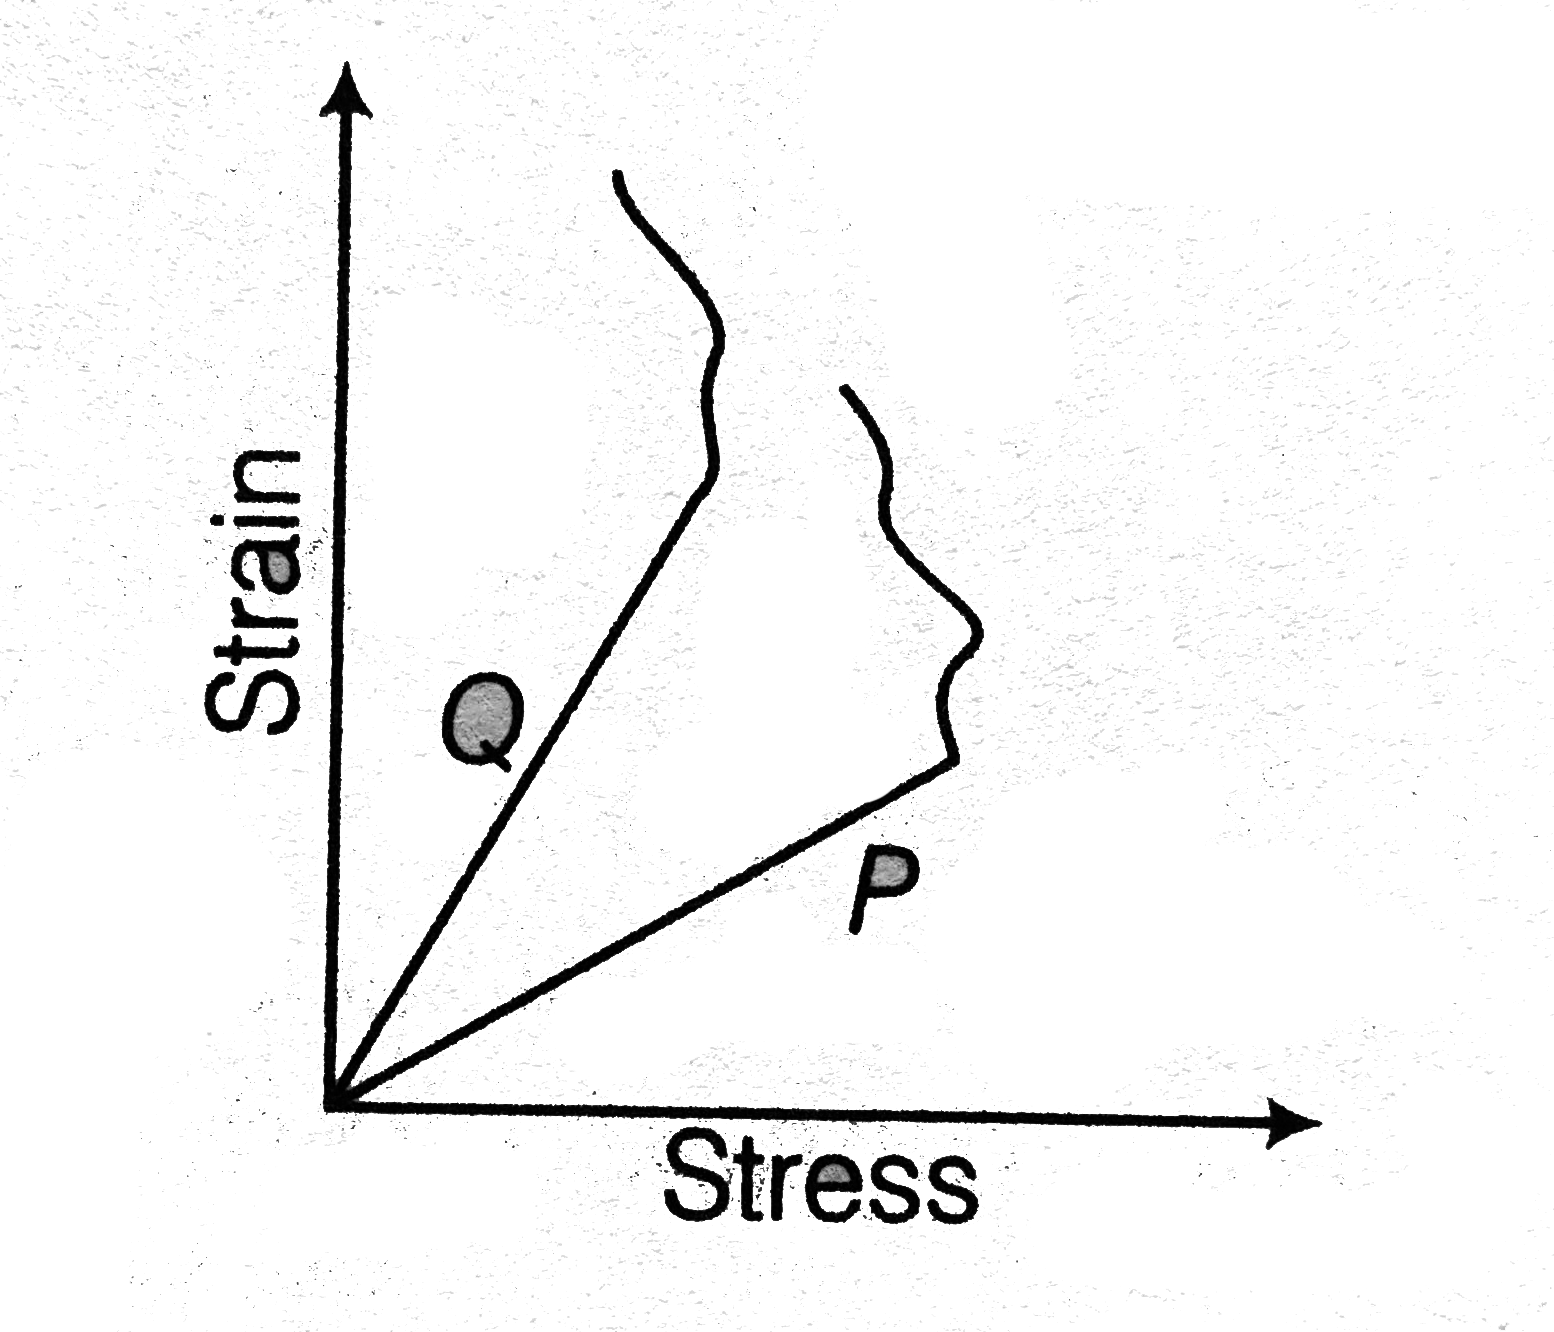
In plotting stress versus strain curves for two material P and Q, a student by mistake puts strain on the y-axis stress on ther x-axis as shown in the figure. Then the correct statement is/are
P has more tensile sile strrength than Q
P is more ductile than Q
P is more brittle Q
The young's modulus of P is more than that of Q
The correct Answer is:A, B
P has more tensile strength than Q. From graph slop tanθ=strainstress , more will be slope, more will be the tensile strength. Therefore, from graph P has more tensile strength than Q. As P has more tensile strength, P is more ductile than Q. As P elongates more before it breaks. Thus, option (a) and (b) are true.
Topper's Solved these Questions
- BOOK - PRADEEPCHAPTER - PROPERTIES OF BULK MATTEREXERCISE - Integer Type Questions12videos
PROPERTIES OF BULK MATTER
- BOOK - PRADEEPCHAPTER - PROPERTIES OF BULK MATTEREXERCISE - Asseration - Reason Type Question18videos
PROPERTIES OF BULK MATTER
- BOOK - PRADEEPCHAPTER - PROPERTIES OF BULK MATTEREXERCISE - Multiple choice questions-II14videos
PROPERTIES OF BULK MATTER
- BOOK - PRADEEPCHAPTER - PHYSICAL WORLD AND MEASUREMENTEXERCISE - Competiton Focus Jee Medical Entrance18videos
PHYSICAL WORLD AND MEASUREMENT
- BOOK - PRADEEPCHAPTER - RAY OPTICSEXERCISE - Problem For Practice(a)25videos
RAY OPTICS
Similar Questions
Knowledge Check
- Question 1 - Select One or More
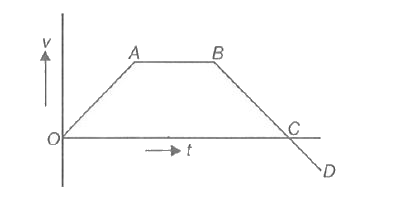
For a particle moving along x-axis, a scaled x-6 graph is shown in figure. Mark the correct statement (s).
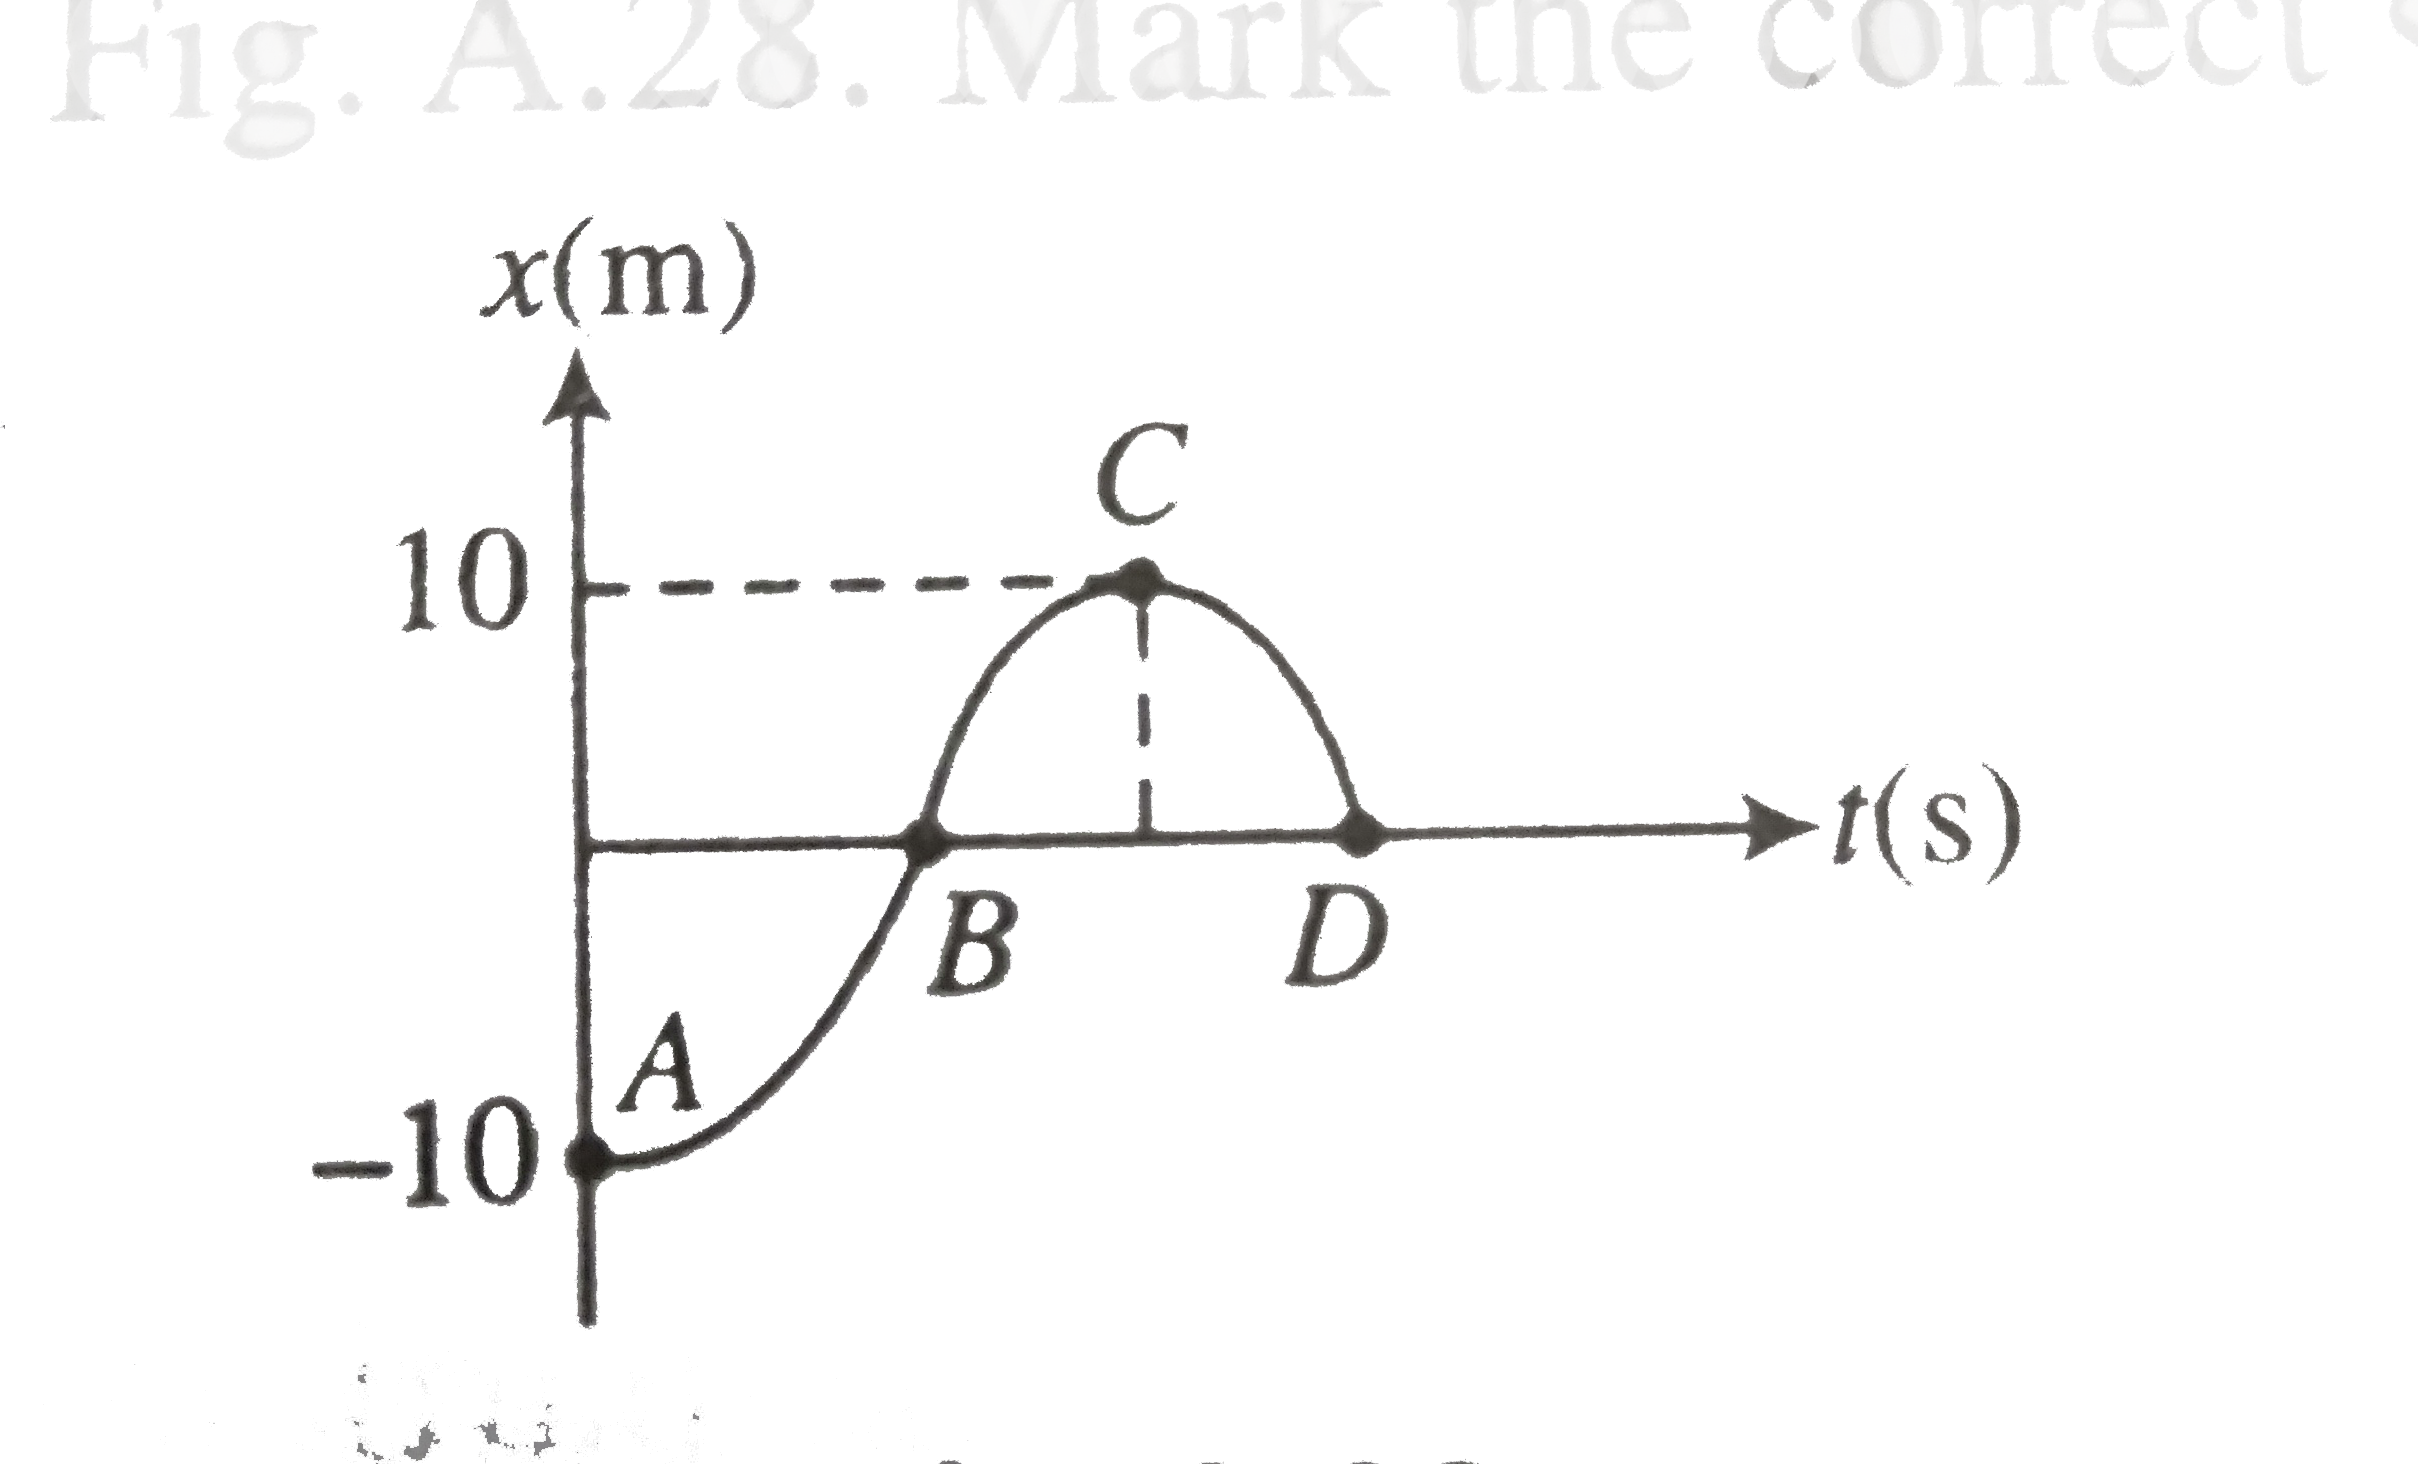 ASpeed of the particle is greatest at C.BSpeed of the particle is greatest at B.CParticle is speeding up in region marked CD.DParticle is speeding up in region marked AB.
 - Question 2 - Select One
Displacement versus time curve for a particle executing SHM is shown in figure. Choose the correct statements.
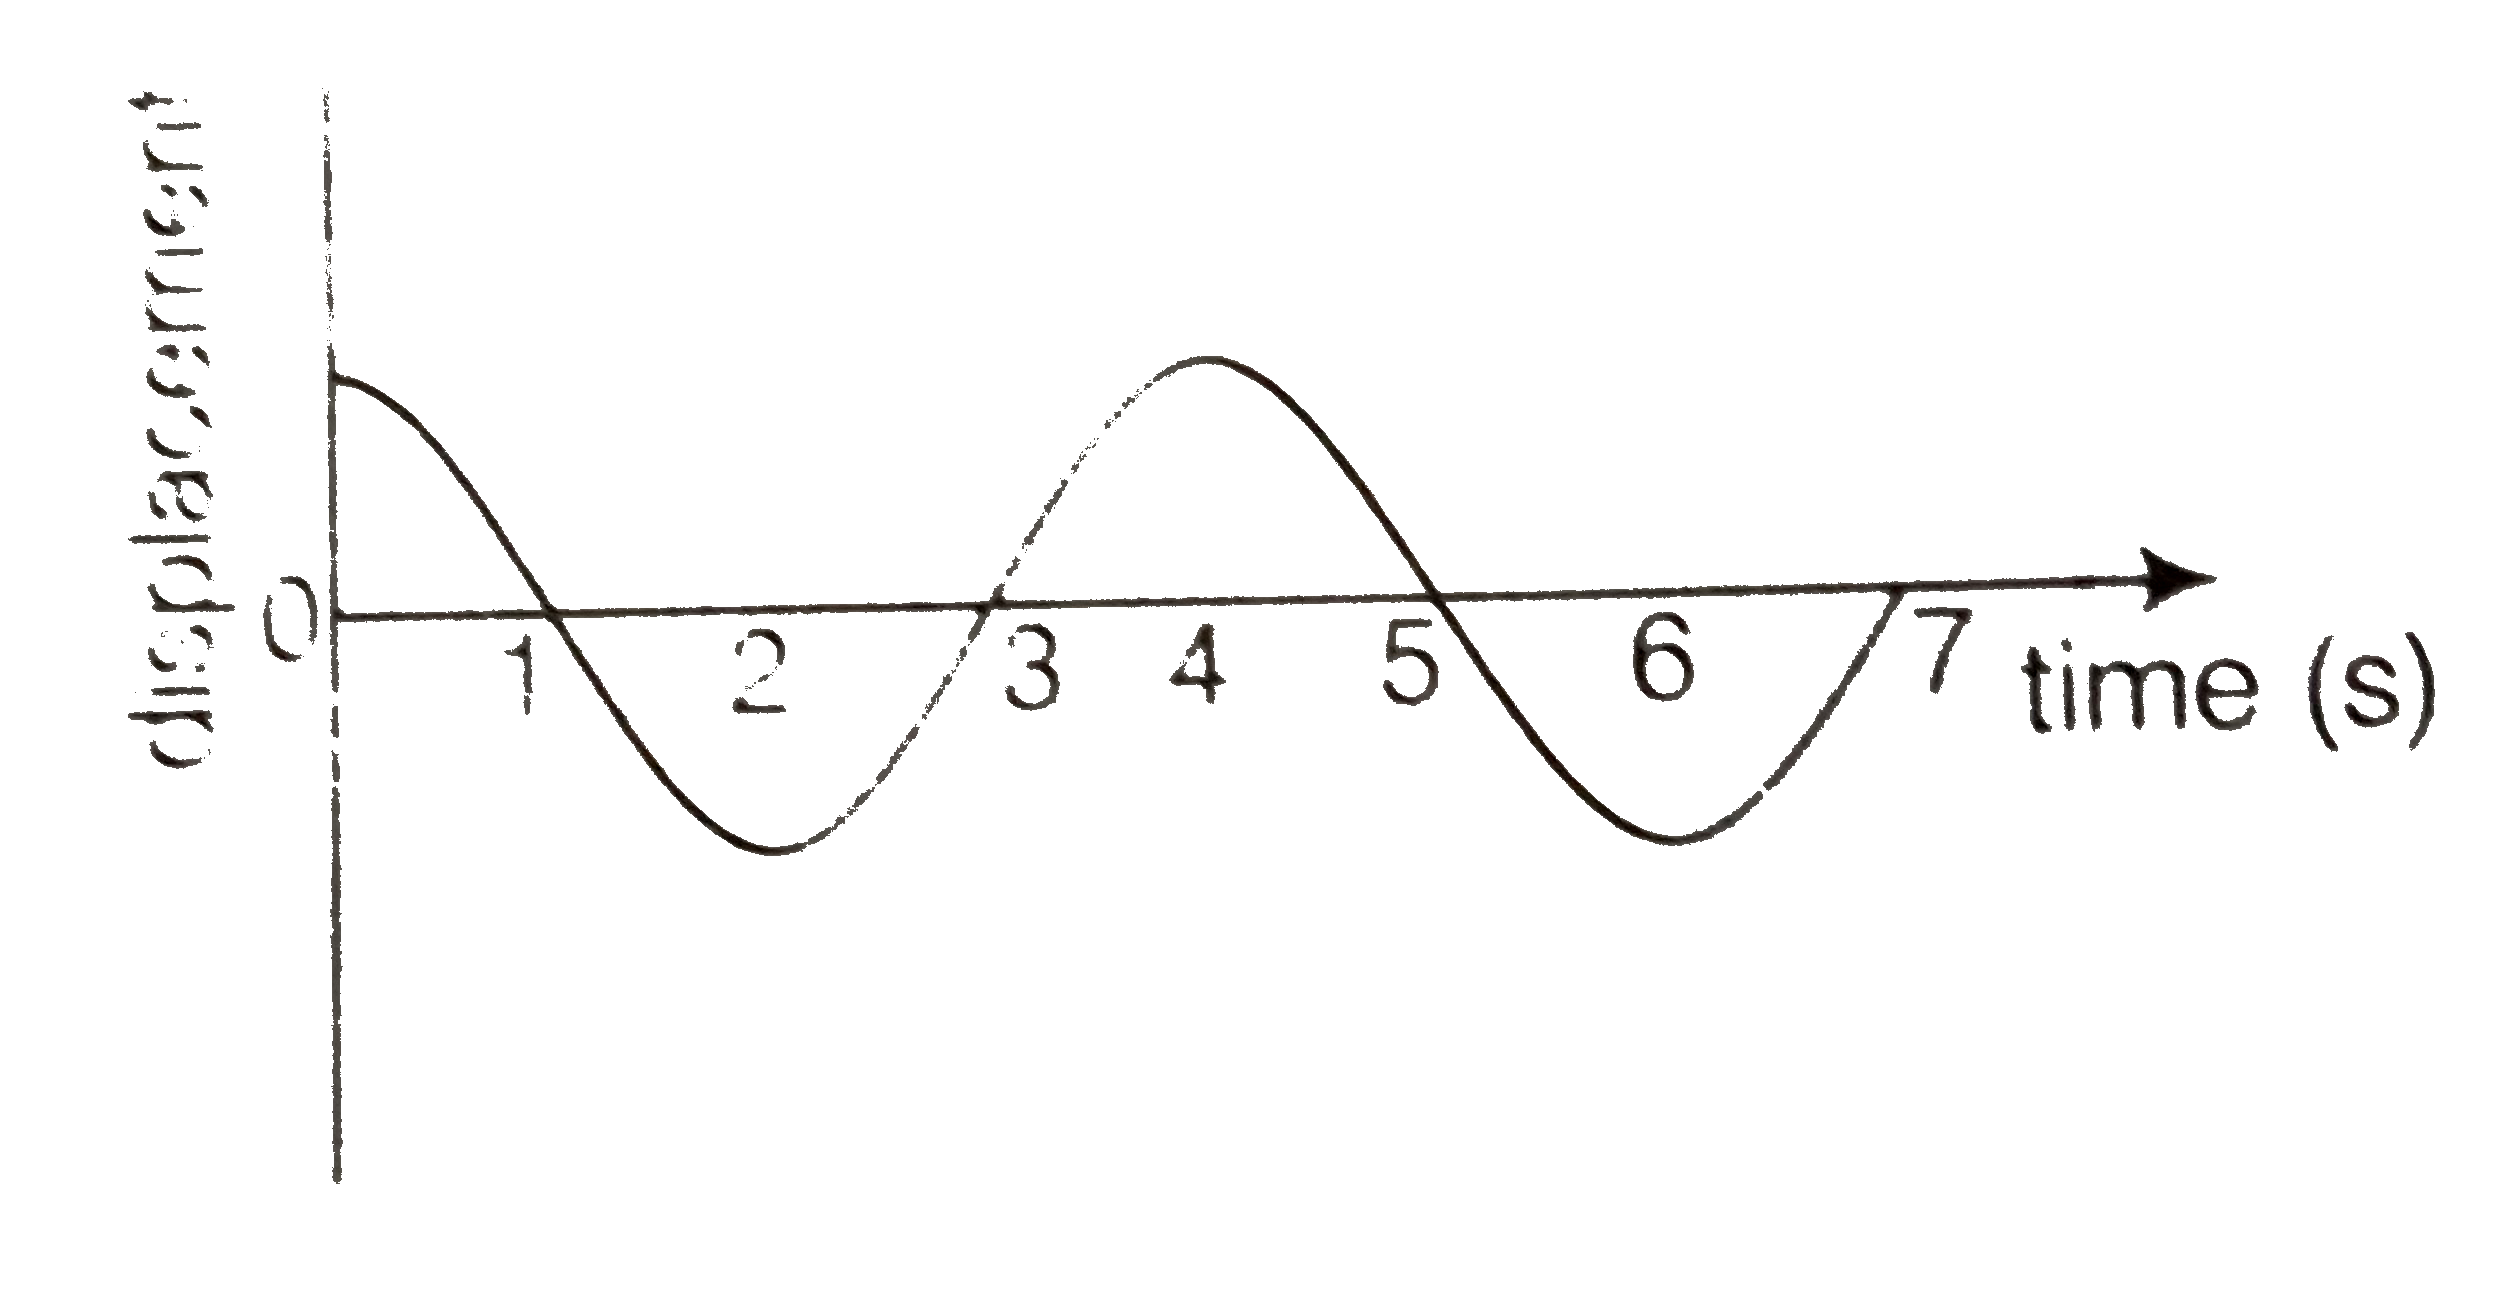 A(a) Phase of the oscillator is same at t=0s and t=2sBPhase of the oscillator is same at t=2s and t=6sCPhase of the oscillator is same at t=1sand t=7sDPhase of the oscillator is same at t=1sand t=5s
 - Question 3 - Select One
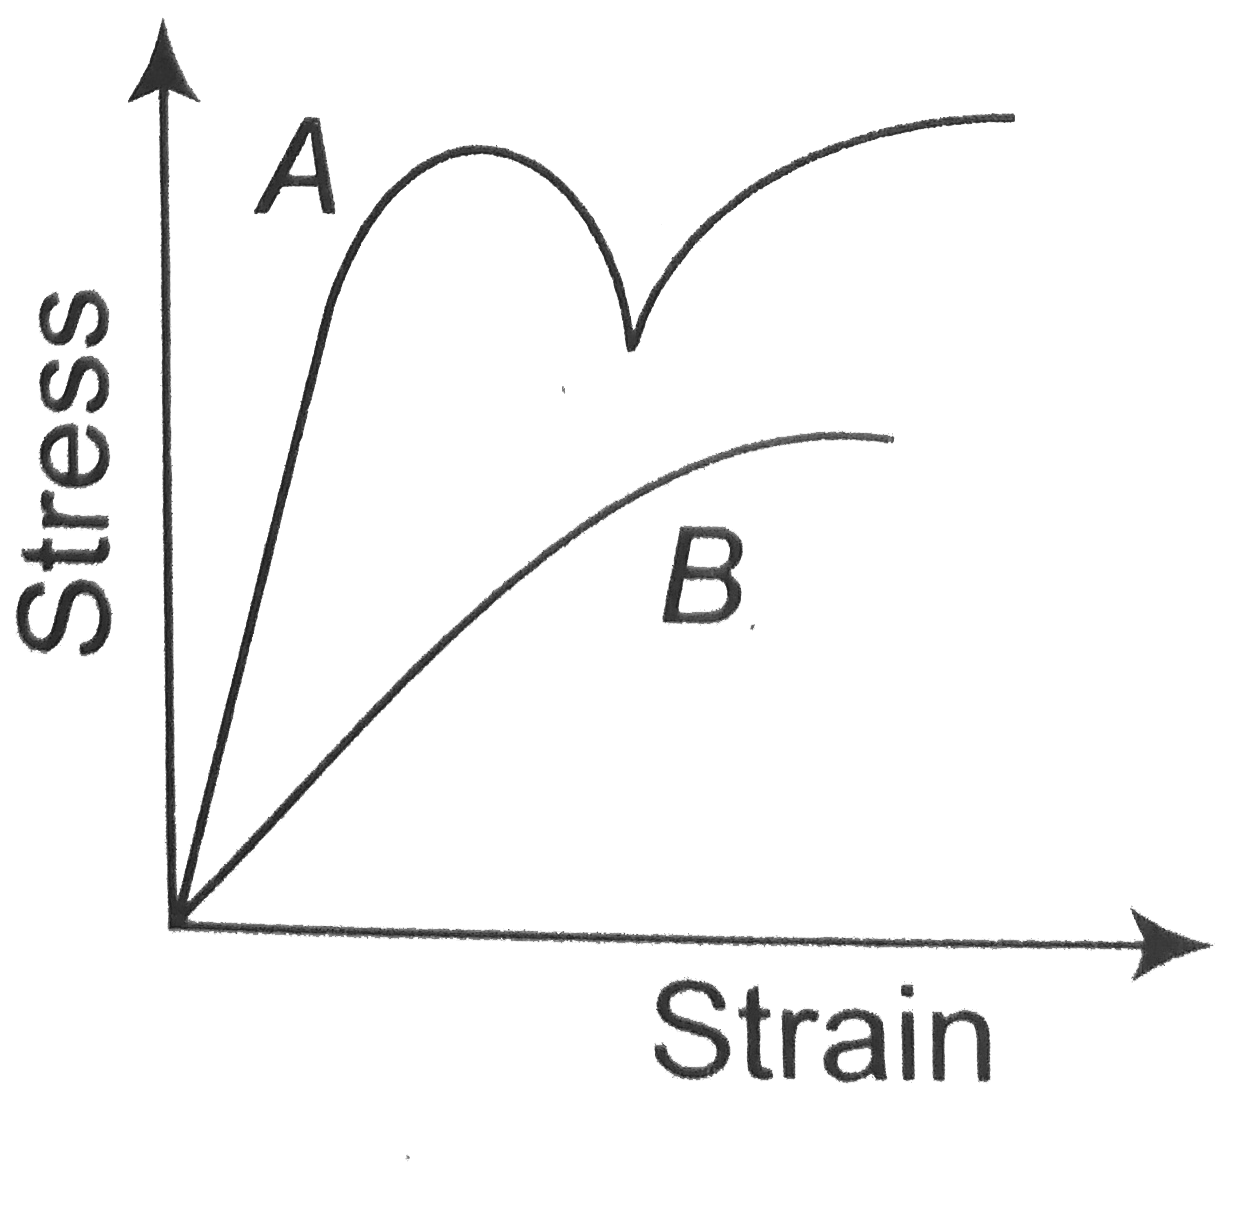
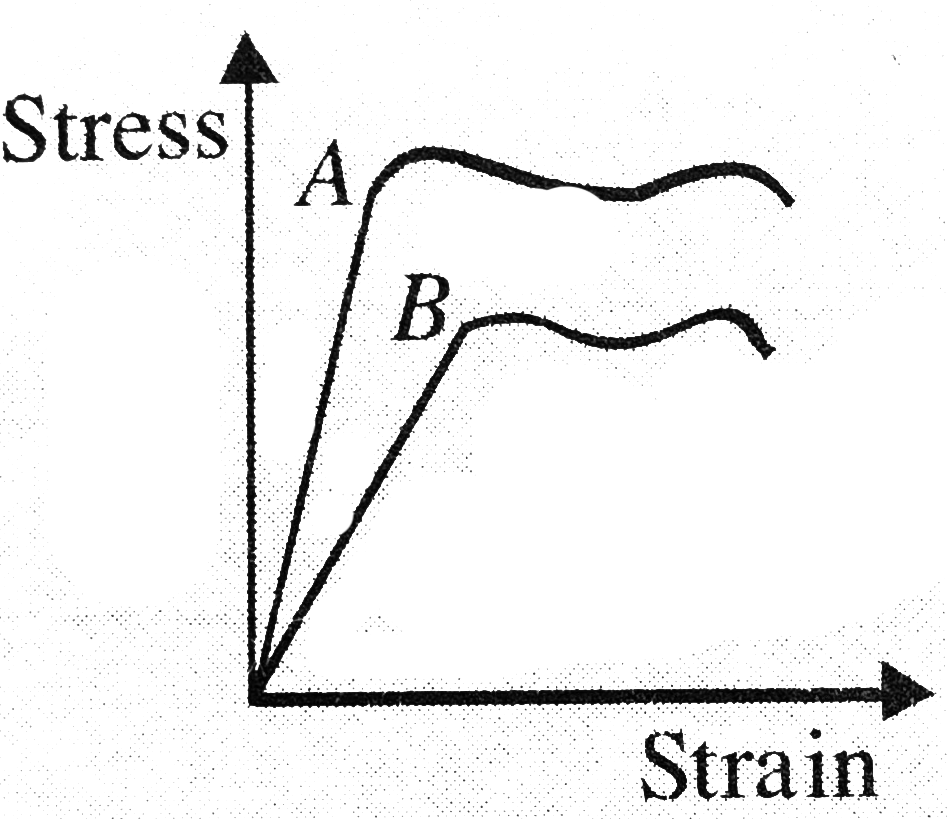
The diagram shoes stress v/s strain curve for the materials A and B. From the curves we infer thatAA is brittle but B is ductileBA is ductile and B is brittleCBoth A and B are ductileDBoth A and B are brittle
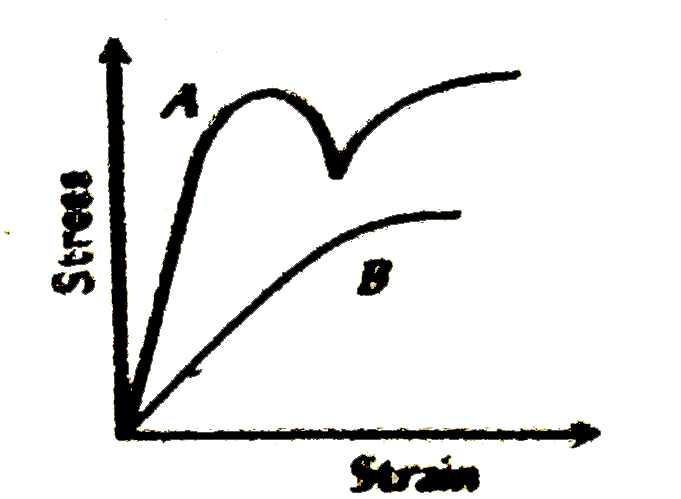
The diagram shows stress v/s strain curve for the materials A and B. From the curves we infer that
 View Solution
Figure shows the stress-strain curve of two metals P and Q. From the graph, it can be concluded that
 View Solution
The stress strain curves for brass, steel and rubber are shown in the figure. The lines A, B and C are forView SolutionThe stress and strain graphs for two materials, A and B are shown here. Answer the following:
 give reasonsView Solution
The stress versus strain graphs for wires of two materials A and B are as shown in the figure. If YA and YB are the Young's moduli of the materials thenView Solution


