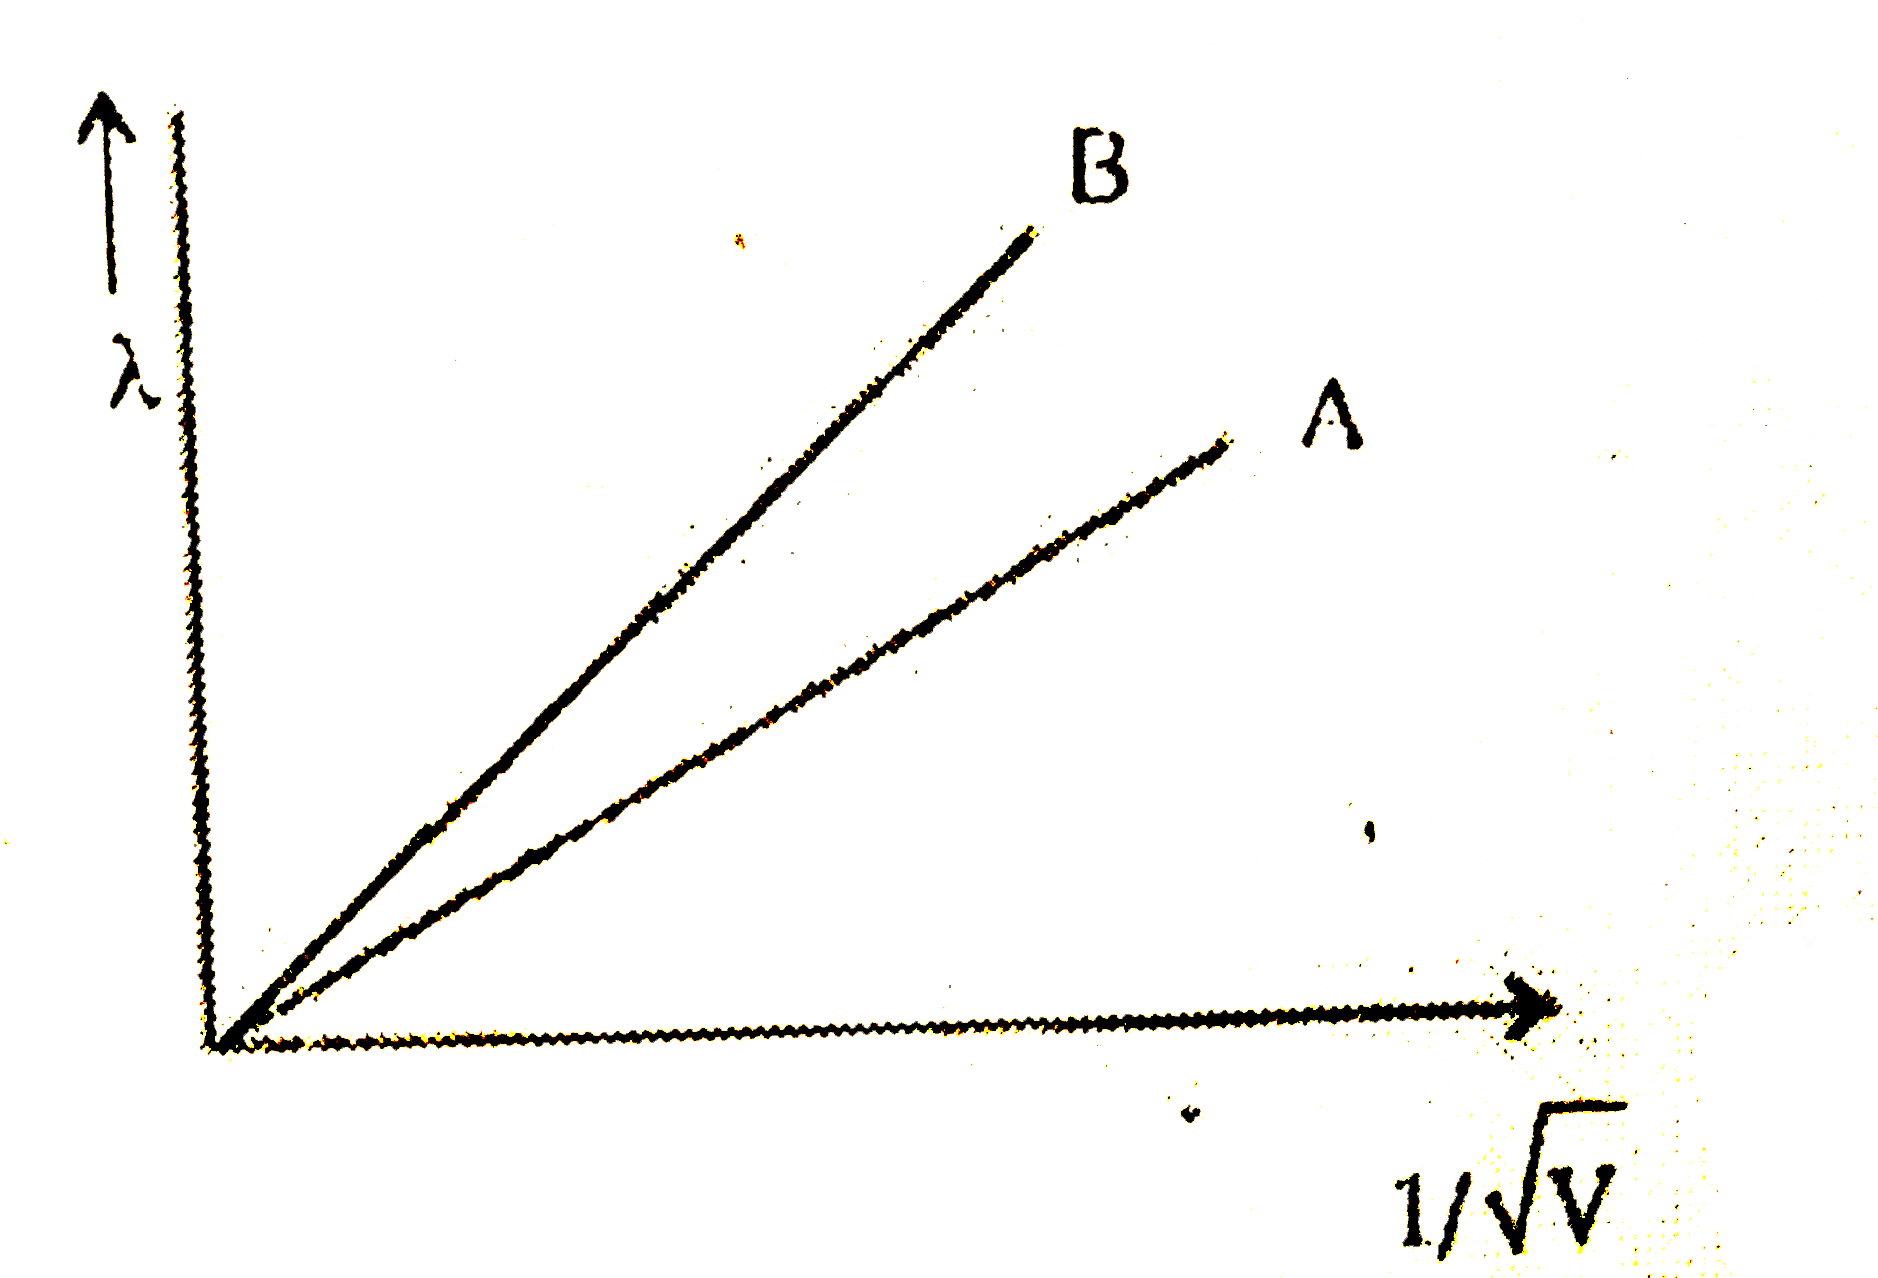
Plot a graph showing variation of de-broglie wavelength λ versus 1/√V, where V is accelerating potential for two particle A and P carrying same charge but of masses m1andm2(m1>m2). Which one of the two represents a particle of smaller mass and why?
To solve the problem of plotting the graph of de Broglie wavelength (λ) versus 1√V for two particles A and P with different masses, we will follow these steps:
1. Understanding the de Broglie Wavelength Formula:
The de Broglie wavelength (λ) of a particle is given by the formula:
λ=hp
where p is the momentum of the particle. For a charged particle accelerated through a potential V, the momentum can be expressed in terms of mass m and the charge Q:
p=√2mQV
Therefore, substituting this into the de Broglie wavelength formula gives:
λ=h√2mQV
2. Rearranging the Formula:
We can express λ in terms of 1√V:
λ=h√2mQ⋅1√V
This shows that λ is inversely proportional to √V.
3. Identifying the Relationship:
From the equation λ=h√2mQ⋅1√V, we can see that:
- The slope of the graph when plotting λ versus 1√V is given by h√2mQ.
- This means that the slope depends on the mass of the particle.
4. Comparing Two Particles:
Let’s denote the masses of the two particles as m1 for particle A and m2 for particle P, where m1>m2:
- For particle A (mass m1), the slope will be h√2m1Q.
- For particle P (mass m2), the slope will be h√2m2Q.
5. Analyzing the Slopes:
Since m1>m2, it follows that:
√m1>√m2⟹1√m1<1√m2
Therefore, the slope for particle P (smaller mass) will be greater than that for particle A (larger mass).
6. Plotting the Graph:
- On the x-axis, plot 1√V.
- On the y-axis, plot λ.
- The graph will show two lines: one for particle A and one for particle P. The line for particle P will have a steeper slope than that for particle A.
7. Conclusion:
The particle with the smaller mass (particle P) will have a greater slope in the graph of λ versus 1√V.
Final Graph:
- The graph will be a straight line for each particle, with the line for particle P being steeper than that for particle A.
The de Broglie wavelength (λ) of a particle is given by the formula:
λ=hp
where p is the momentum of the particle. For a charged particle accelerated through a potential V, the momentum can be expressed in terms of mass m and the charge Q:
p=√2mQV
Therefore, substituting this into the de Broglie wavelength formula gives:
λ=h√2mQV
We can express λ in terms of 1√V:
λ=h√2mQ⋅1√V
This shows that λ is inversely proportional to √V.
From the equation λ=h√2mQ⋅1√V, we can see that:
- The slope of the graph when plotting λ versus 1√V is given by h√2mQ.
- This means that the slope depends on the mass of the particle.
Let’s denote the masses of the two particles as m1 for particle A and m2 for particle P, where m1>m2:
- For particle A (mass m1), the slope will be h√2m1Q.
- For particle P (mass m2), the slope will be h√2m2Q.
Since m1>m2, it follows that:
√m1>√m2⟹1√m1<1√m2
Therefore, the slope for particle P (smaller mass) will be greater than that for particle A (larger mass).
- On the x-axis, plot 1√V.
- On the y-axis, plot λ.
- The graph will show two lines: one for particle A and one for particle P. The line for particle P will have a steeper slope than that for particle A.
The particle with the smaller mass (particle P) will have a greater slope in the graph of λ versus 1√V.
- The graph will be a straight line for each particle, with the line for particle P being steeper than that for particle A.
Topper's Solved these Questions
- BOOK - PRADEEPCHAPTER - DUAL NATURE OF RADIATION AND MATTEREXERCISE - NCERT Exerciese question1videos
DUAL NATURE OF RADIATION AND MATTER
- BOOK - PRADEEPCHAPTER - DUAL NATURE OF RADIATION AND MATTEREXERCISE - Short answer1videos
DUAL NATURE OF RADIATION AND MATTER
- BOOK - PRADEEPCHAPTER - CURRENT ELECTRICITYEXERCISE - Problems for Practice (B)2videos
CURRENT ELECTRICITY
- BOOK - PRADEEPCHAPTER - ELECTROMAGNETIC INDUCTION & ALTERNATING CURRENTEXERCISE - Multiple Choice Questions1videos
ELECTROMAGNETIC INDUCTION & ALTERNATING CURRENT
Similar Questions
Plot a graph showing variation of de-broglie wavelength λ versus 1/√V, where V is accelerating potential for two particle A and P carrying same charge but of masses m1andm2(m1>m2). Which one of the two represents a particle of smaller mass and why?
View SolutionTwo lines, A and B, in the plot given below show the variation of de-Broglie wavelength, λ versus 1/√V, where V is the accelerating potential difference, for two particles carrying the same charge. Which one of two represents a particle of smaller mass?
 View Solution
Knowledge Check
- Question 1 - Select One or More
Two particles A1andB2 of masses m1andm2(m1>m2) have the same de Broglie wavelength . Then
Atheir momenta are the same.Btheir energies are the sameCthe energy of A1 is less than the energy of A2Dthe energy of A1 is more than the energy of A2 - Question 2 - Select One
Which of the following graphs shows the variation of de-Broglie wavelength with potential through which a particle of charge q and mass m is accelerated ?
A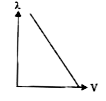 B
B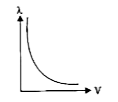 C
C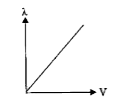 D
D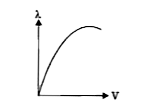
- Question 3 - Select One
de Broglie wavelengths of two particles A and B are plotted against (1√V) , where V is the potential on the particles. Which of the following relation is correct about the mass of the particles ?
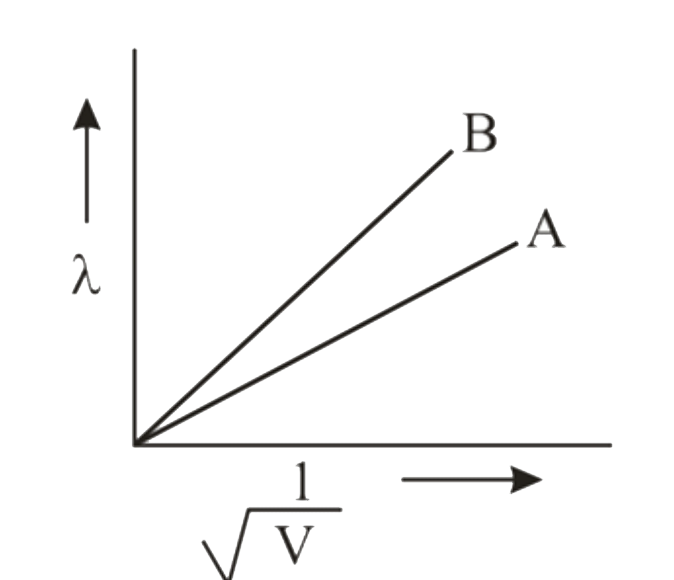 AmA=mBBmA>mBCmA<mBDmA≤mB
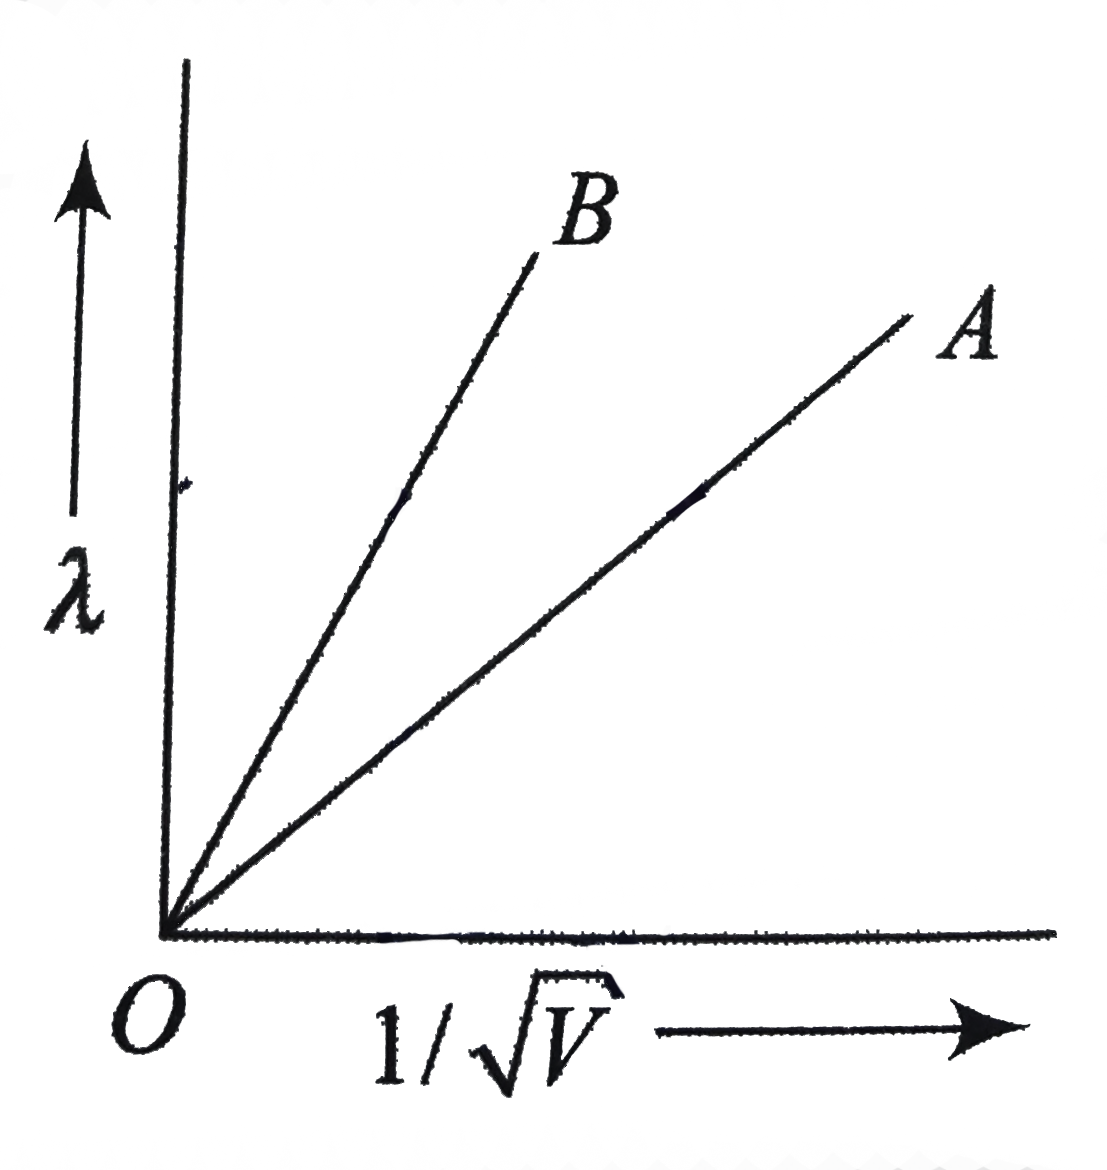
The two lines A and B in fig. shoe the phot of de Broglie wavelength (λ) as a function of 1√V(V is the accelerating potential) for teo particles having the same charge. Which of the two represents the particle of heavier mass?View SolutionPlot a graph showing variation of a de Broglie wavelength (λ) associated with a charged particle of mass m, verses 1/√V, where V is the potential difference thrugh which the particle is accelerated. How does this graph give us the information the magnitude the magnitude of the charge of the particle ?
View SolutionDraw a graph showing the variation of de Broglie wavelength of a particle of charge q and mass m with accelerating potential. Proton and deuteron have the same de Broglie wavelengths. Explain which has more kinetic energy.
View Solution(a) Draw a graph showing the variation of de-Broglie wavelength of a particle of charge 'q' and mass 'm' with accelerating potential 'V'.
(b) Proton and deuteron have the same de-Broglie wavelength. Explain which has more kinetic enegy.View SolutionThe de-Broglie wavelength λ associated with charged particle of charge q, mass m and potential difference V is
View Solution

