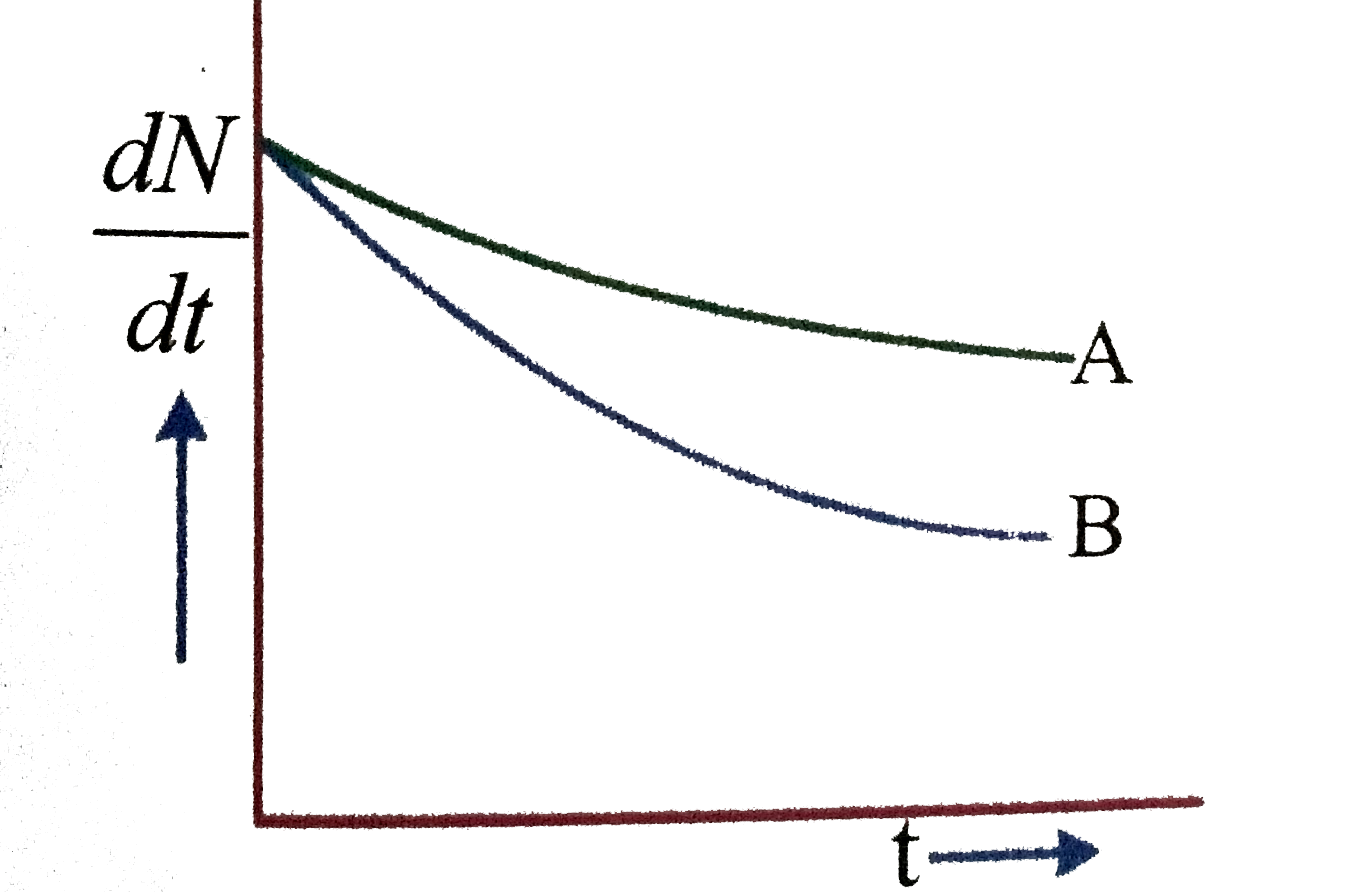
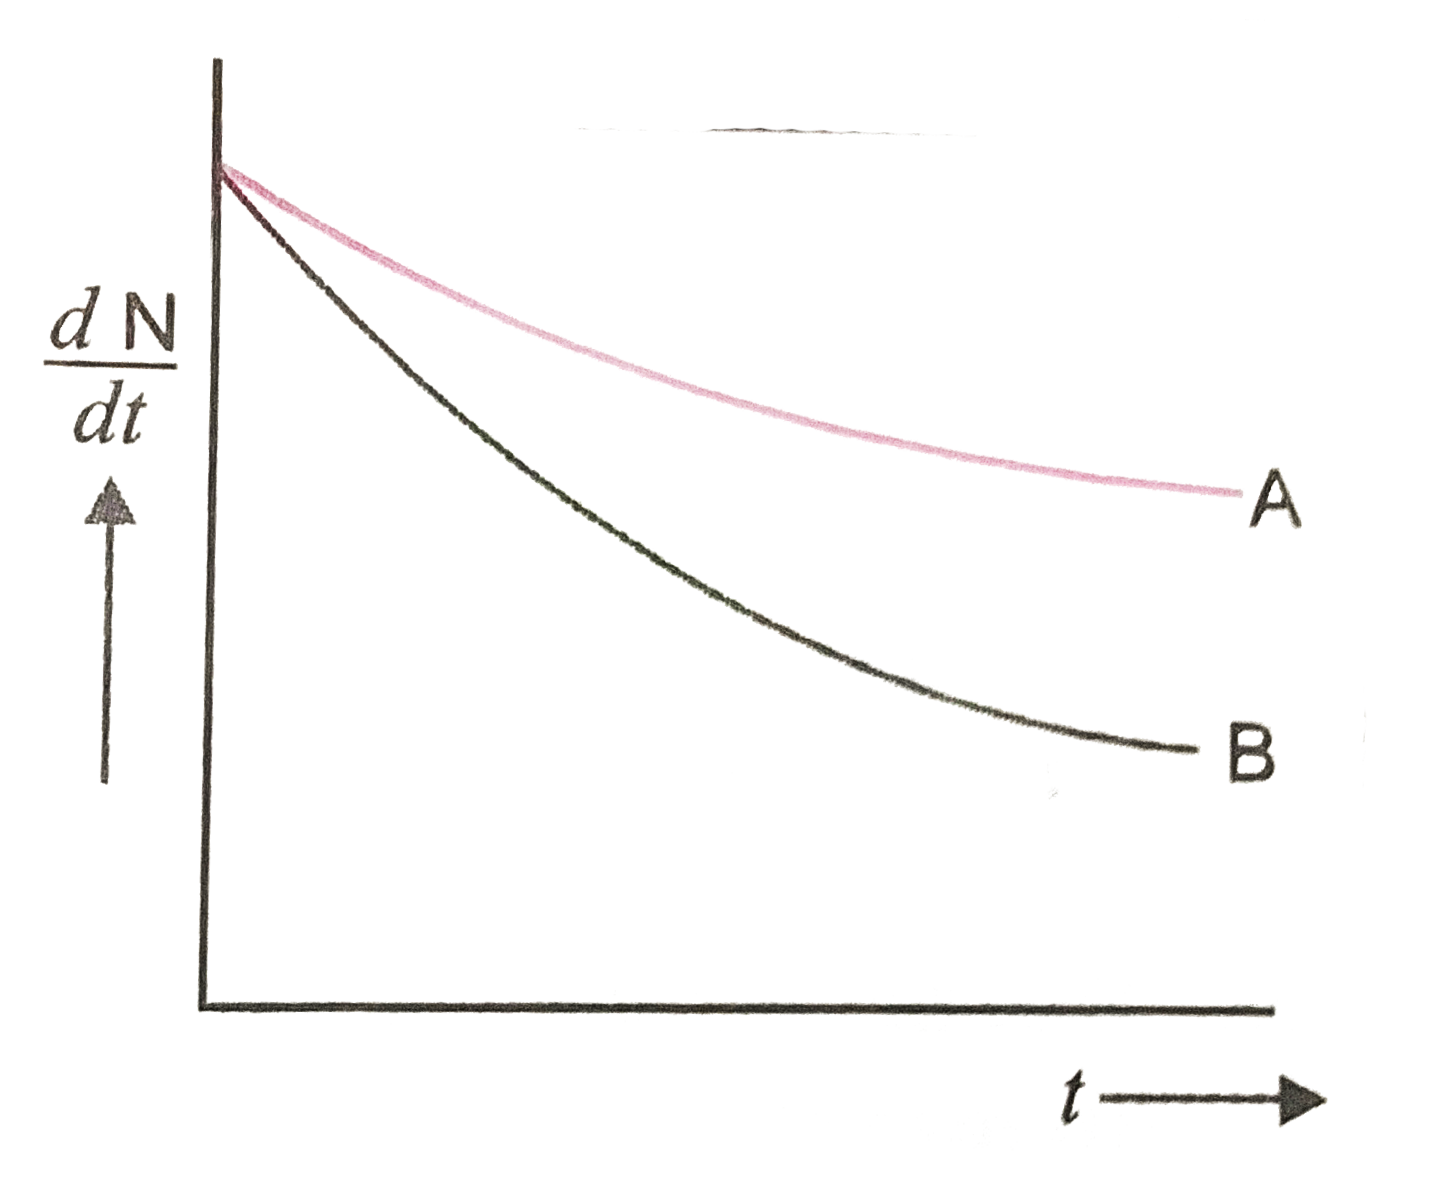
Which sample A or B shown in figure has shorter mean-life ?
Video Solution
Text Solution
form fig. , we find that at t=0,(dNdt)A=(dNdt)B
Therefore, (N0)A=(N0)B
At any subsequent time, (dNdt)B<(dNdt)A
∴λBNB<λANA
As NB<NA (rate of decay of B is slower)
∴λB<λA
Hence, τB<τA, i.e., mean life time of B is shorter than that of A.
|
Updated on:21/07/2023
Similar Questions
Knowledge Check
- Question 1 - Select One
A and B shown in the figure arc
 AEpidermis and Guard cell,BGuard cell and Cuticle,CStomatal pore and Guard cell,DEpidermis and Pore.
 - Question 2 - Select One
Which sample contains greater number of nuclei ?
a 5.00−μCi sample of .240Pu (half-life 6560y)
or a4.45−μCi sample of .243Am (half-life 7370y).A.240PuB.243AmCEqual in bothDNone of these - Question 3 - Select One
The count rate of 10g of radioactive material was measured at different times and times has been shown in the figure. The half-life of material and the total counts (approximately) in the first half life period, respectively are.
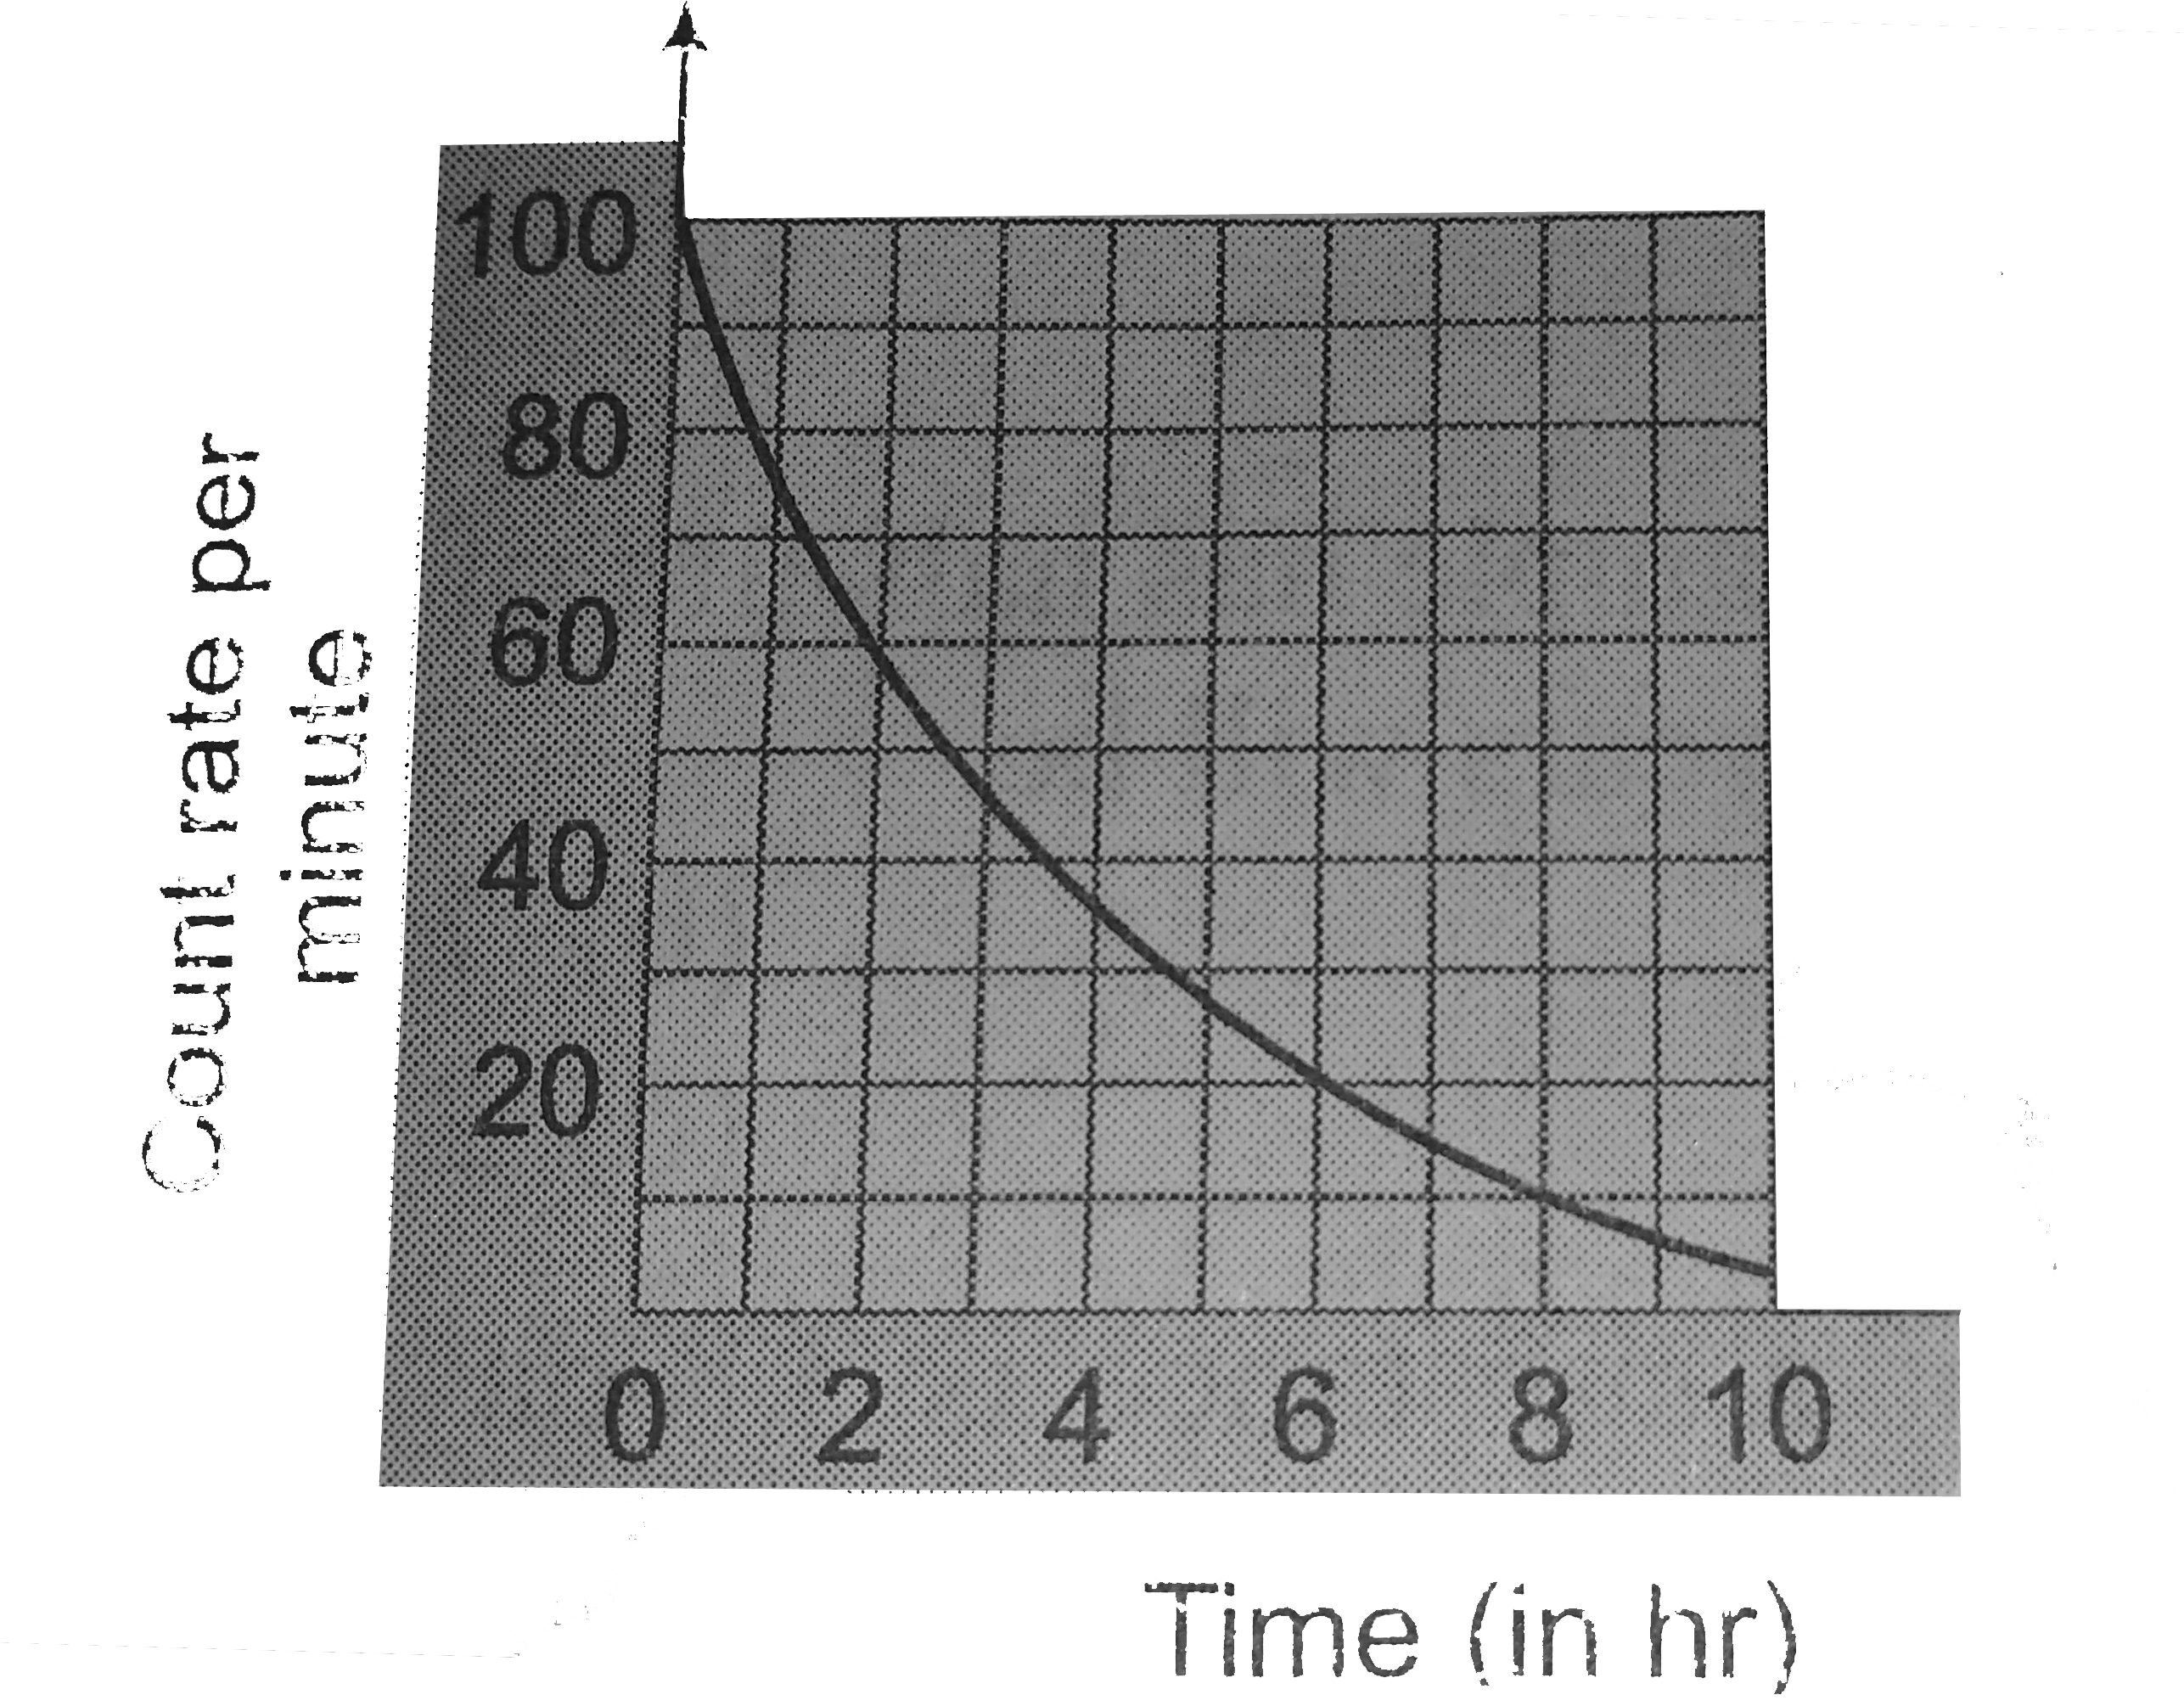 .A4h,9000B3h,14000C3h,235D3h,50
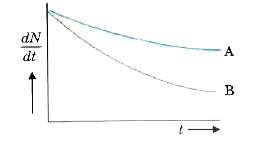
Which sample, A or B, shown in the following figure has shorter mean life?
 View Solution
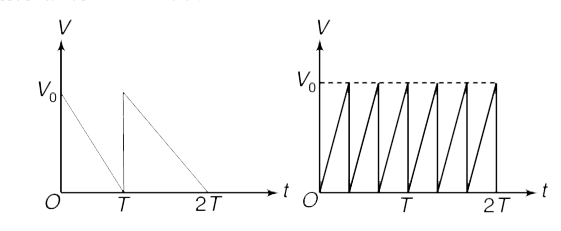
Which of the two waveforms shown in Figure has a higher average value?
 View Solution
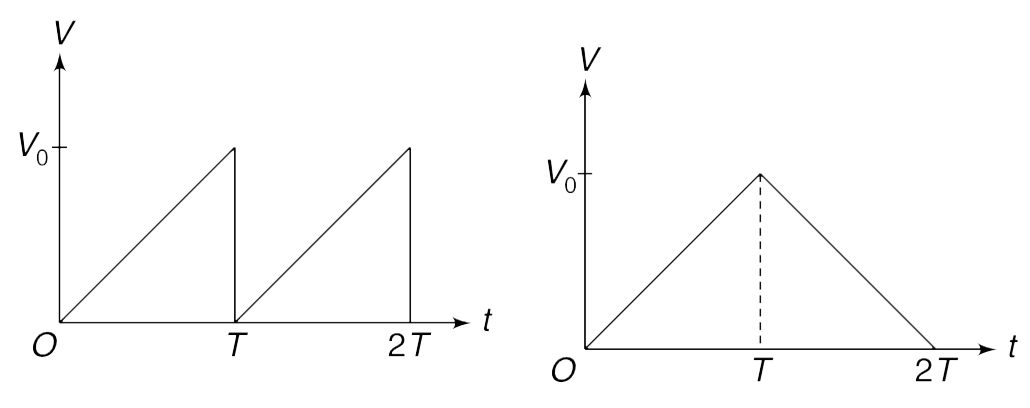
Which of the two waveforms shown in Figure has a higher rms value?
 View Solution
Which colour of light has the shorter wavelength-red or violet ?
View SolutionWhat percentage of the atoms in a sample will remain undecayed in a time equal to mean life ?
View Solution
