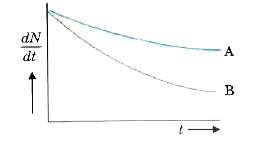
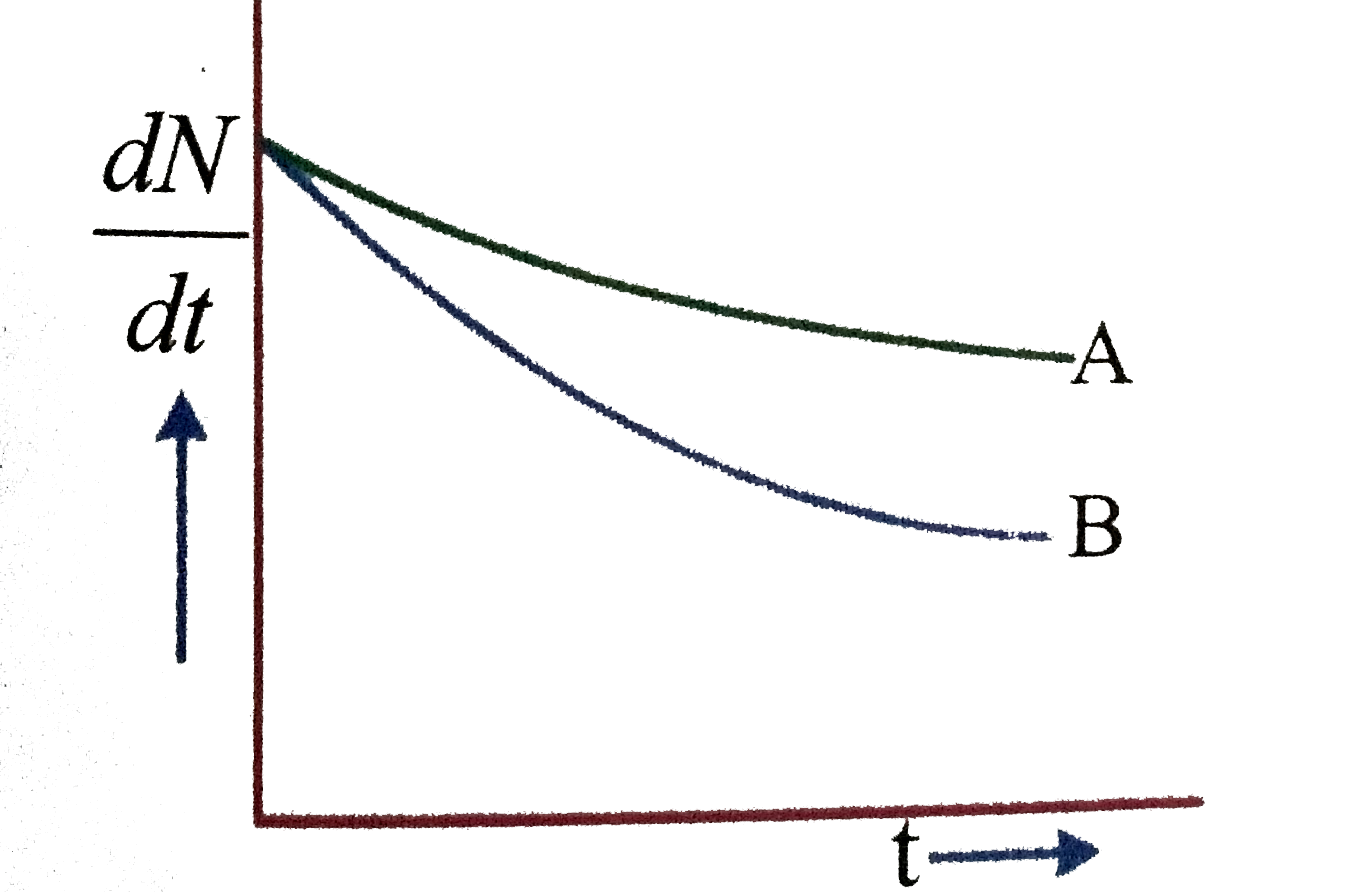
Which sample, A or B, shown in the following figure has shorter mean life?

Video Solution
Text Solution
N=N0e−λt
⇒dNdt=−N0λe−λt
From the graph, we can understand λB>λA.
Also mean life is
τ=1/λ.
So, τB<τA
Thus, the mean life of sample B is shorter than that of sample A.
|
Updated on:21/07/2023
Topper's Solved these Questions
- BOOK - MODERN PUBLICATIONCHAPTER - NUCLEIEXERCISE - NCERT FILE SOLVED (NCERT EXEMPLAR PROBLEMS SUBJECTIVE QUESTIONS (SHORT ANSWER TYPE QUESTIONS))5videos
NUCLEI
- BOOK - MODERN PUBLICATIONCHAPTER - NUCLEIEXERCISE - HIGH ORDER THINKING SKILLS & ADVANCED LEVEL9videos
NUCLEI
- BOOK - MODERN PUBLICATIONCHAPTER - NUCLEIEXERCISE - NCERT FILE SOLVED (NCERT ADDITIONAL EXERCISES)9videos
NUCLEI
- BOOK - MODERN PUBLICATIONCHAPTER - MOVING CHARGES AND MAGNETISMEXERCISE - CHAPTER PRACTICE TEST13videos
MOVING CHARGES AND MAGNETISM
- BOOK - MODERN PUBLICATIONCHAPTER - RAY OPTICS AND OPTICAL INSTRUMENTSEXERCISE - CHAPTER PRACTICE TEST14videos
RAY OPTICS AND OPTICAL INSTRUMENTS
Similar Questions
Knowledge Check
- Question 1 - Select One
Which sample A or B shown in figure has shorter mean-life ?
 AτB<τABτB>τACτB=τADNothing can be concluded
 - Question 2 - Select One
Among the following, which has the longest half life?
A.23290ThB.23793NpC.23892UD.23592U - Question 3 - Select One
Which of the following has the longest life span ?
ABanyan treeBTortoiseCParrotDElephant
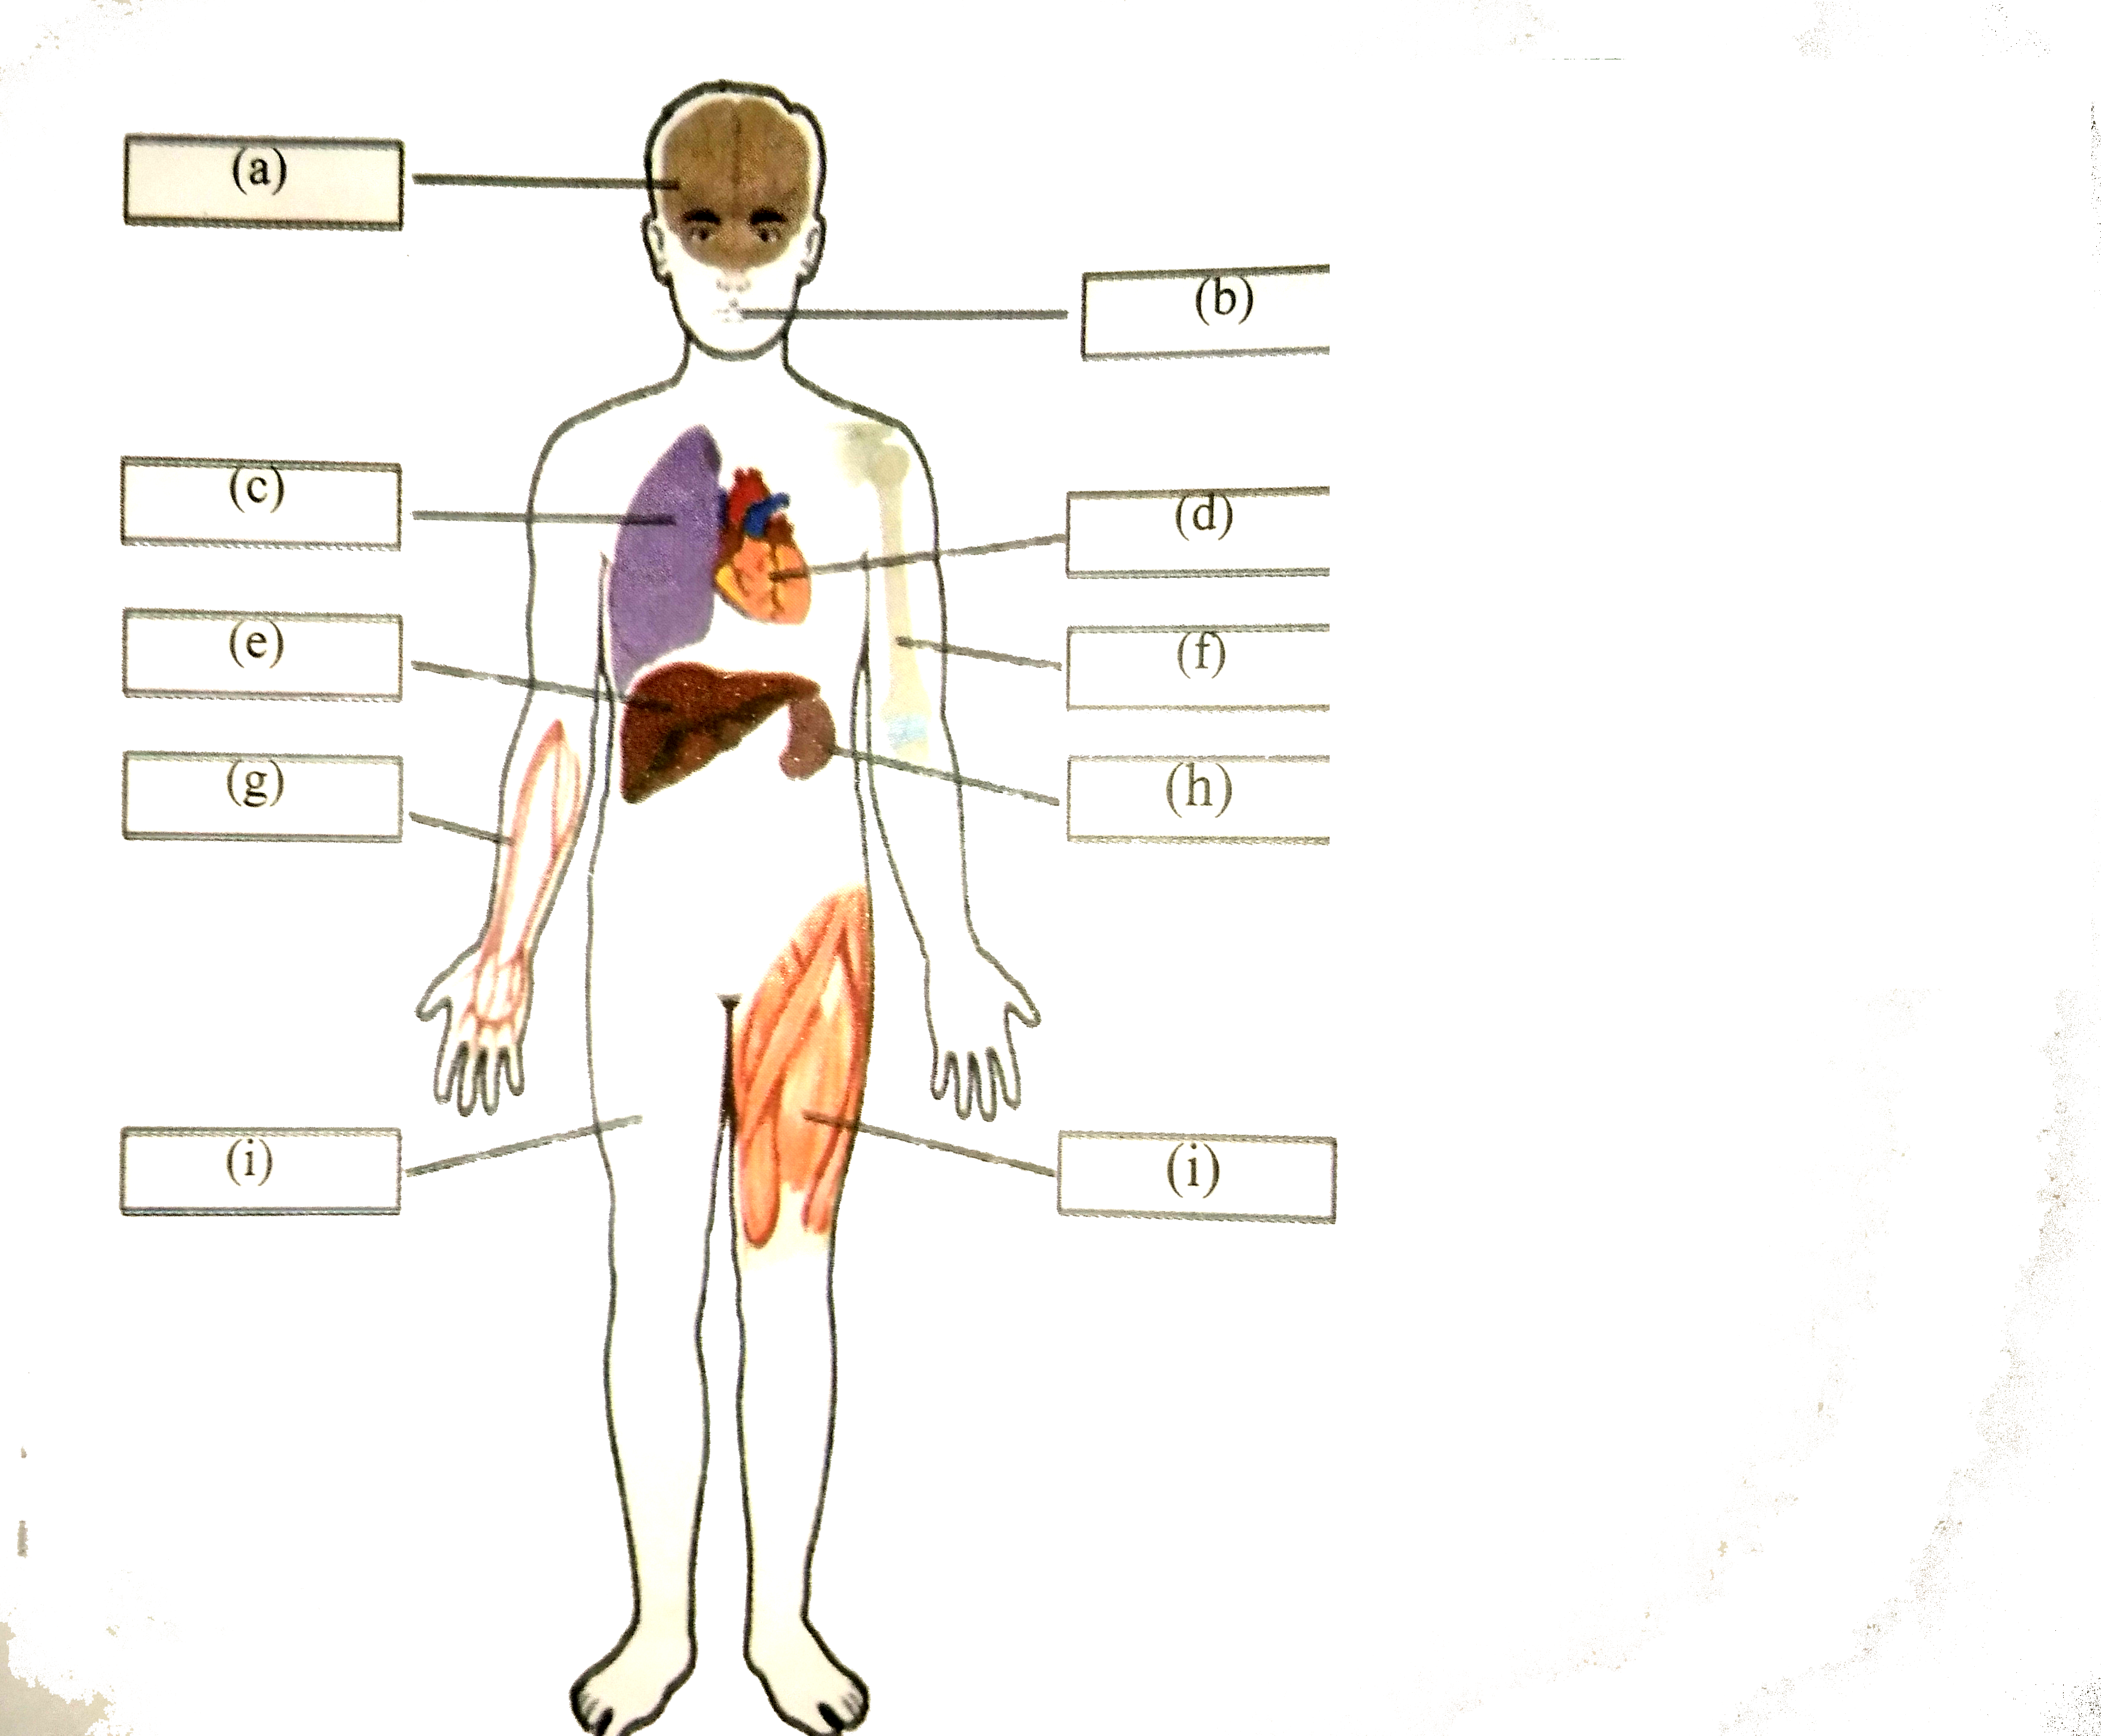
Body organization of human has been shown in the following figure. Use appropriate labels in that figure. Which organs are present in human body?
 View Solution
Which of the following has longest life in blood ?
View SolutionWhich of the following has no embryo in its life cycle ?
View SolutionWhich one of the following has haplontic life cycle
View SolutionWhich one of the following has minimum life span?
View Solution

