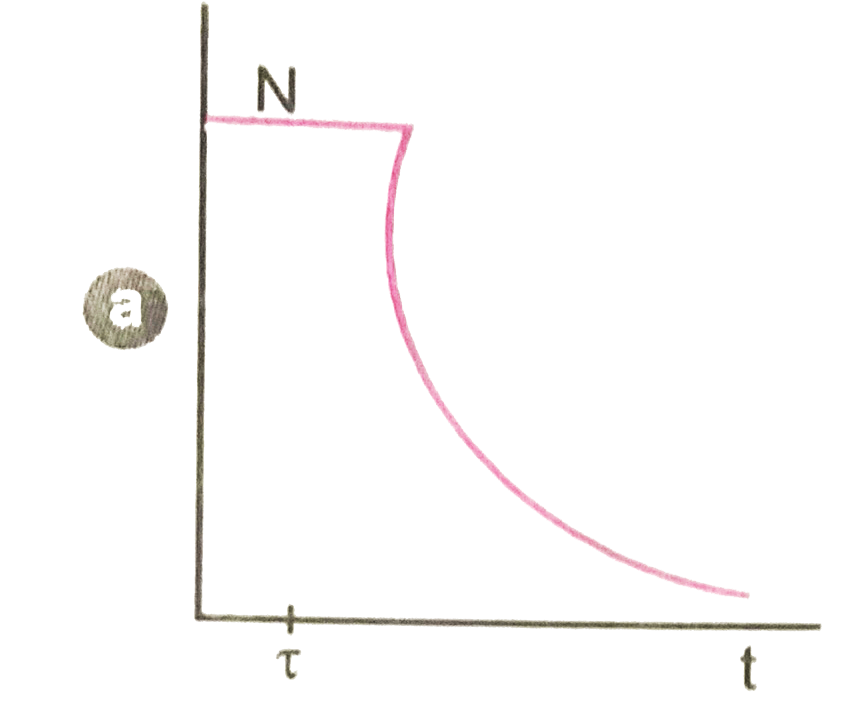
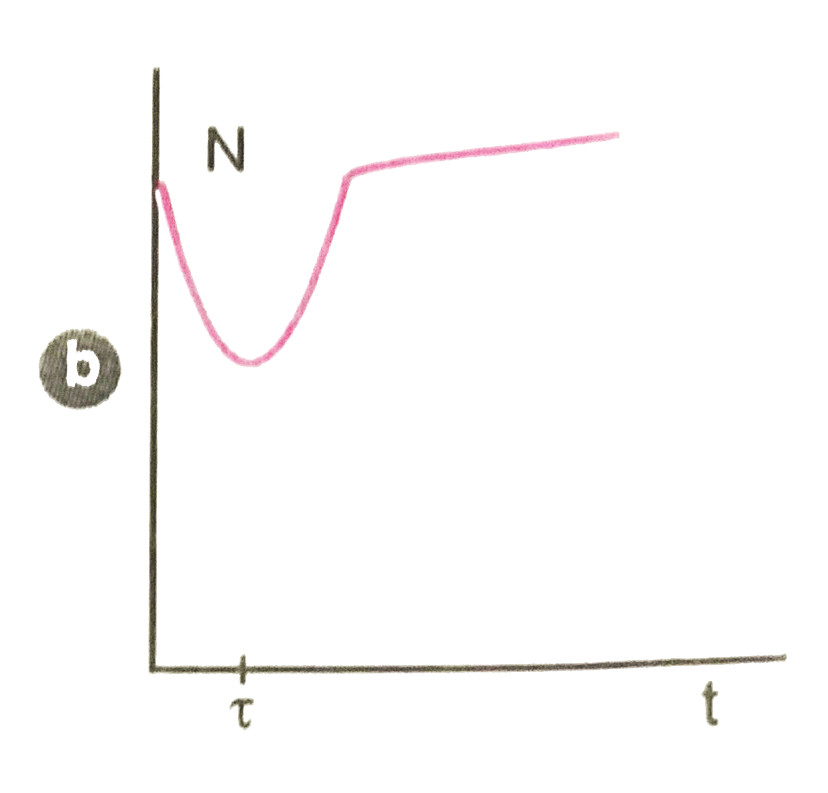
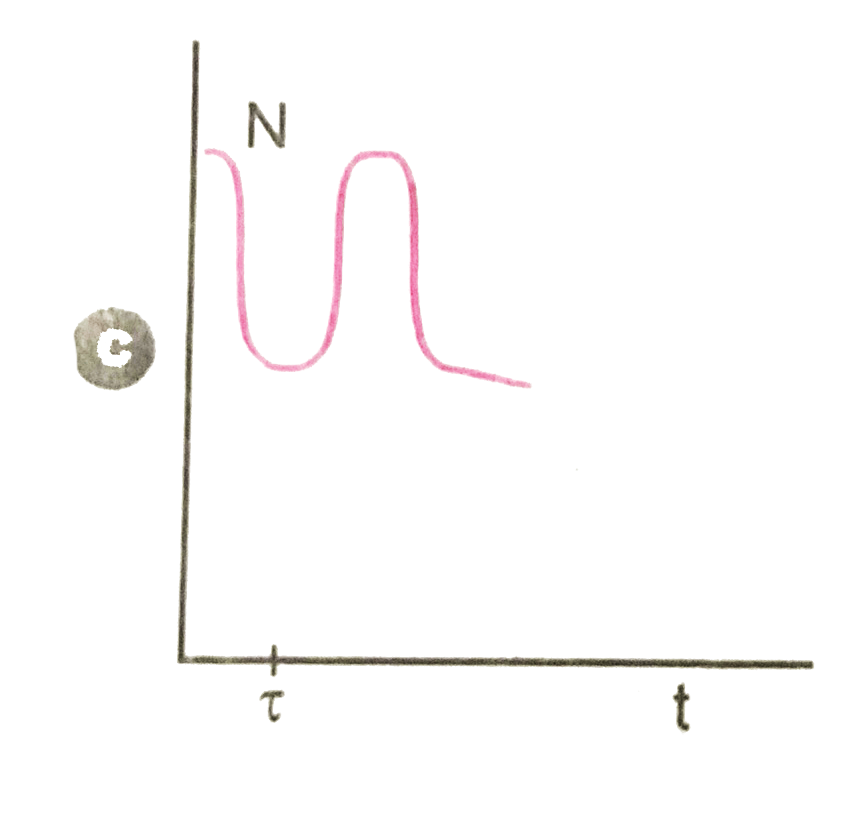
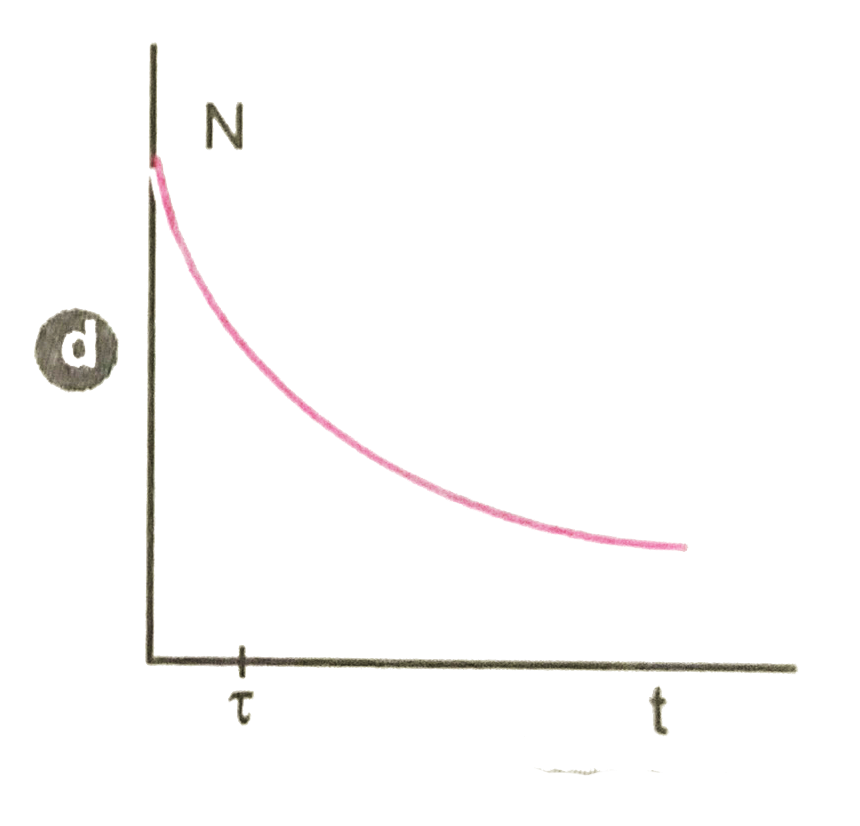
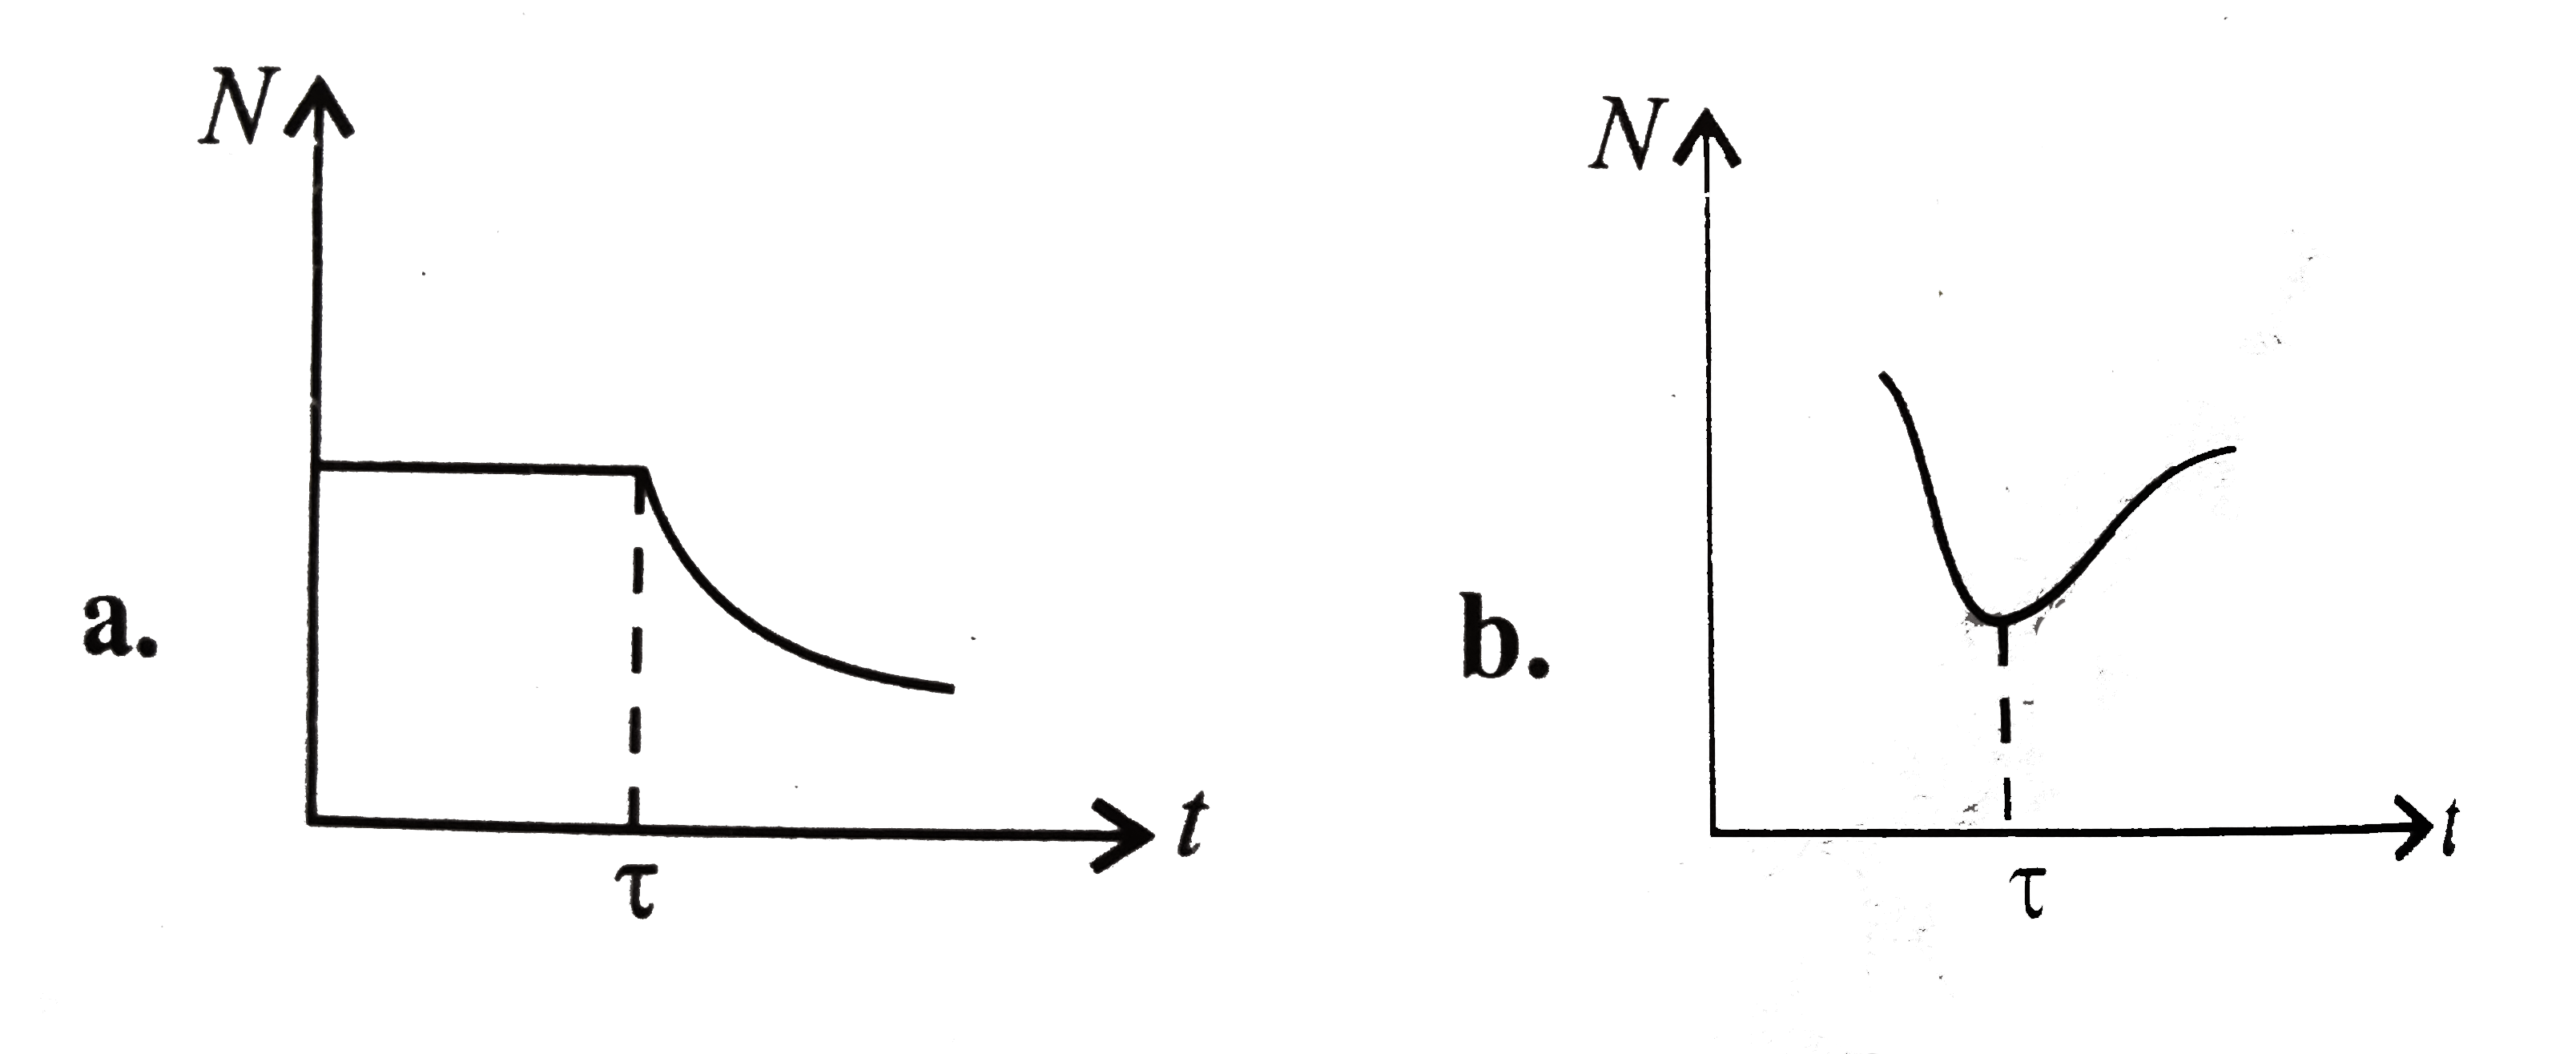
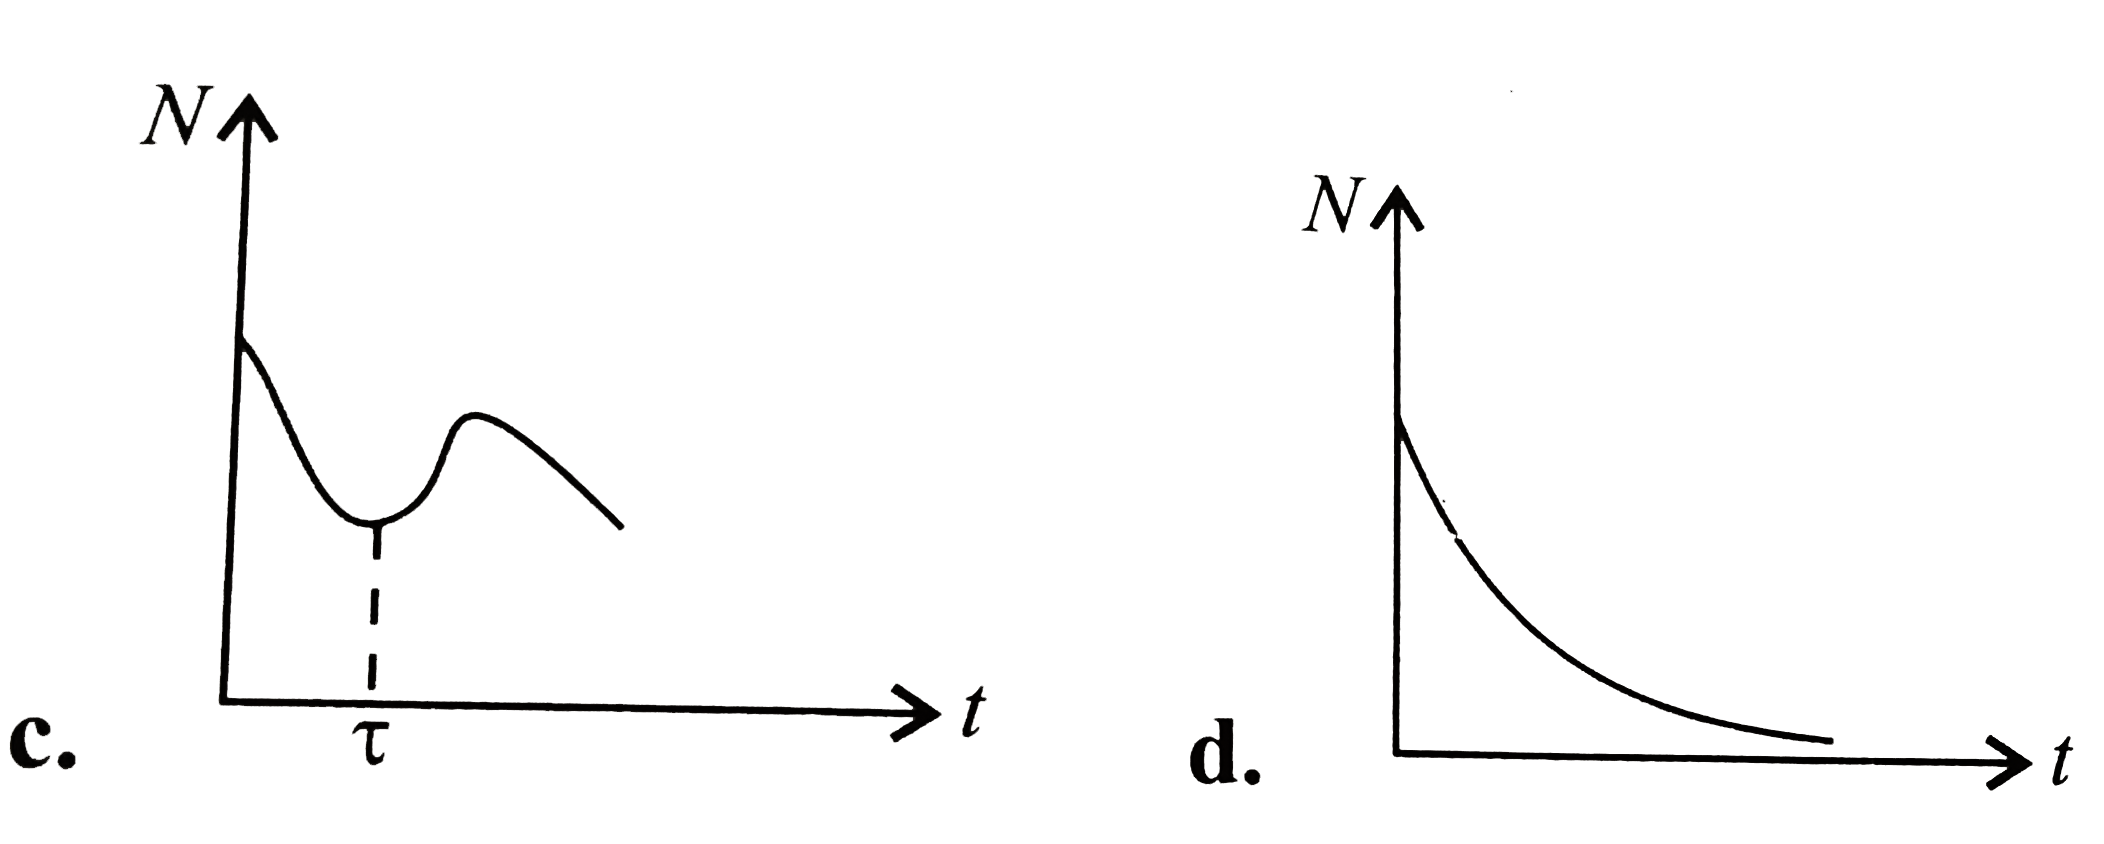
A radioactive sample consists of two distinct species having equal number of atoms initially. The mean life of one species is τ and that of the other is 5τ. The decay products in both cases are stable. A plot is made of the total number of radioactive nuclei as a function of time. Which of the following figure best represents the form of this plot?
(a), (b), (c), (d)

The correct Answer is:D
Both the species of atoms follow exponential decay law, whatever be their life time. Therefore, option (d) is correct.
Topper's Solved these Questions
- BOOK - PRADEEPCHAPTER - ATOMS AND NUCLEIEXERCISE - Fill in the blank 21videos
ATOMS AND NUCLEI
- BOOK - PRADEEPCHAPTER - ATOMS AND NUCLEIEXERCISE - Multiple choice questions 11videos
ATOMS AND NUCLEI
- BOOK - PRADEEPCHAPTER - ATOMS AND NUCLEIEXERCISE - curiocity quetions 31videos
ATOMS AND NUCLEI
- BOOK - PRADEEPCHAPTER - COMMUNICATION SYSTEMSEXERCISE - MODEL TEST PAPER-29videos
COMMUNICATION SYSTEMS
Similar Questions
A radioactive substance consists of two distinct having equal number of atoms initially. The mean products in both cases are stable. A plot is made of total number of radioactive nuclei as a function of time. Which of the following figures best represents the form of this plot?
 View Solution
A radioactive sample is a mixture of two radioactive species – one having population N1has a mean life of T1 and the other one having population N2 has nuclei having mean life of t2. Find the effective mean life of the nuclei in the mixture.
View Solution
Knowledge Check
- Question 1 - Select One
A radicactive sample consider of two distinct species having equial number initially . The mean life time of one species is τ and that of the other is 5τ . The decay prodects in both cases are stable . A plot is made of the total number of radioactive nuclei as a function of time , which of the following figure best represent the from of this plot?
A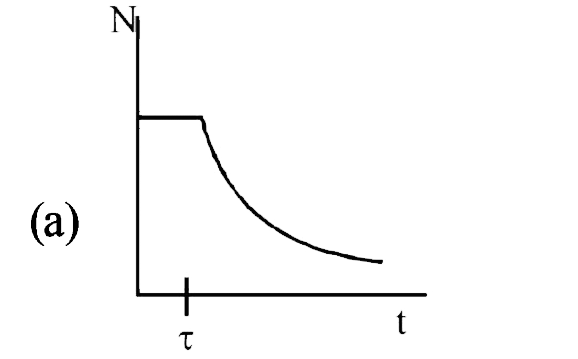 B
B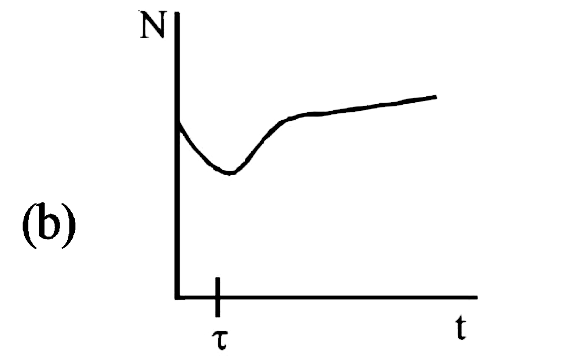 CD
CD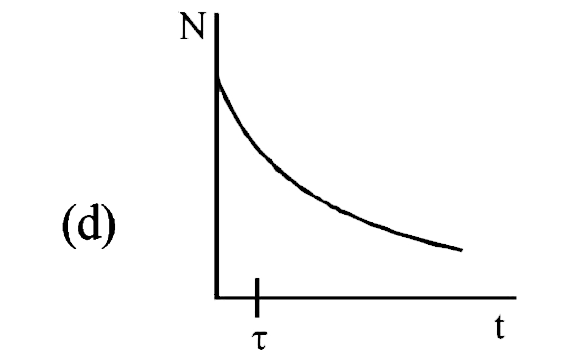
- Question 2 - Select One
The rate of decay (R) of nuclei in a radioactive sample is plotted against time (t). Which of the following best represents the resulting curve ?
A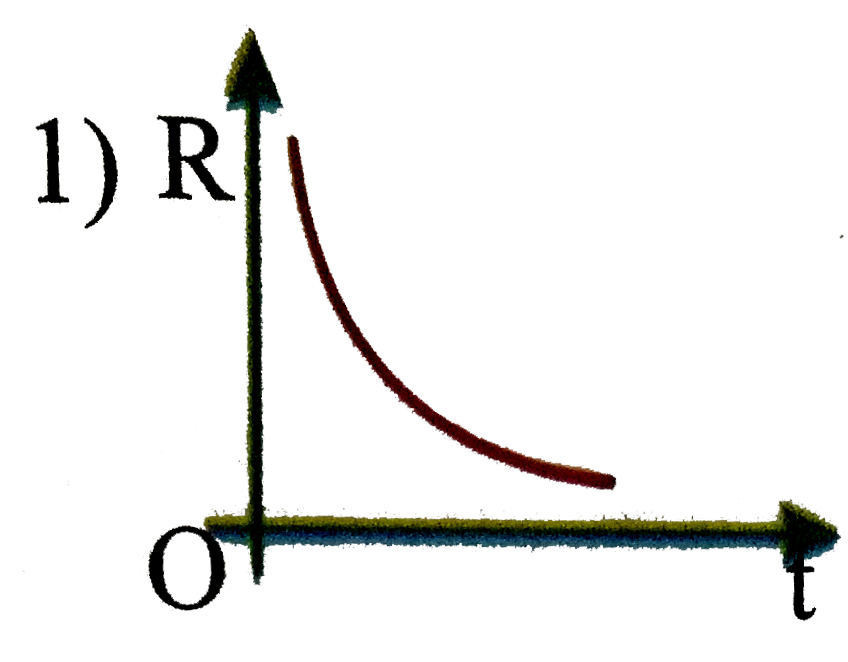 B
B C
C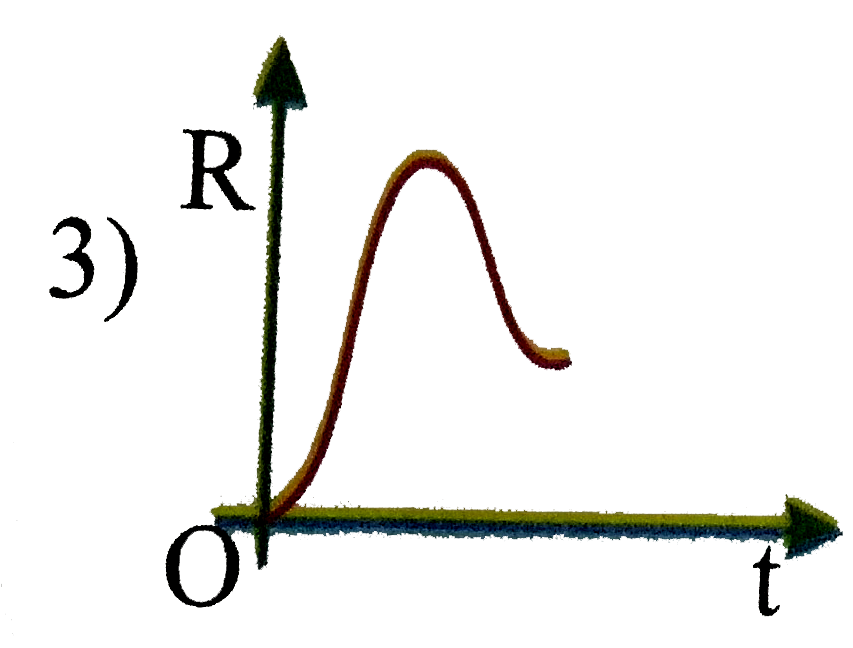 D
D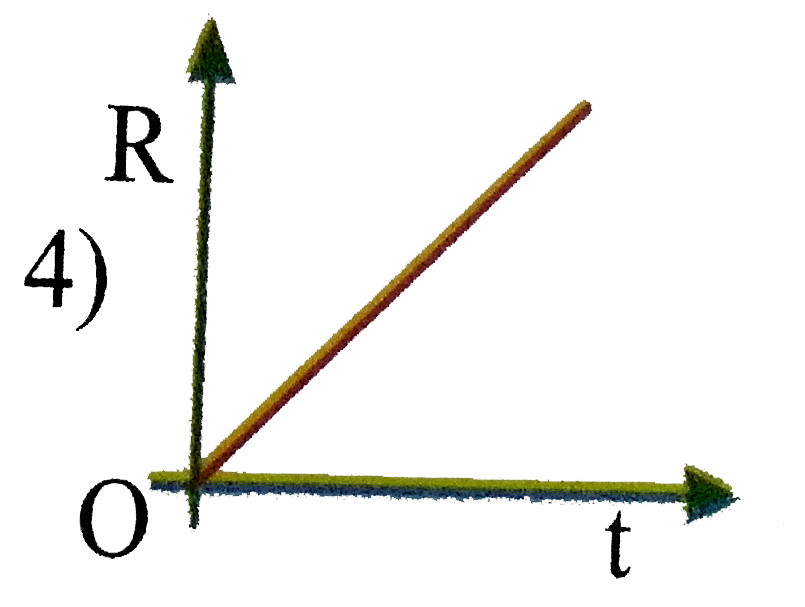
- Question 3 - Select One
The rate of decay (R) of nuclei in a radioactive sample is plotted against time (t). Which of the following best represents the resulting curve ?
A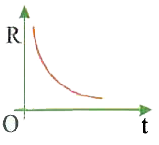 B
B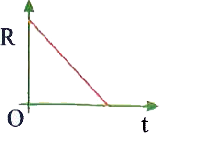 C
C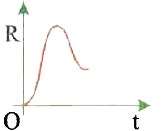 D
D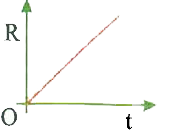
A stable nuclei C is formed from two radioactive nuclei A and B with decay constant of λ1 and λ2 respectively. Initially, the number of nuclei of A is N0 and that of B is zero. Nuclei B are produced at a constant rate of P. Find the number of the nuclei of C after time t.
View SolutionA radioactive sample consists of two isotopes one of then decays by α− emission with a half life of τ1=405s and the other one decays by β emission with half life of τ1=1620s.Attimet=0,probabilitiesof≥∈galphaandbetapartic≤somthesamp≤areequal.<br>(a)Ifapartic≤comingoutofthesamp≤isdetectedatt=1620s,wˆistheprobabilitytˆitisalphapartic≤?<br>(b)F∈dthetimewhen→talνmberofsurviv∈gνc≤iishalfthe∈itialquantity.<br>GivenIfx^(4)+4x-2.5=0thenx=0.59<br>"log"_(10)2=0.301, "log"_(10)5.9=0.774
View SolutionTwo' radioactive samples X and Y having half life 3 years and 2 years, respectively, havẻ been decaying for many years. Today both samples have equal number of atoms. After how many years the number of atoms in the sample X will be twice of the number of atoms in the sample Y ?
View SolutionTwo radioactive substances A and B have half lives of T and 2T respectively. Samples of a and b contain equal number of nuclei initially. After a time 4T, the ratio of the number of undecayed nuclei of A to the number if undecayed nuclei of A to the number of undeacyed nuclei of B is
View SolutionTwo species of radioactive atoms are mixed in equal number. The disintegration of the first species is λ and of the second is λ/3. After a long time the mixture will behave as a species with mean life of approximately
View Solution
