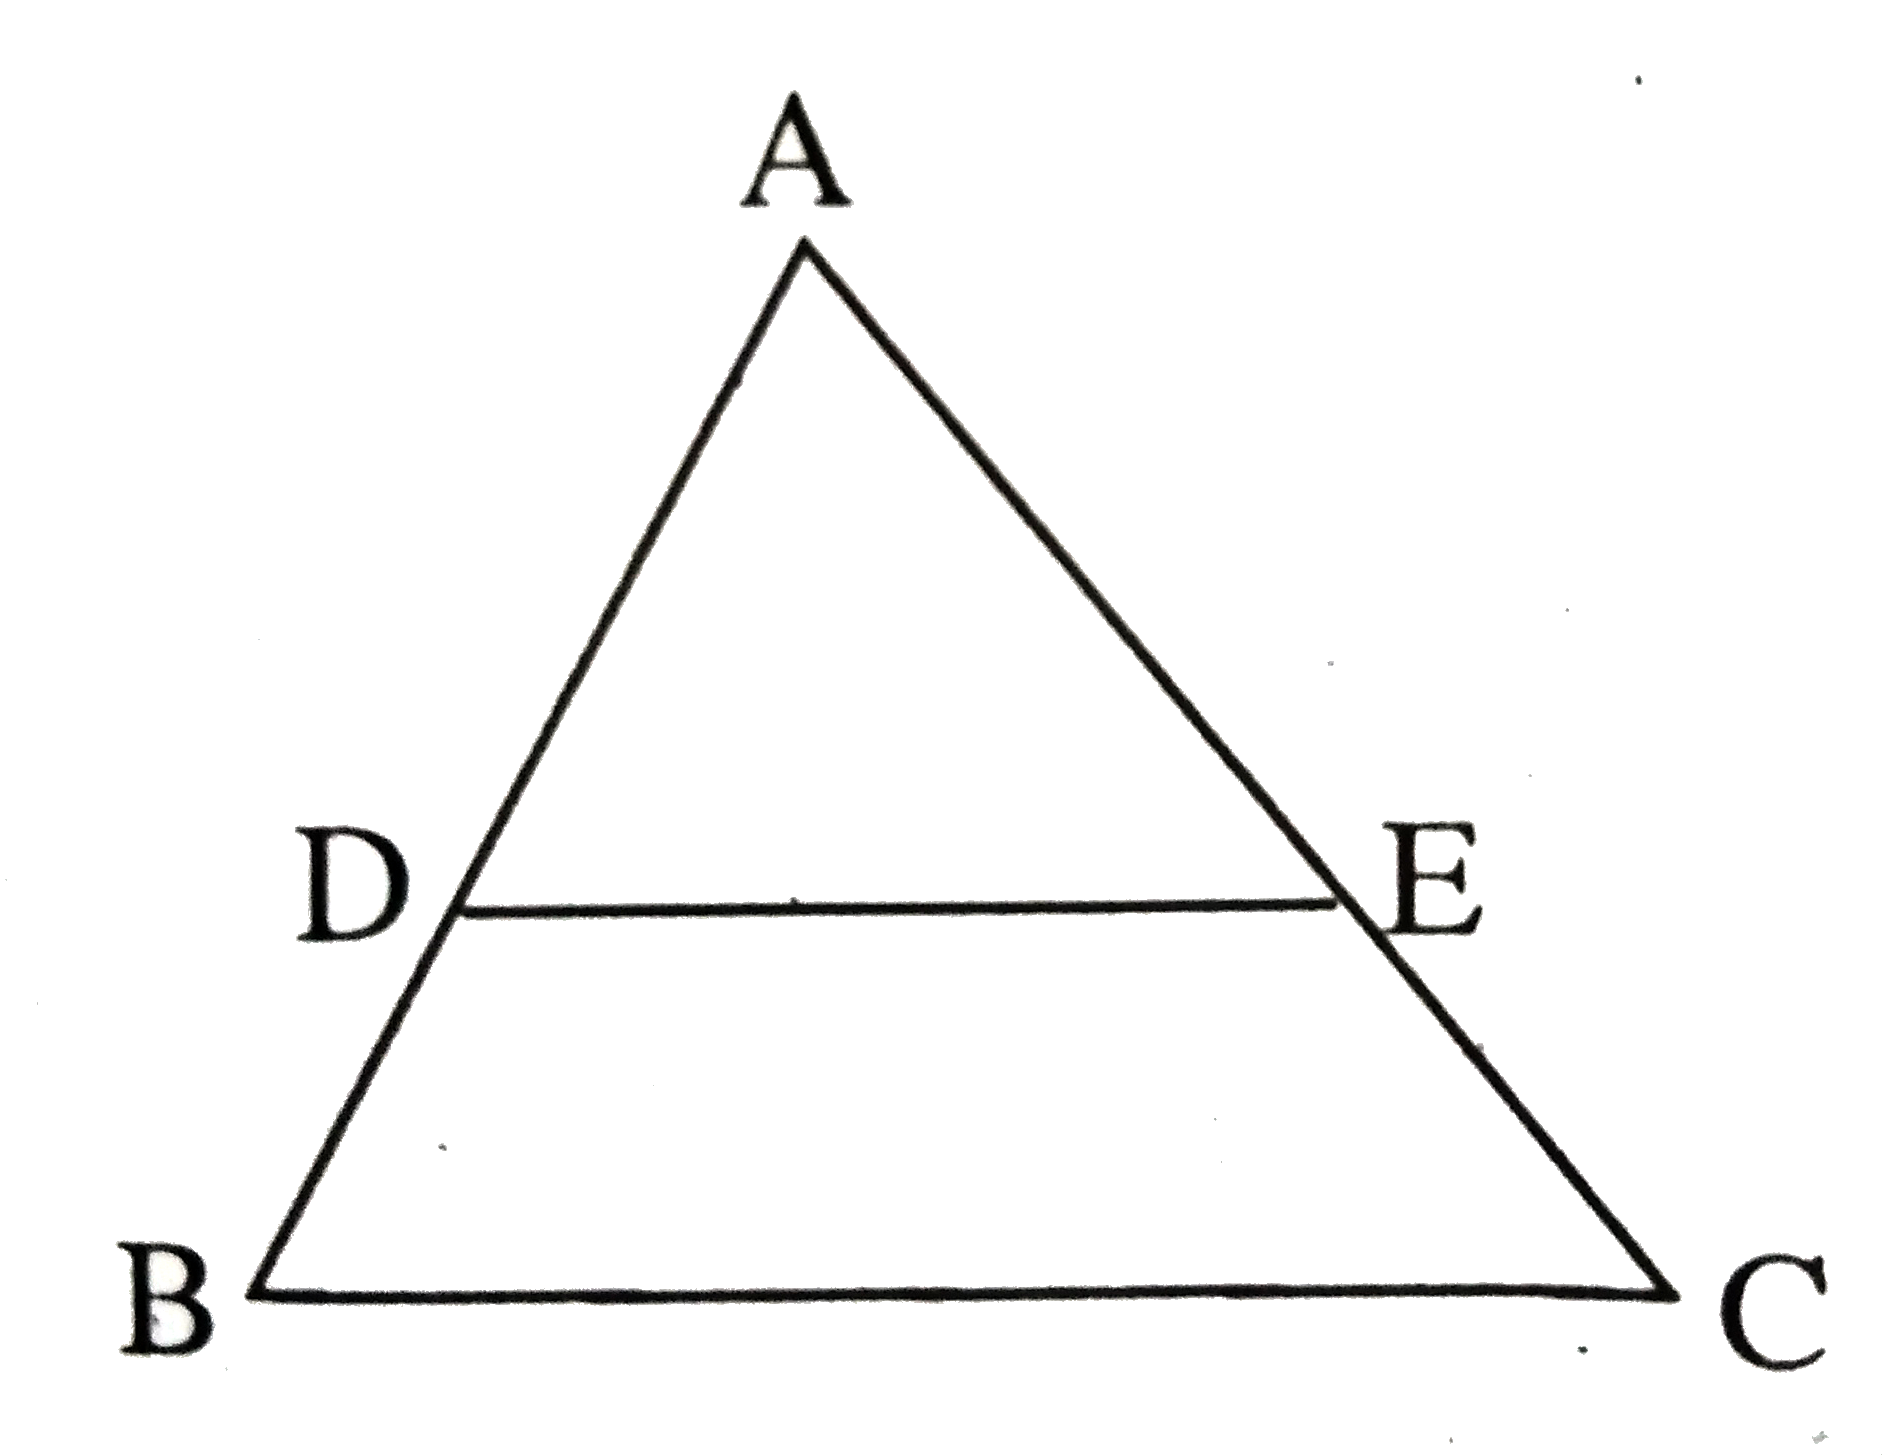
In the adjoining figure if DE∣∣BC, then ABBD=ACCE.
 Solution in Bengali
True, since DE∣∣BC, ∴ by Thales' theorem , ADBD=AECE
or, AD+BDBD=AE+CECE or , ABBD=ACCE.
Topper's Solved these Questions
- BOOK - CALCUTTA BOOK HOUSECHAPTER - SIMILARITYEXERCISE - Exercise 5.132videos
SIMILARITY
- BOOK - CALCUTTA BOOK HOUSECHAPTER - SIMILARITYEXERCISE - Exercise 5.227videos
SIMILARITY
- BOOK - CALCUTTA BOOK HOUSECHAPTER - SAMPLE QUESTIONS PAPERSEXERCISE - QUESTION157videos
SAMPLE QUESTIONS PAPERS
- BOOK - CALCUTTA BOOK HOUSECHAPTER - SIMPLE INTERESTEXERCISE - Long-answer type questions37videos
SIMPLE INTEREST
Similar Questions
In the following figure , ∠P=
 01:37View Solution
In ΔPQR and ΔDEF, PQDE=QREF=RPFD. Then which one of the following is correct?
02:11View SolutionA person deposite ₹ 100 in a bank and after 2 yars he got a total ₹121 as a return. Then the componund interest of the bank per annum is
01:31View SolutionGoutam took a loan of some money from a cooperative bank for opening a poultry farm at the rate of simple interest of 12% per annum. Every month he has to repay 378Rs as interest. Determine the loan amount taken by him.
02:46View SolutionHow many lines of symmetry does the above figure have ?
02:45View SolutionDetermine the point of symmetry of a regular hexagon.
02:17View SolutionDtermine the images of the following figure about the given line :
05:41View SolutionIn the figure above (not to scale), ¯¯¯¯¯¯AB⊥¯¯¯¯¯¯CDandAD is the bisector of ∠BAE.AB=3cm and AC=5cm. Find CD.
02:21View SolutionMatch the following Column A to Column B
 02:03View Solution
Match the following Column A to Column B
 02:10View Solution
Match the following Column A to Column B
 02:17View Solution
Find the area of the figure given below.
 02:10View Solution
The area of the shaded part in the figure given below is ______.
 04:23View Solution
The inequation represented by the graph given below is :
01:13View SolutionThe inequation that best describes the graph given below is _________
01:59View SolutionThe inequation that best describes the following graph is _________
01:19View Solution

