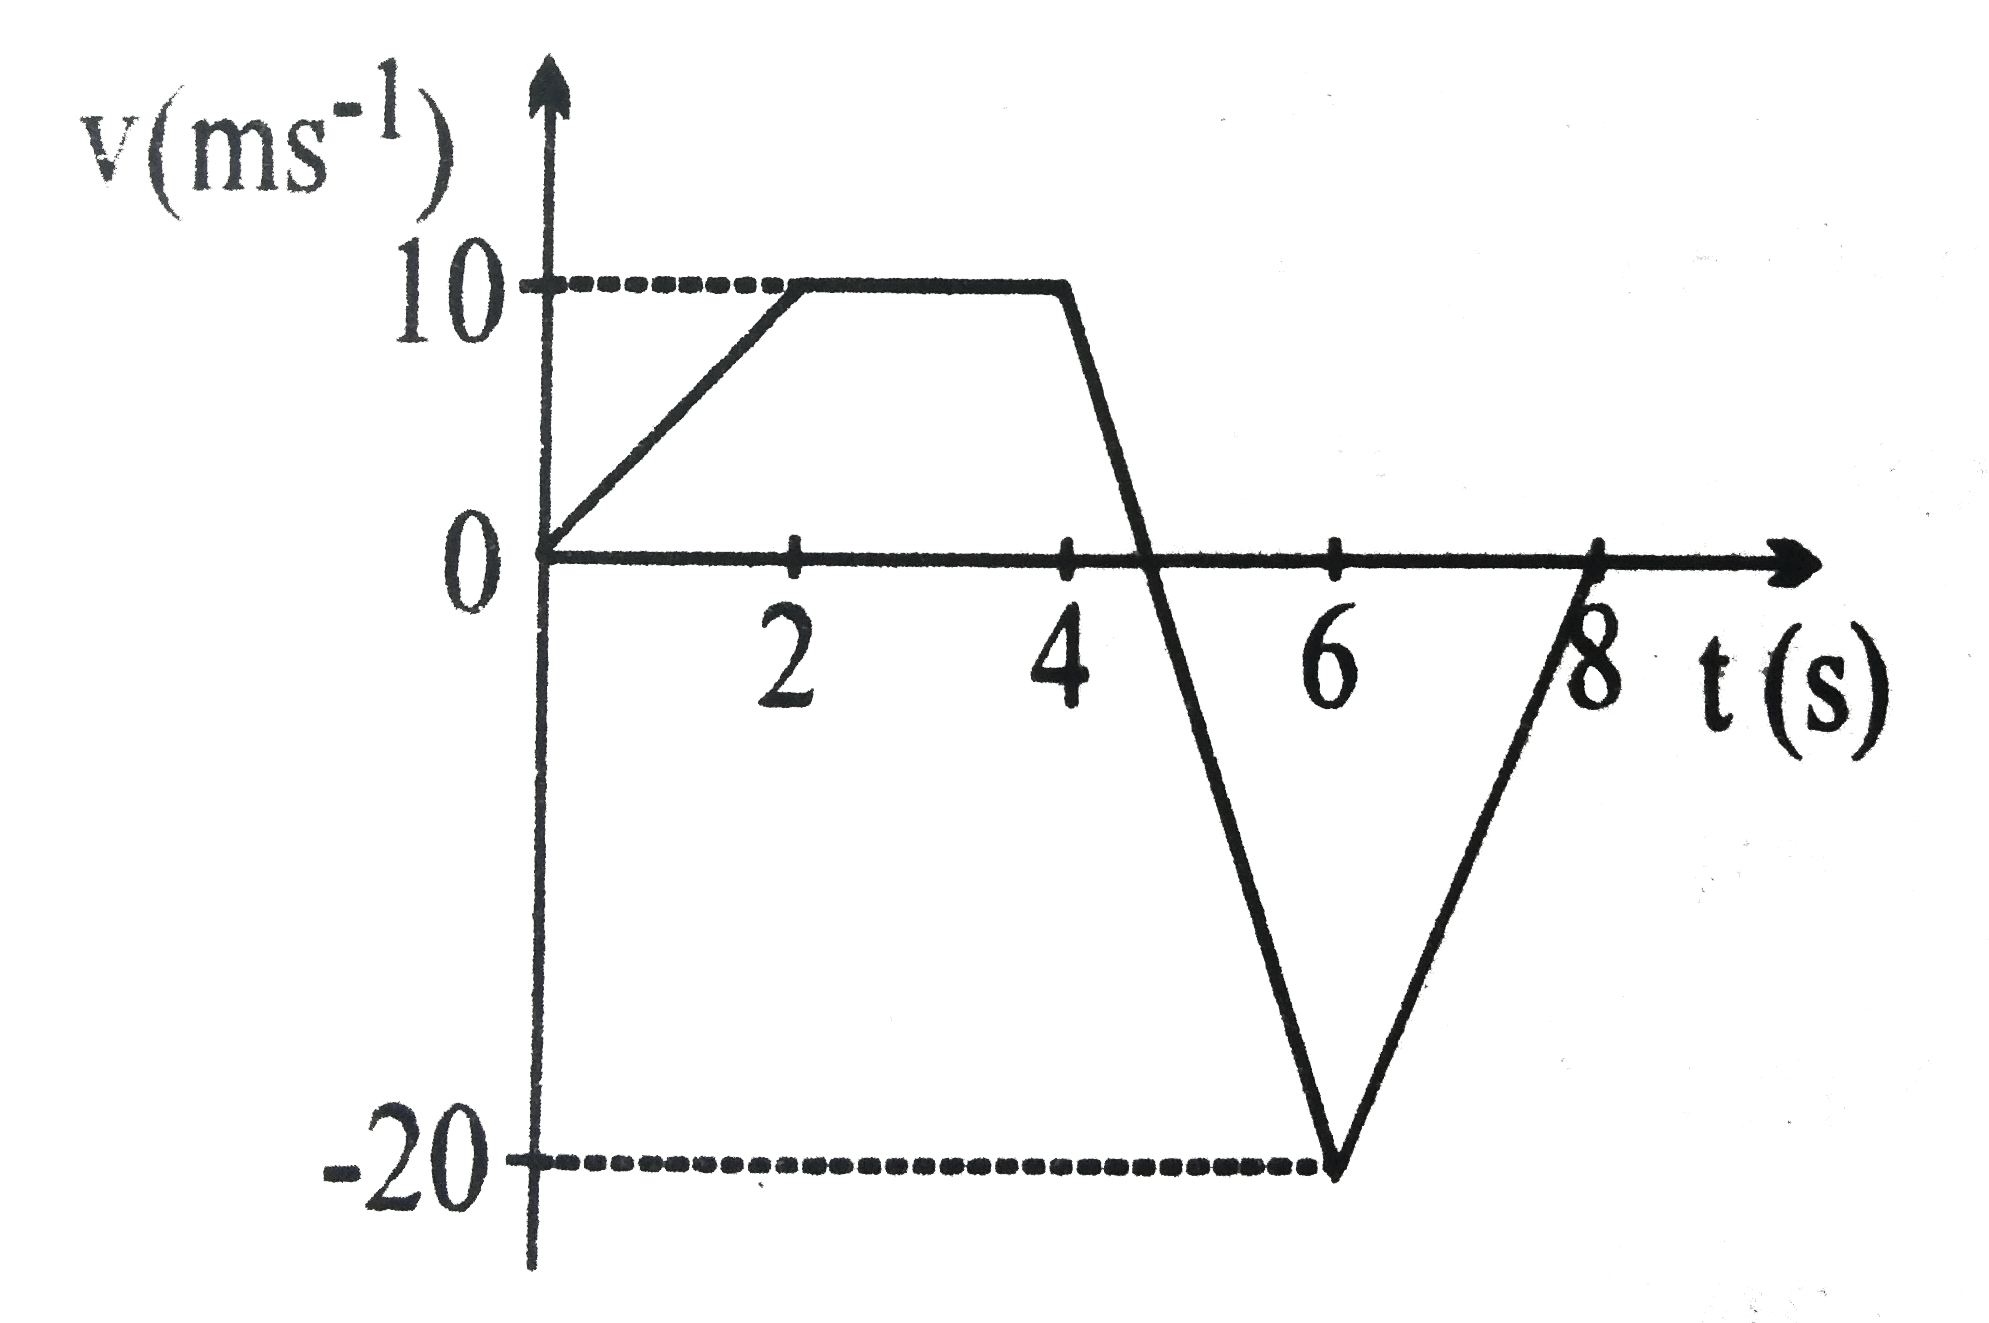
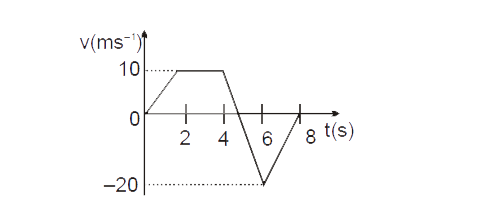
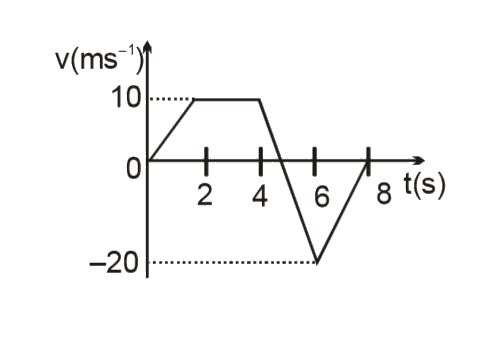
The figure shows a velocity-time graph of a particle moving along a straight line
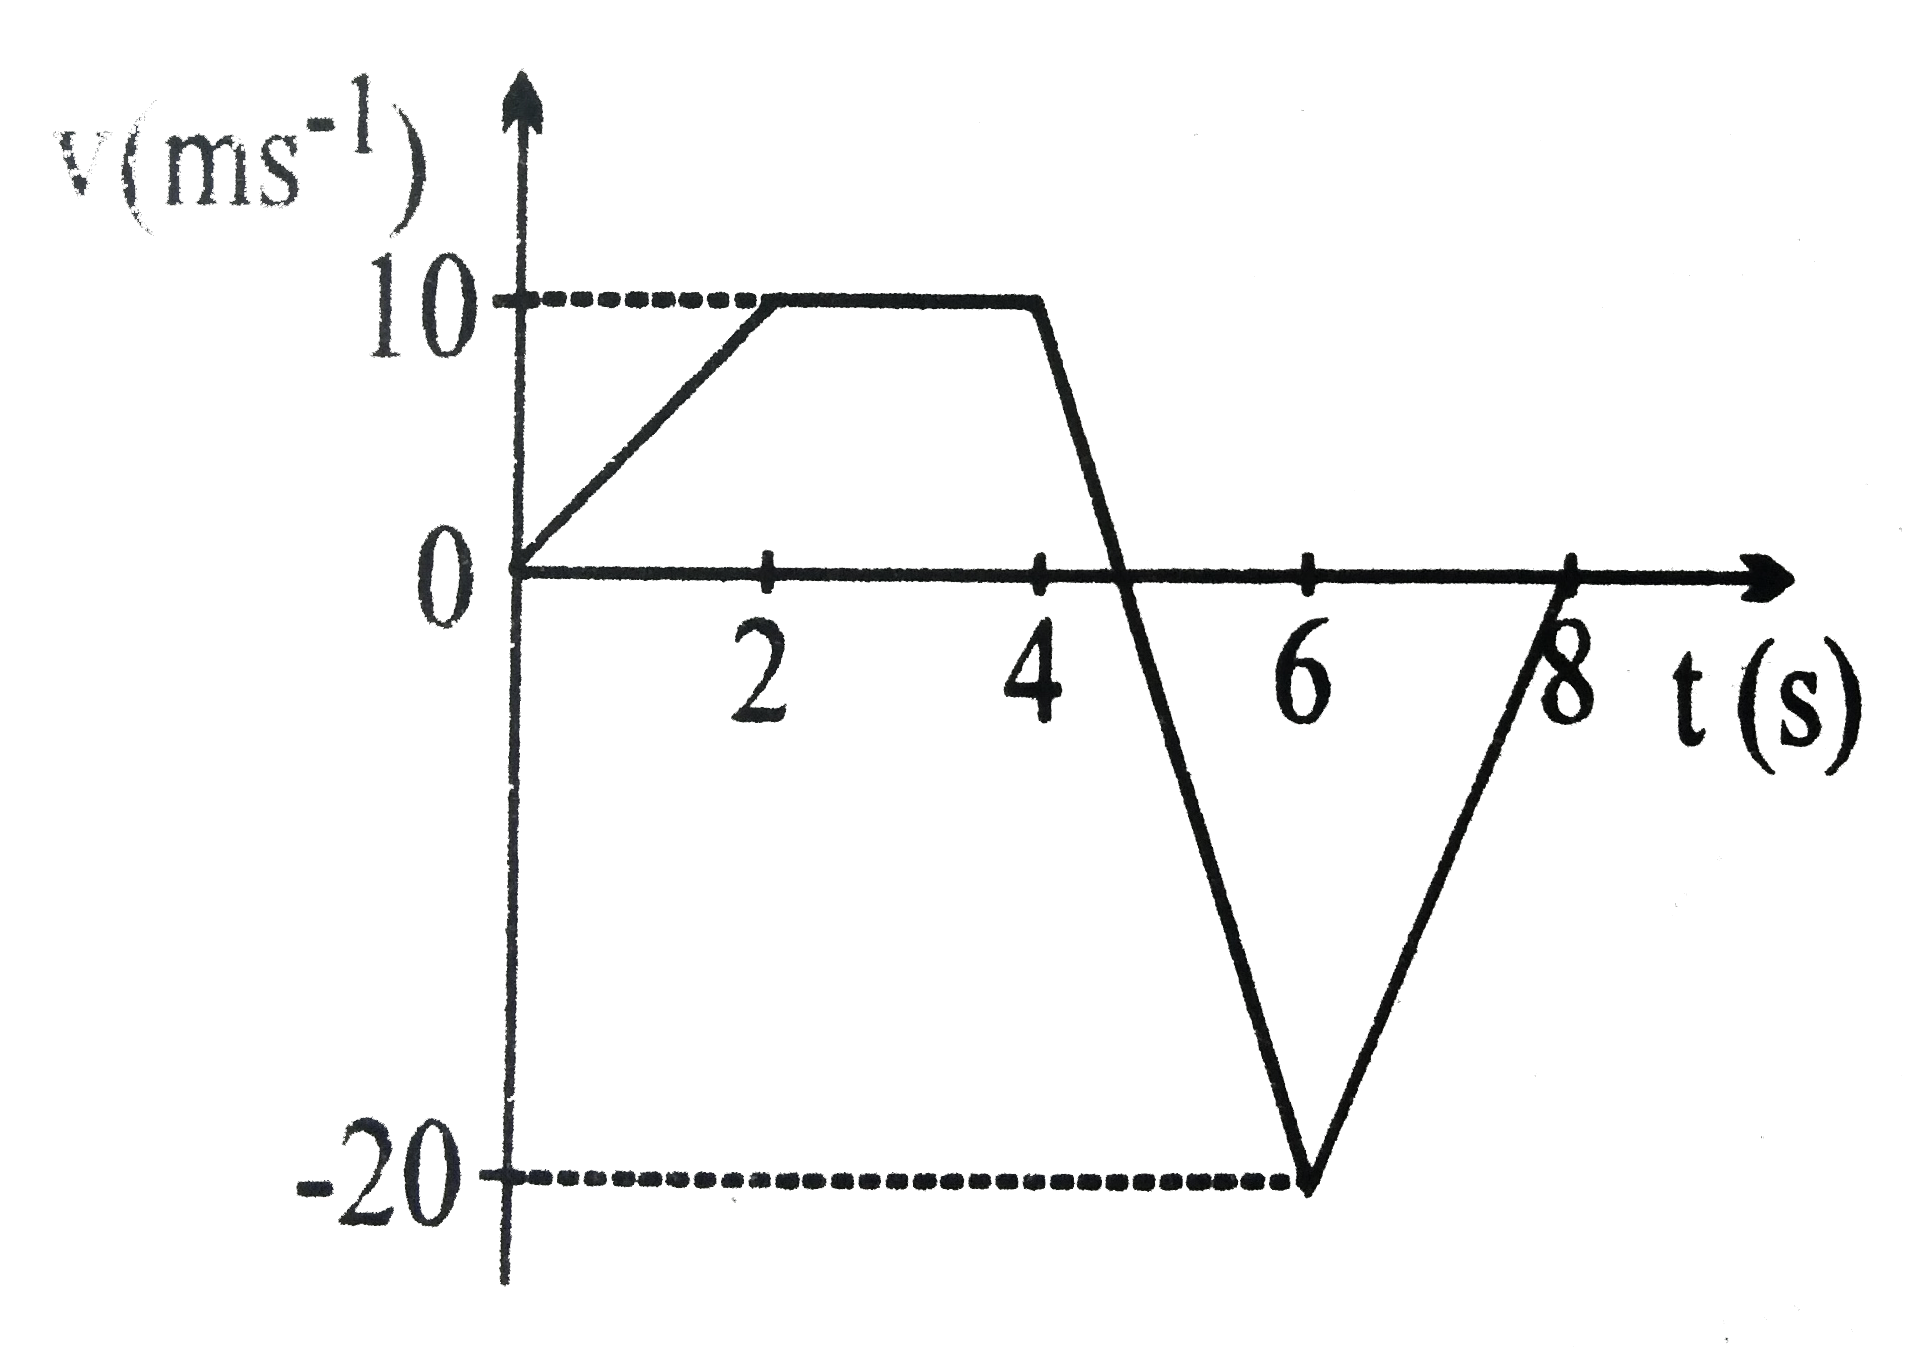
Identify the region in which the rate of change of velocity ∣∣∣Δ→vΔt∣∣∣ of the particle is maximum
A
0 to 2s
B
2to 4s
C
4 to 6s
D
6 to 8s
Video Solution
Text Solution
The correct Answer is:C
[Δ→vΔt]max= where slope is max.
Which is max. in region 4 to 6s
|
Similar Questions
Knowledge Check
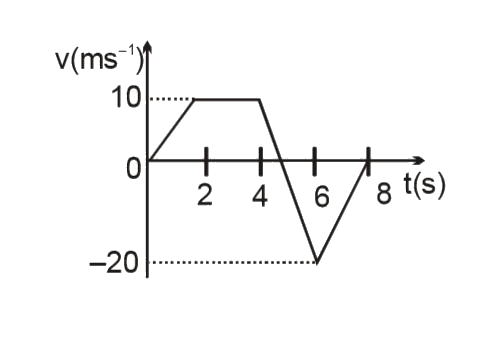
The figure shows a velocity-time graph of a particle moving along a straight line
Q. Identify the region in which the rate of change of velocity ∣∣∣Δ→vΔt∣∣∣ of the particle is maximumA0 to 2sB2 to 4sC4 to 6sD6 to 8sThe figure shows a velocity-time graph of a particle moving along a straight line
Identify the region in which the rate of change of velocity ∣∣∣Δ¯vΔt∣∣∣ of the particle is maximumA0 to 2sB2 to 4sC4 to 6sD6 t 8 sThe figure shows velocity-time graph of a particle moving along a straight line. Identify the correct statement.
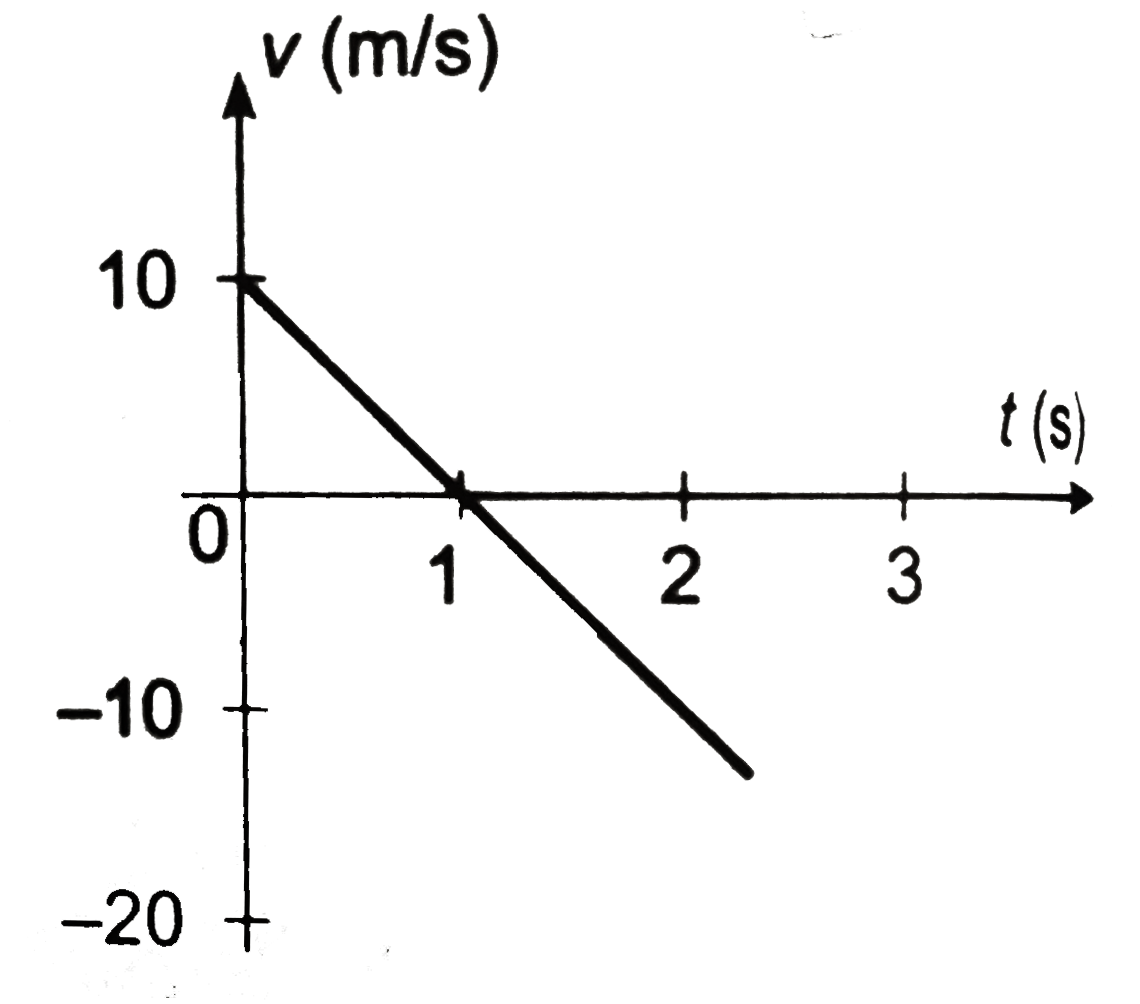 AThe particle starts from the originBThe particle crosses it initial position at t=2sCThe average speed of the particle in the time interval, 0≤t≤2s is zeroDAll of the above
The figure shows a velocity-time graph of a particle moving along a straight line
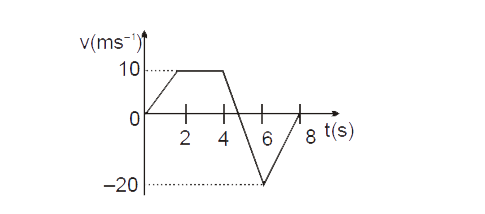
The total distance travelled by the particle is
View SolutionThe figure shows a velocity-time graph of a particle moving along a straight line
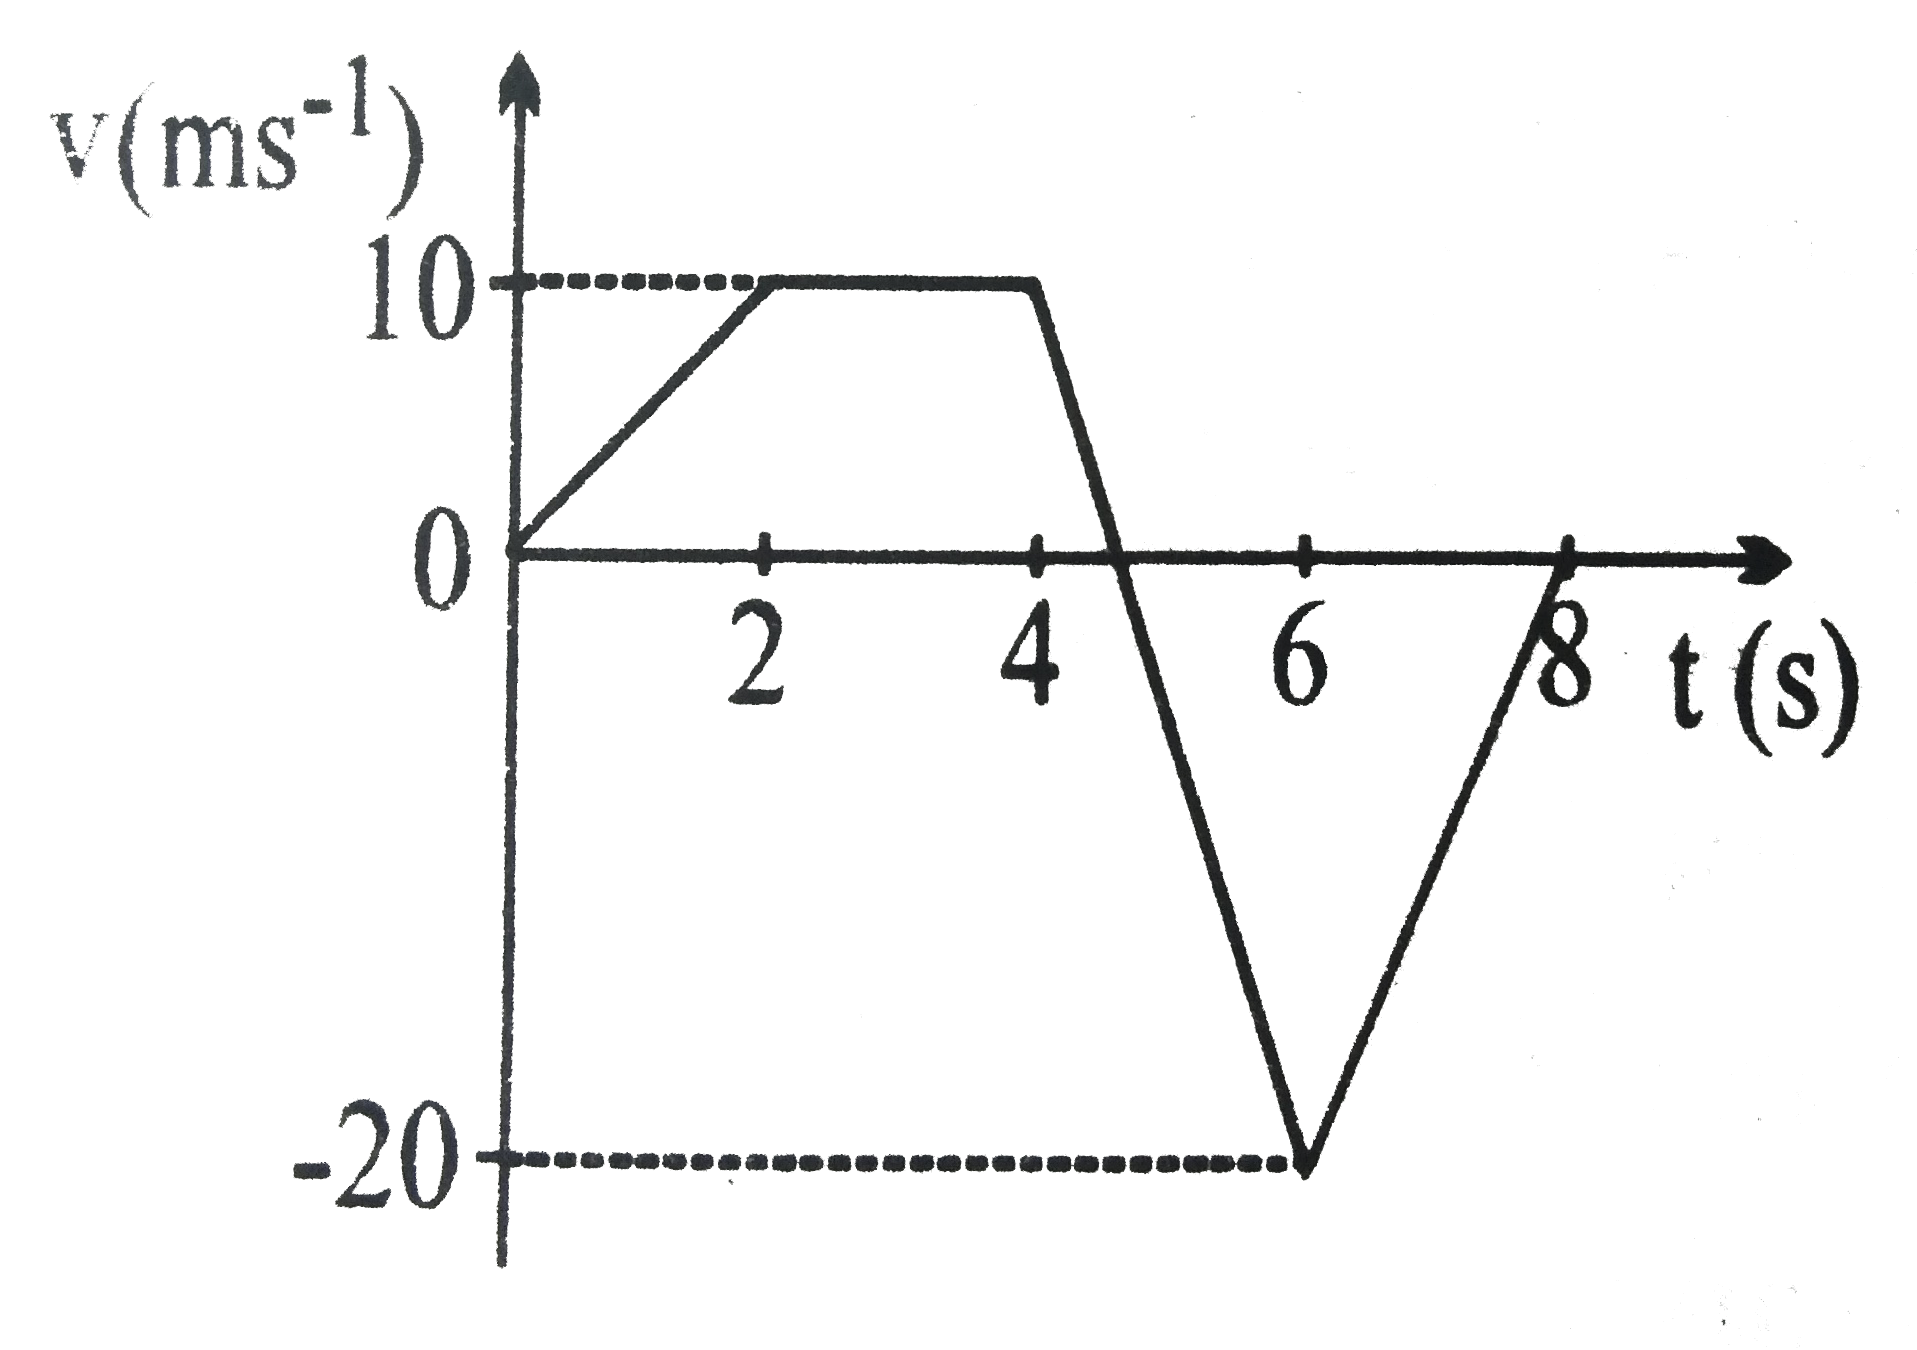
The total distance4 travelled by the particel is
View SolutionThe figure shows a velocity-time graph of a particle moving along a straight line
Q. The maximum of displacement of the particle is
View SolutionThe figure shows a velocity-time graph of a particle moving along a straight line
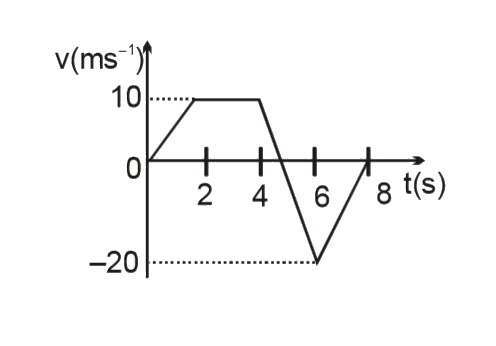
Q. The total distance travelled by the particle is
View SolutionThe velocity- time plot for a particle moving on a straight line is shown in the figure
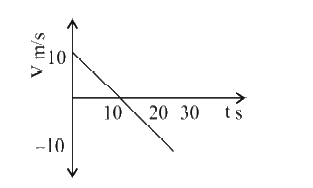
View Solution

