The graphs in fugure show that a quantity Y varies with displacement d in a system undergoing simple harmonic motion.
(I)  ,
, 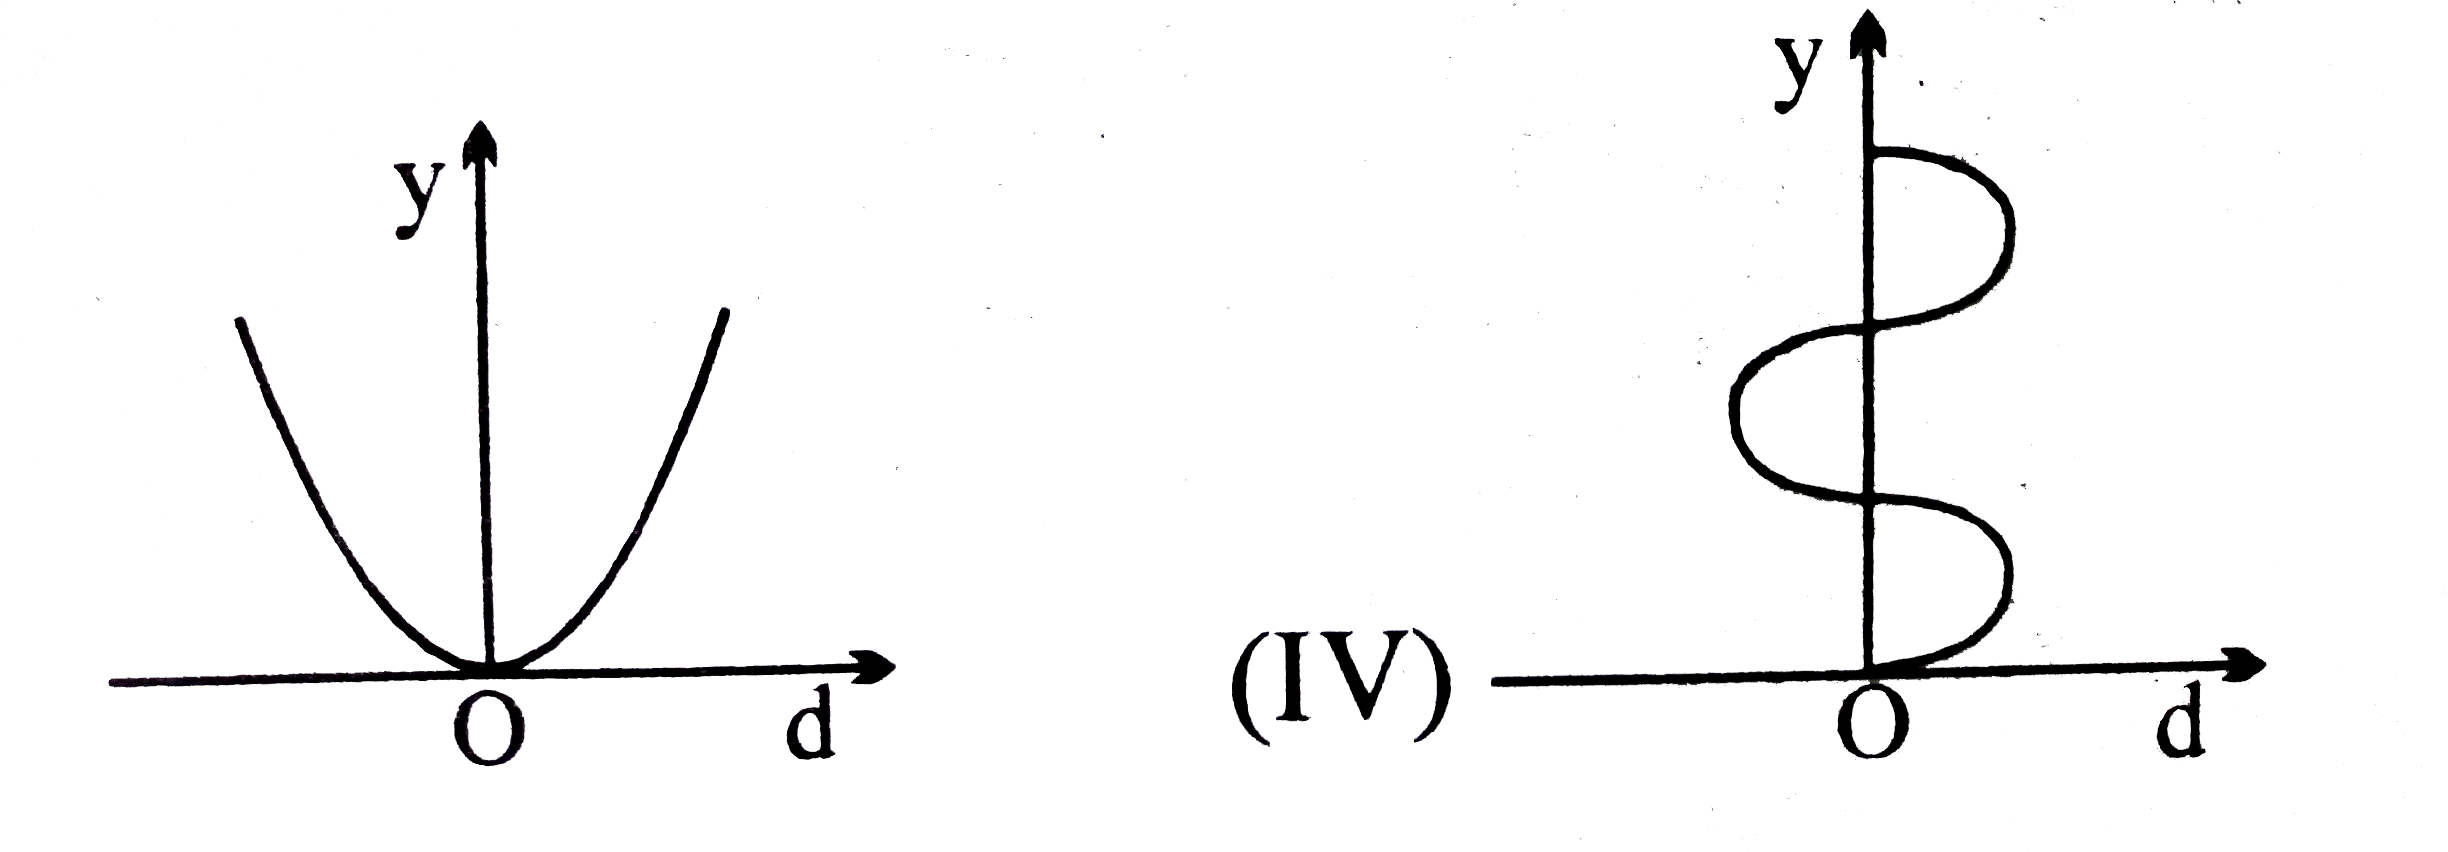
The time
A
I
B
II
C
III
D
IV
Video Solution
Text Solution
The correct Answer is:D
Figure
|
Similar Questions
Knowledge Check
The graphs in fugure show that a quantity Y varies with displacement d in a system undergoing simple harmonic motion.
(I) ,
, 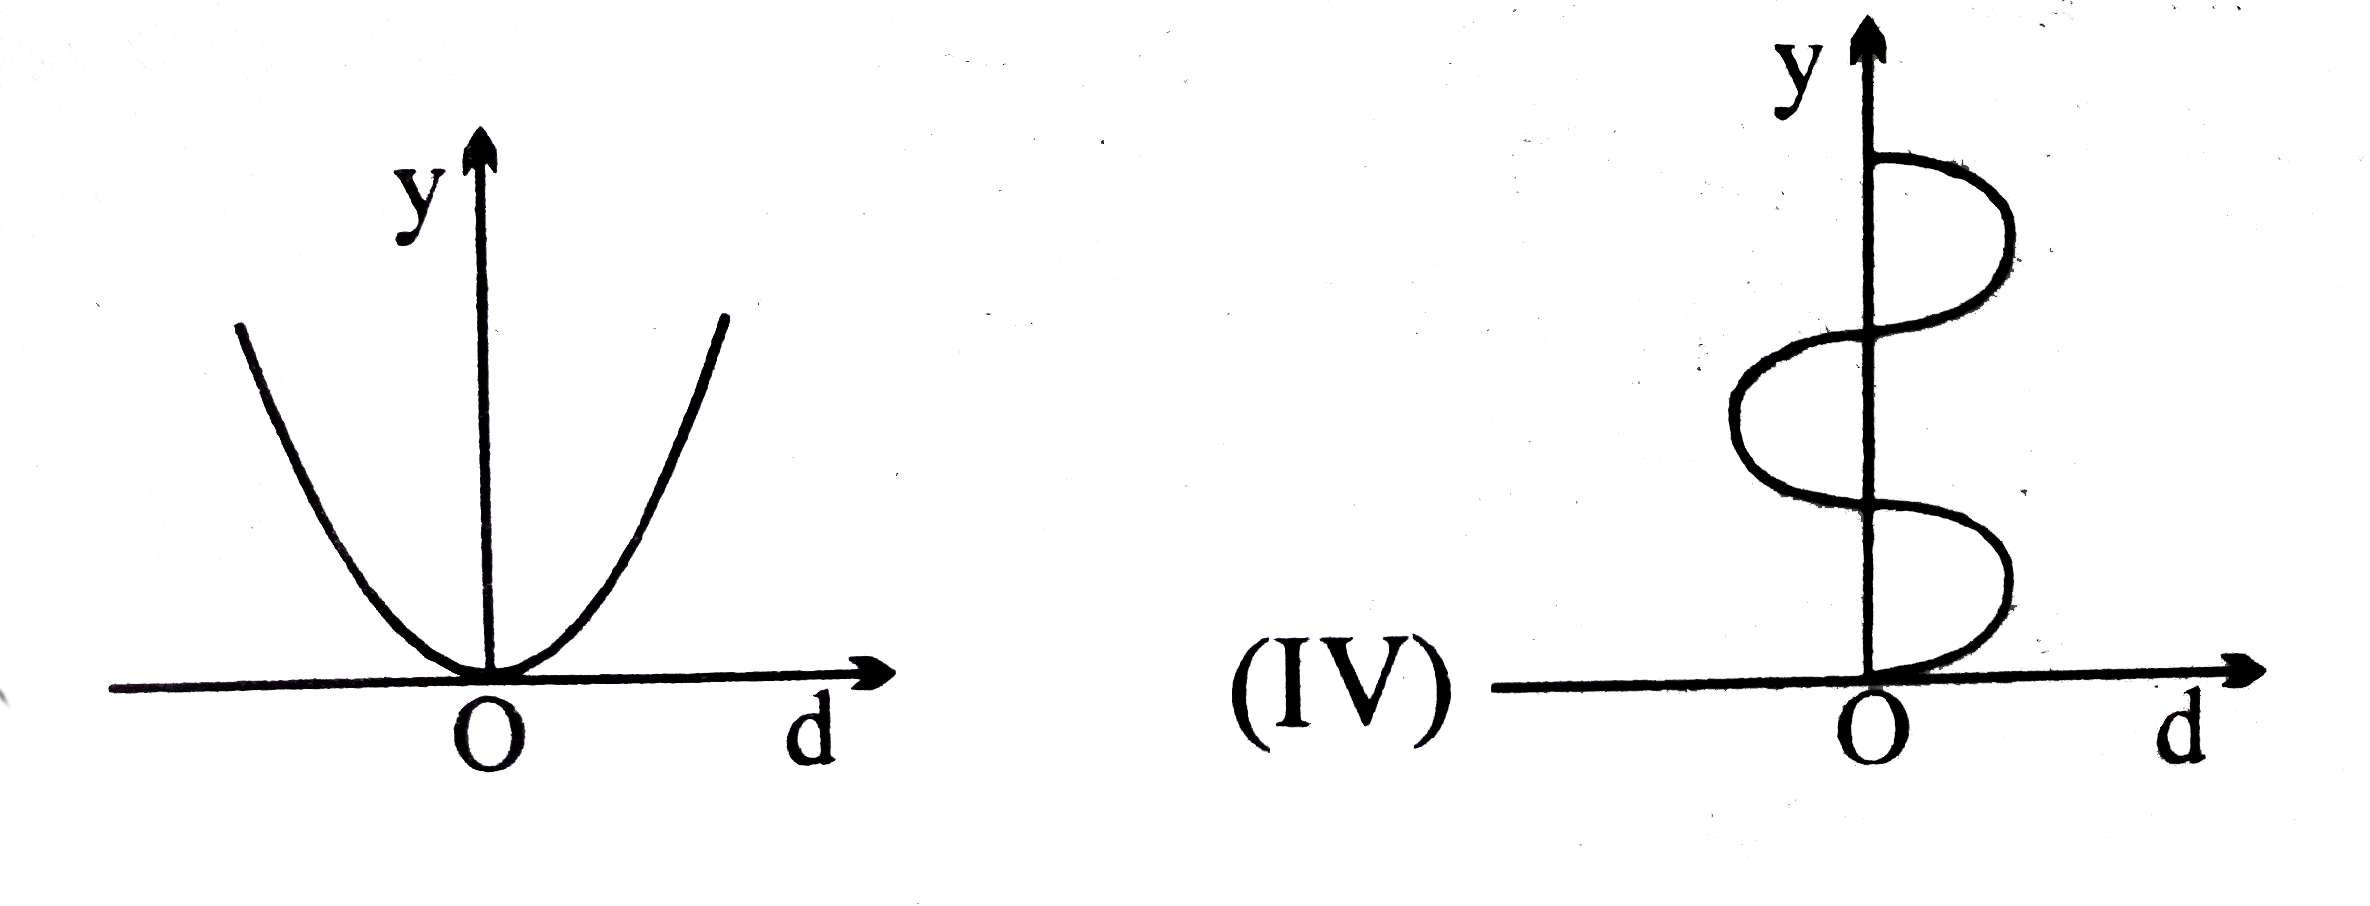
The unbalanced force acting on the system.AIBIICIIIDNoneThe graphs in fugure show that a quantity Y varies with displacement d in a system undergoing simple harmonic motion.
(I)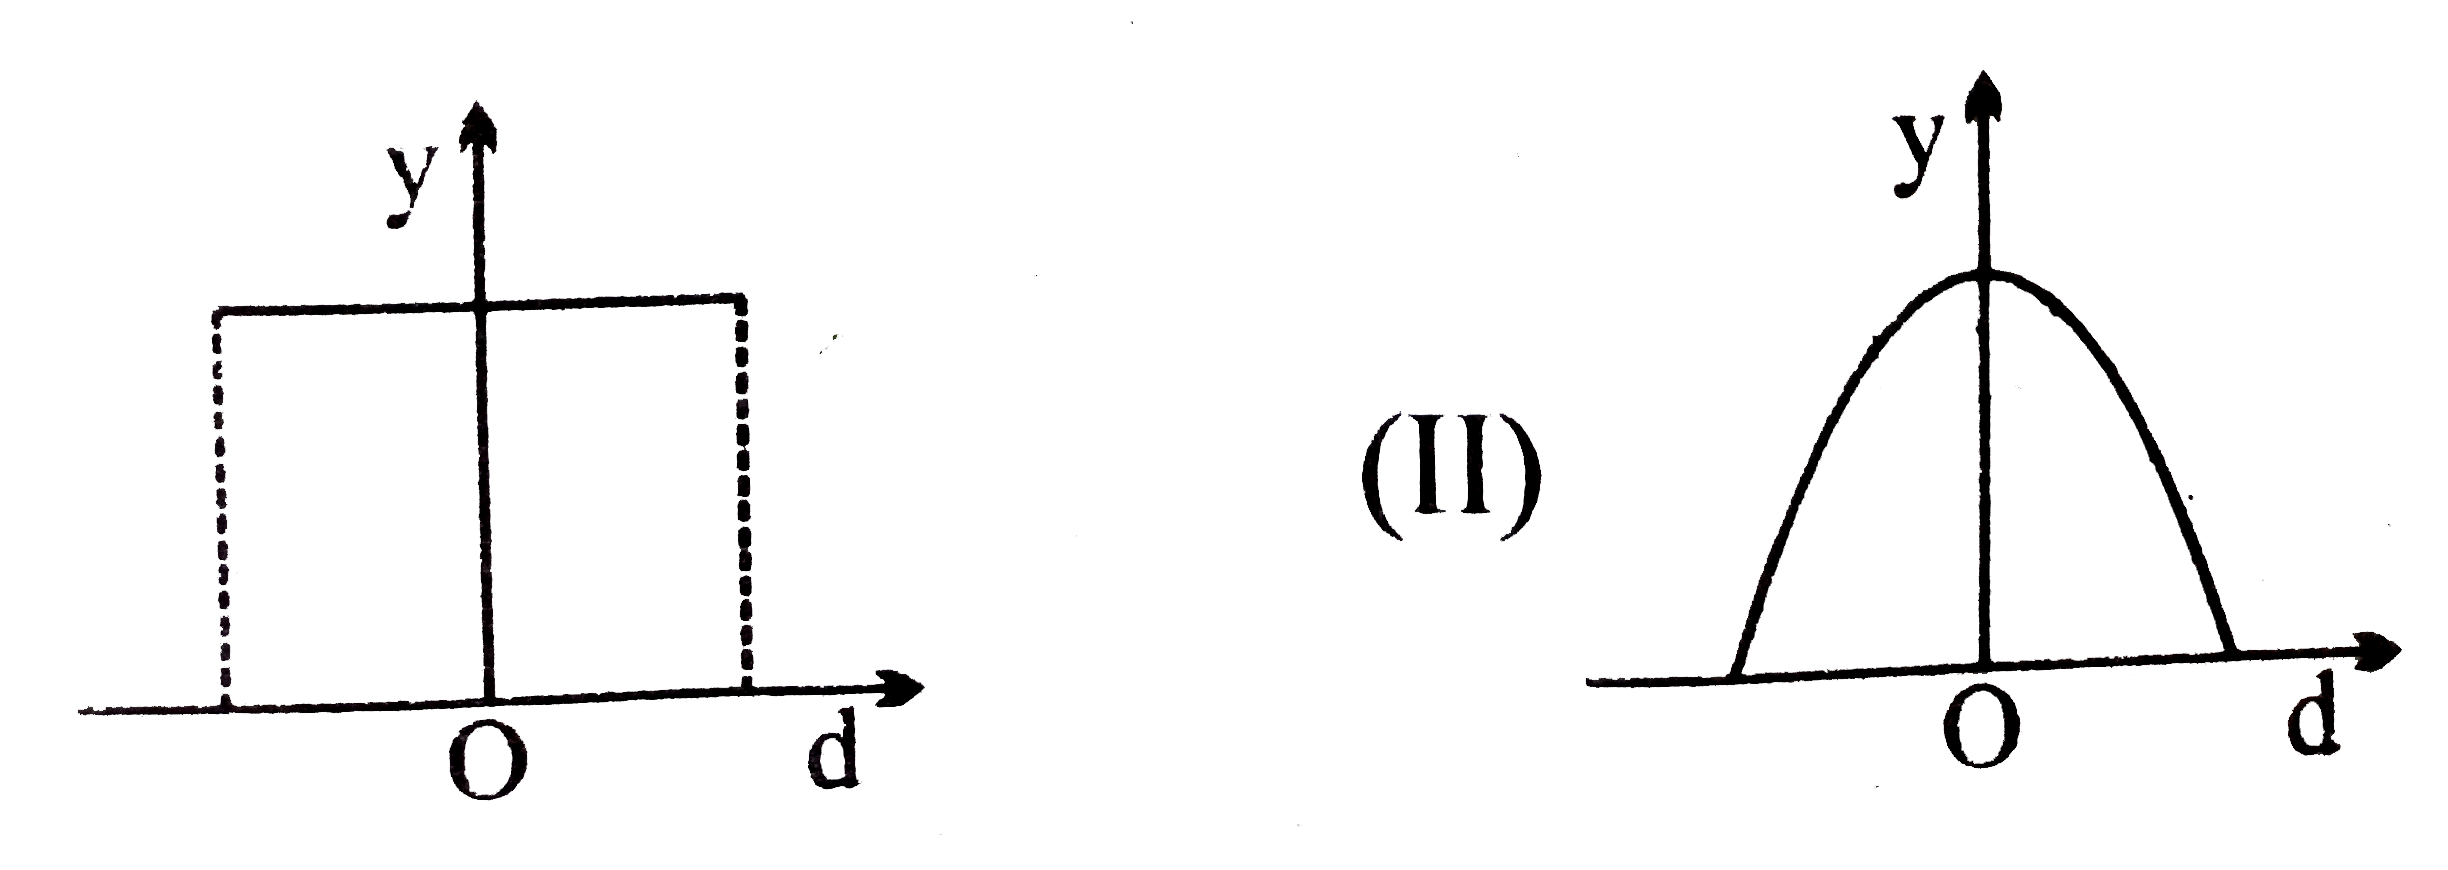 ,
, 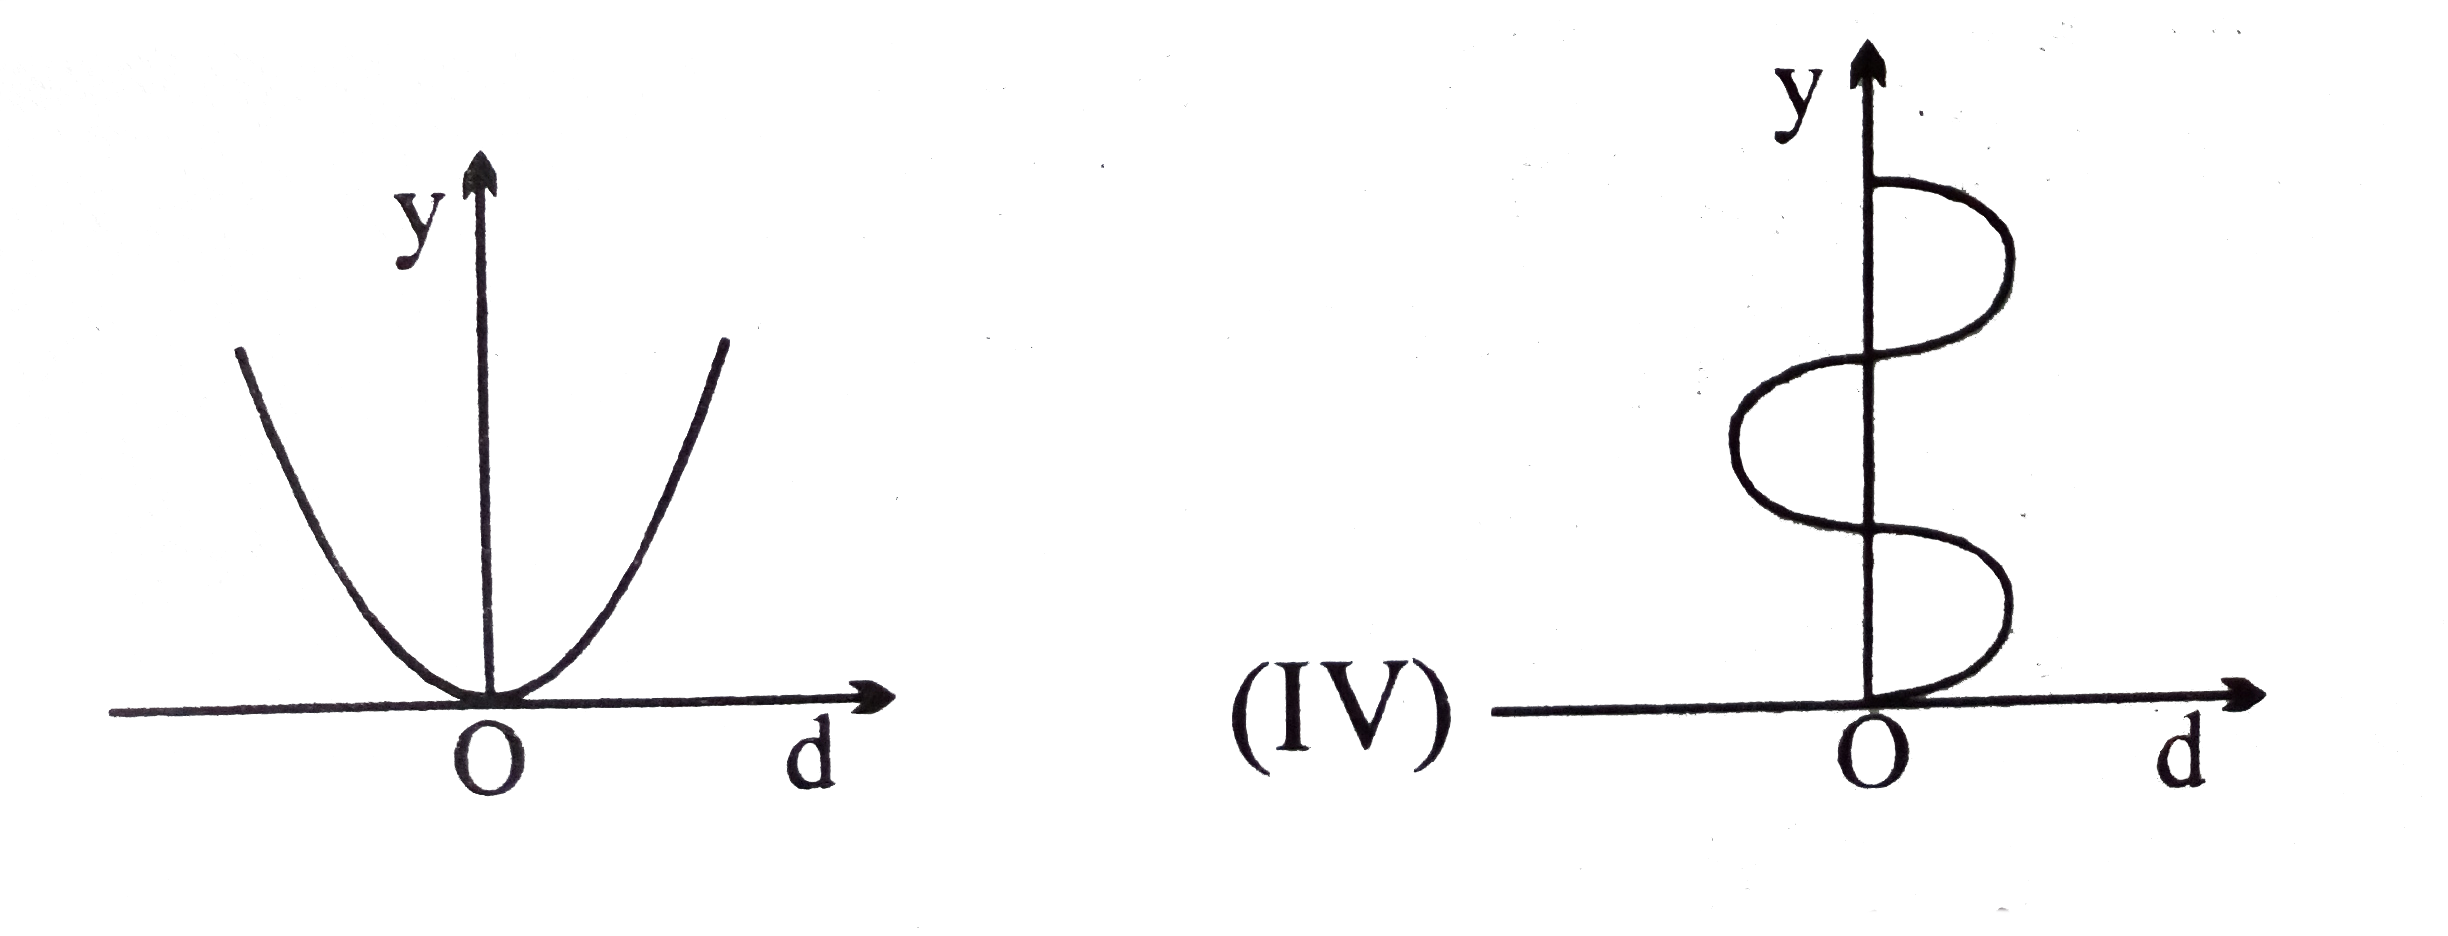
Which graphs best represents the relationship obtained when y is
The total energy of the systemAIBIICIIIDIVThe total energy of a particle having a displacement x, executing simple harmonic motion is
A∝xB∝x2Cindependent of xD∝x1/2
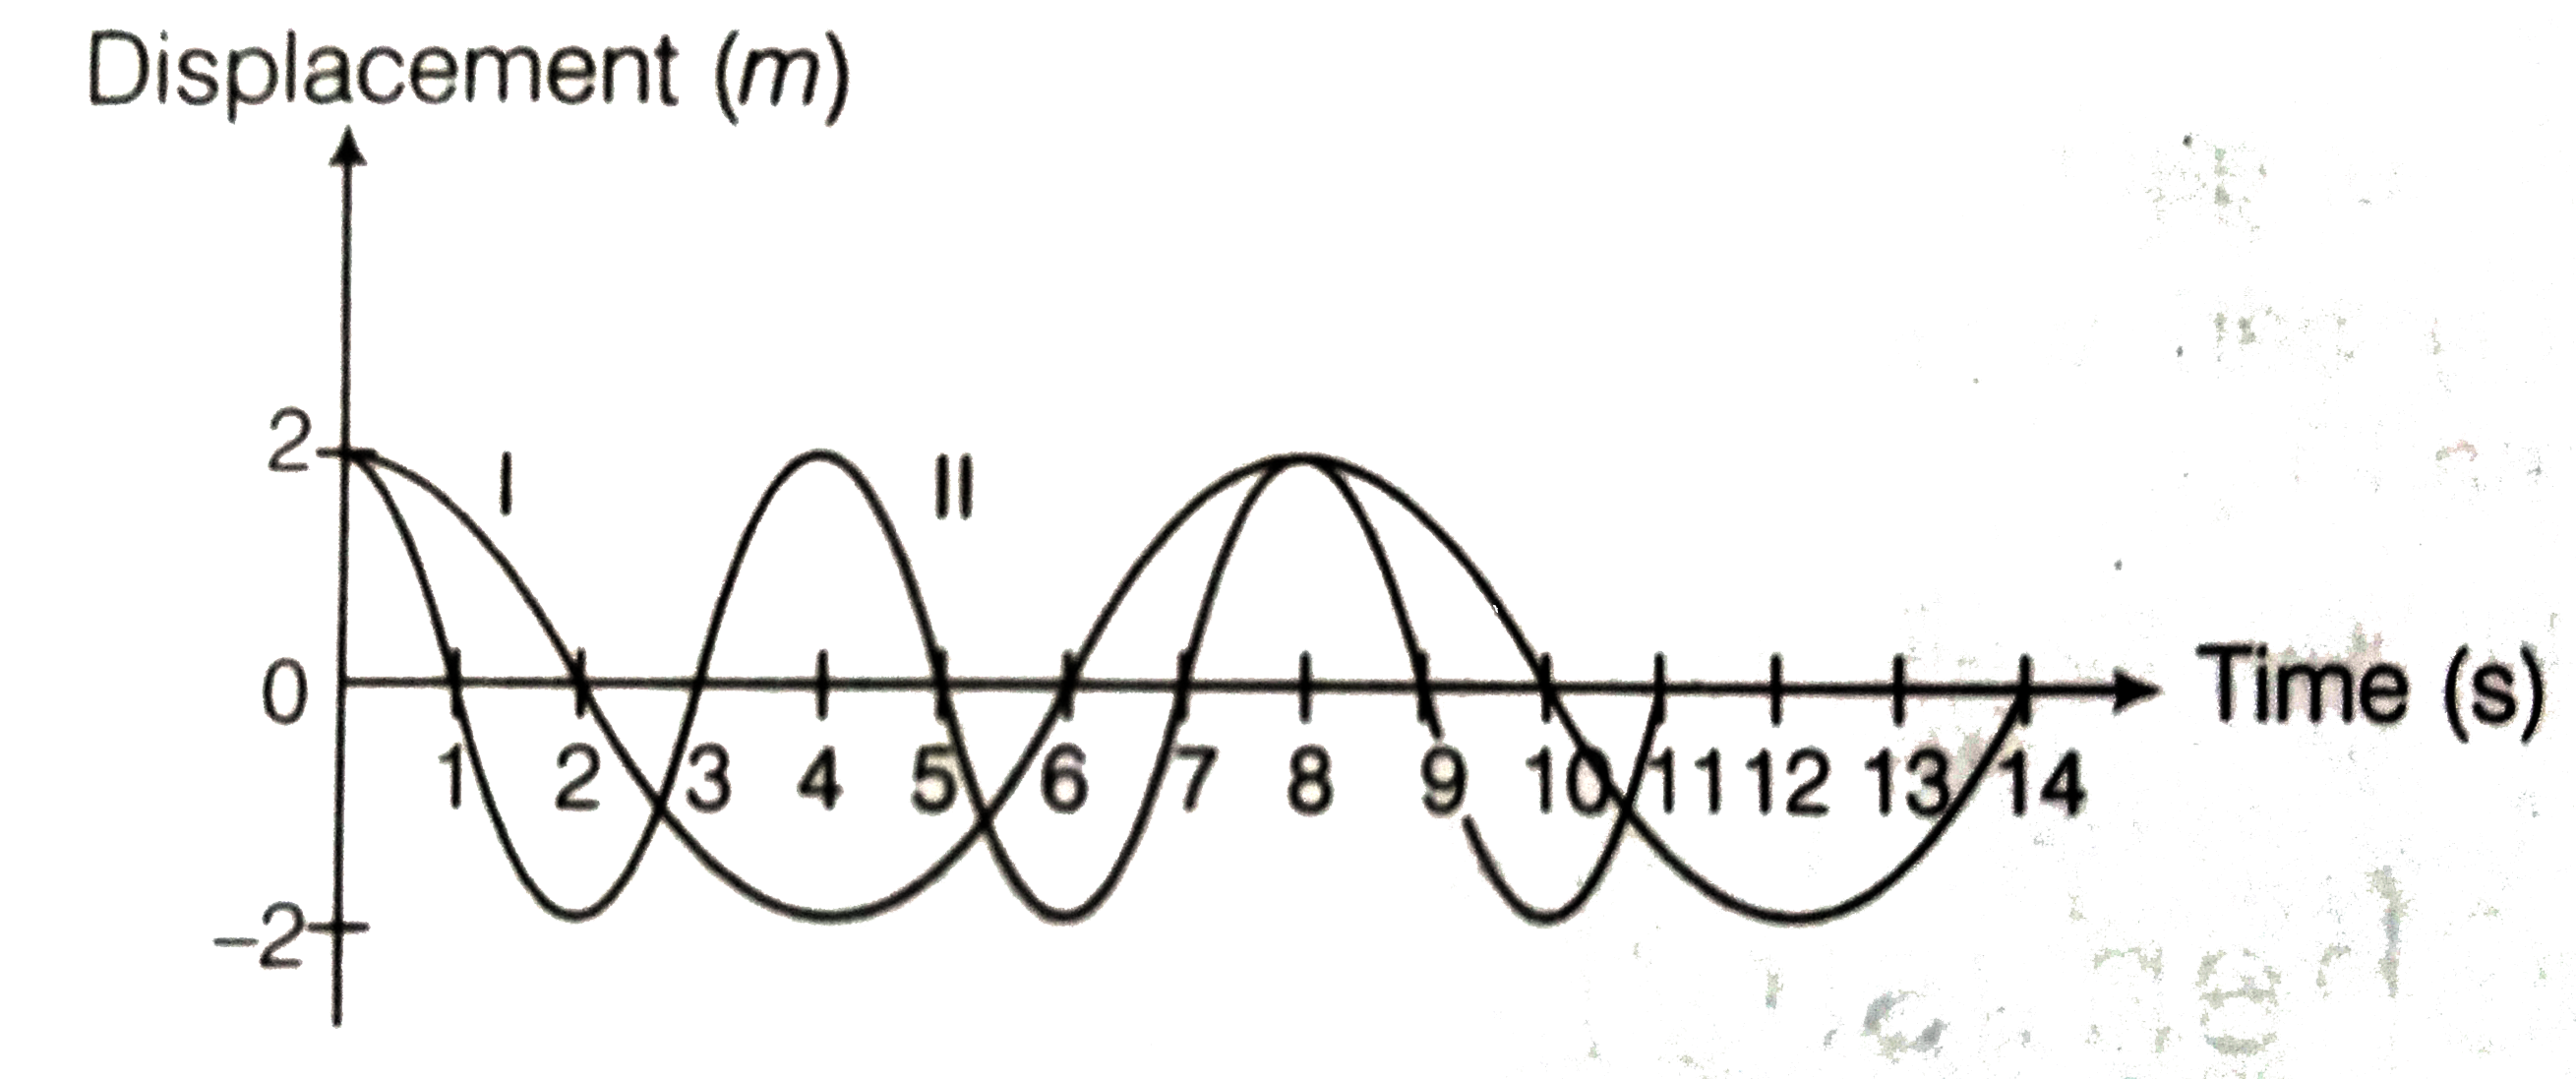
Figure shows the displacement time graphs of two simple harmonic motions I and II. From the graph it follows that
View SolutionThe figure shows graph between velocity 'V' and displacement 'X' from mean position of a particle performing simple harmonic motion
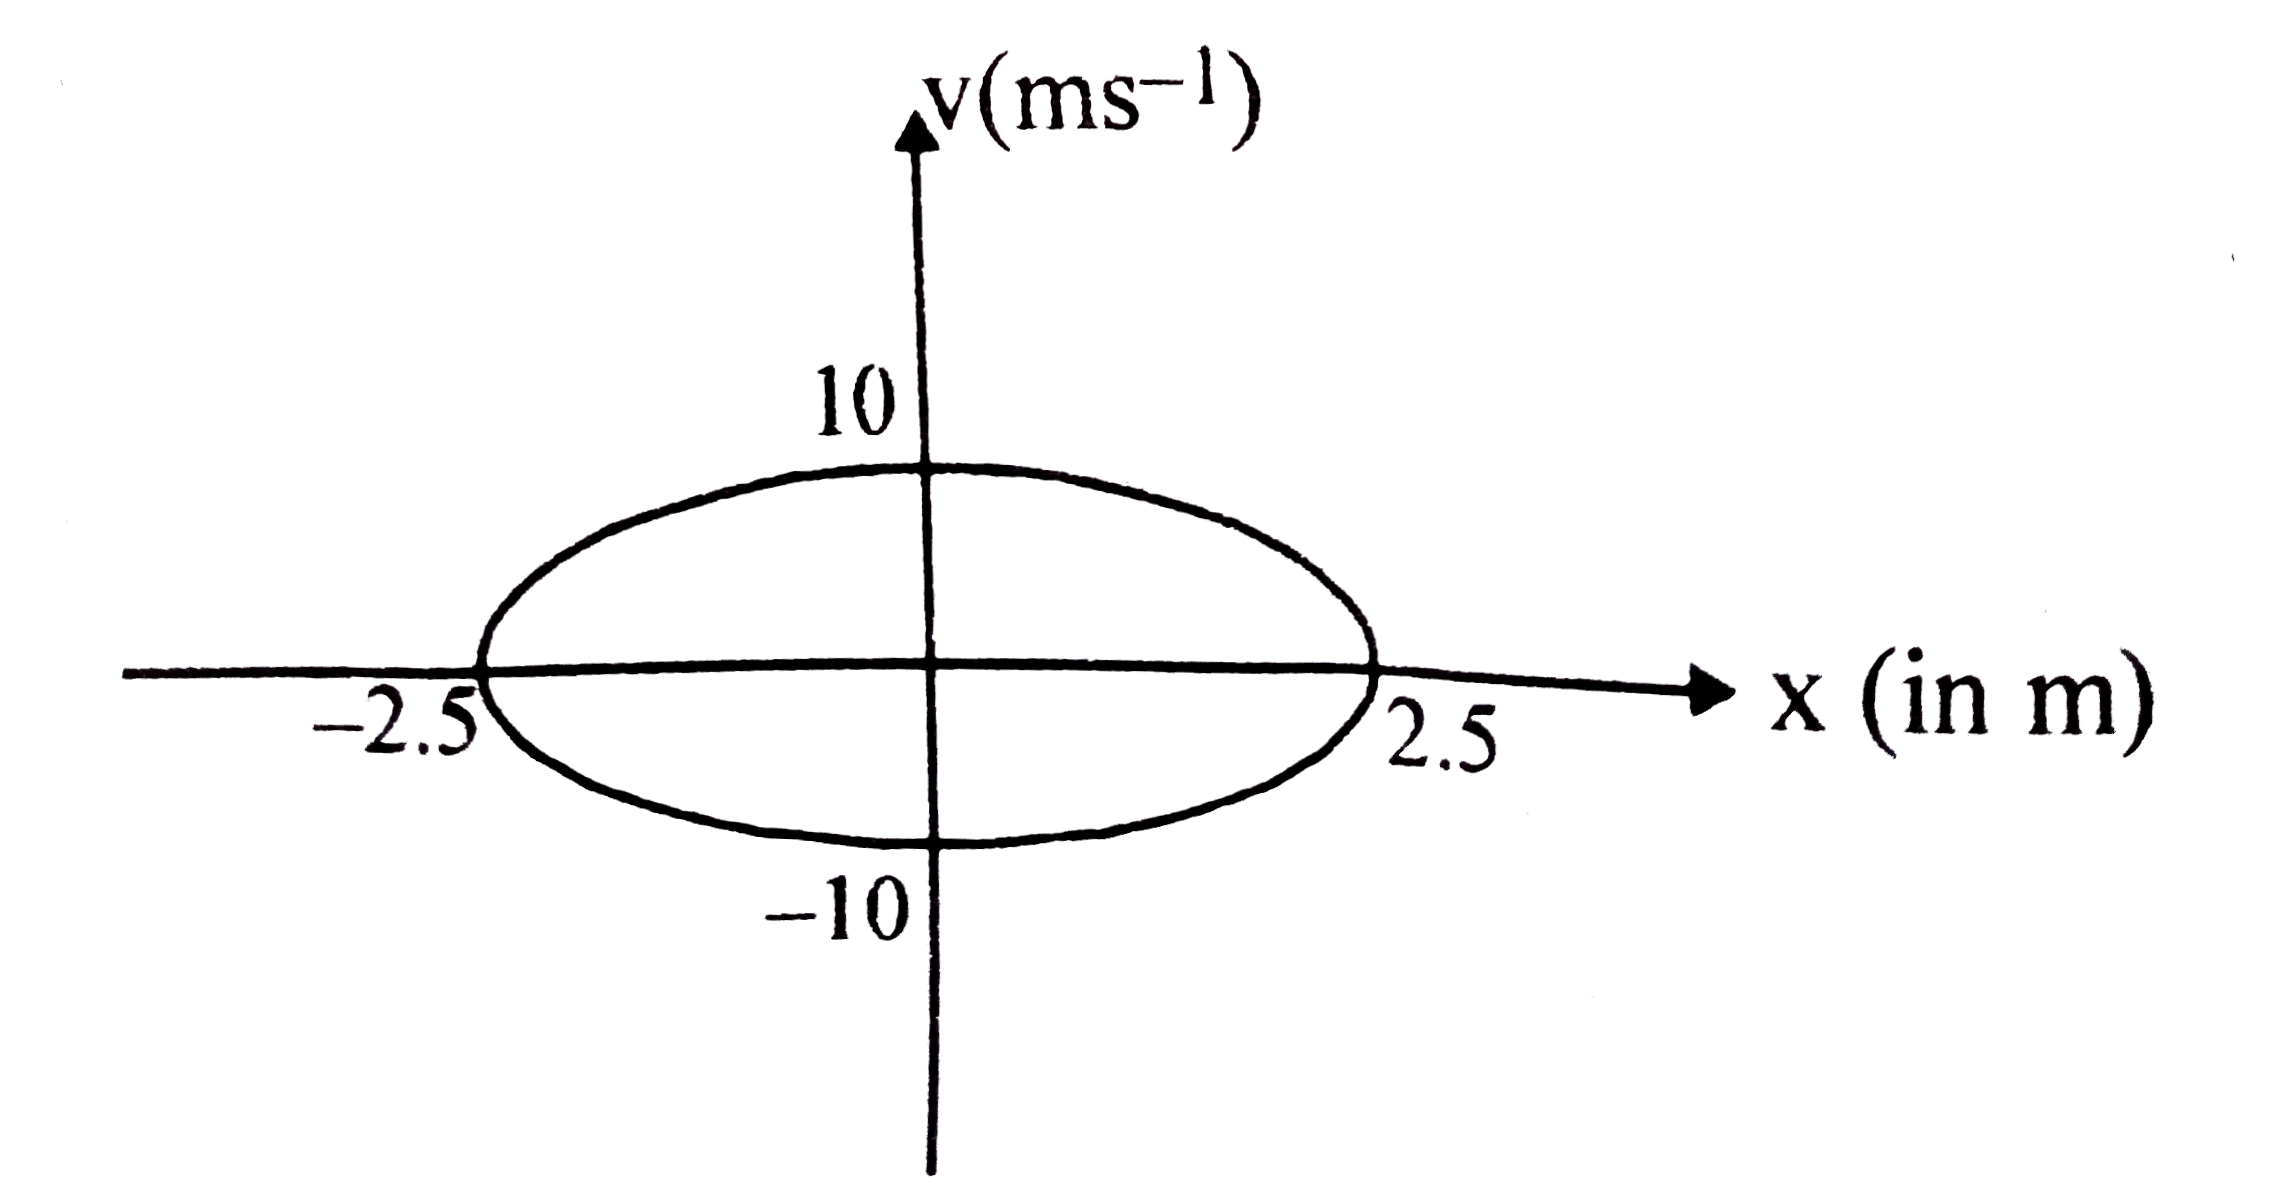
The time period of motion of particle is:
View SolutionIn ideal simple harmonic motion, the constant quantity is
View SolutionA system is oscillating with undamped simple harmonic motion. Then the
View SolutionOn the basis of dimensional, decide which of the following relation for the displacement of a particle undergoing simple harmonic motion is not correct :
View Solution
