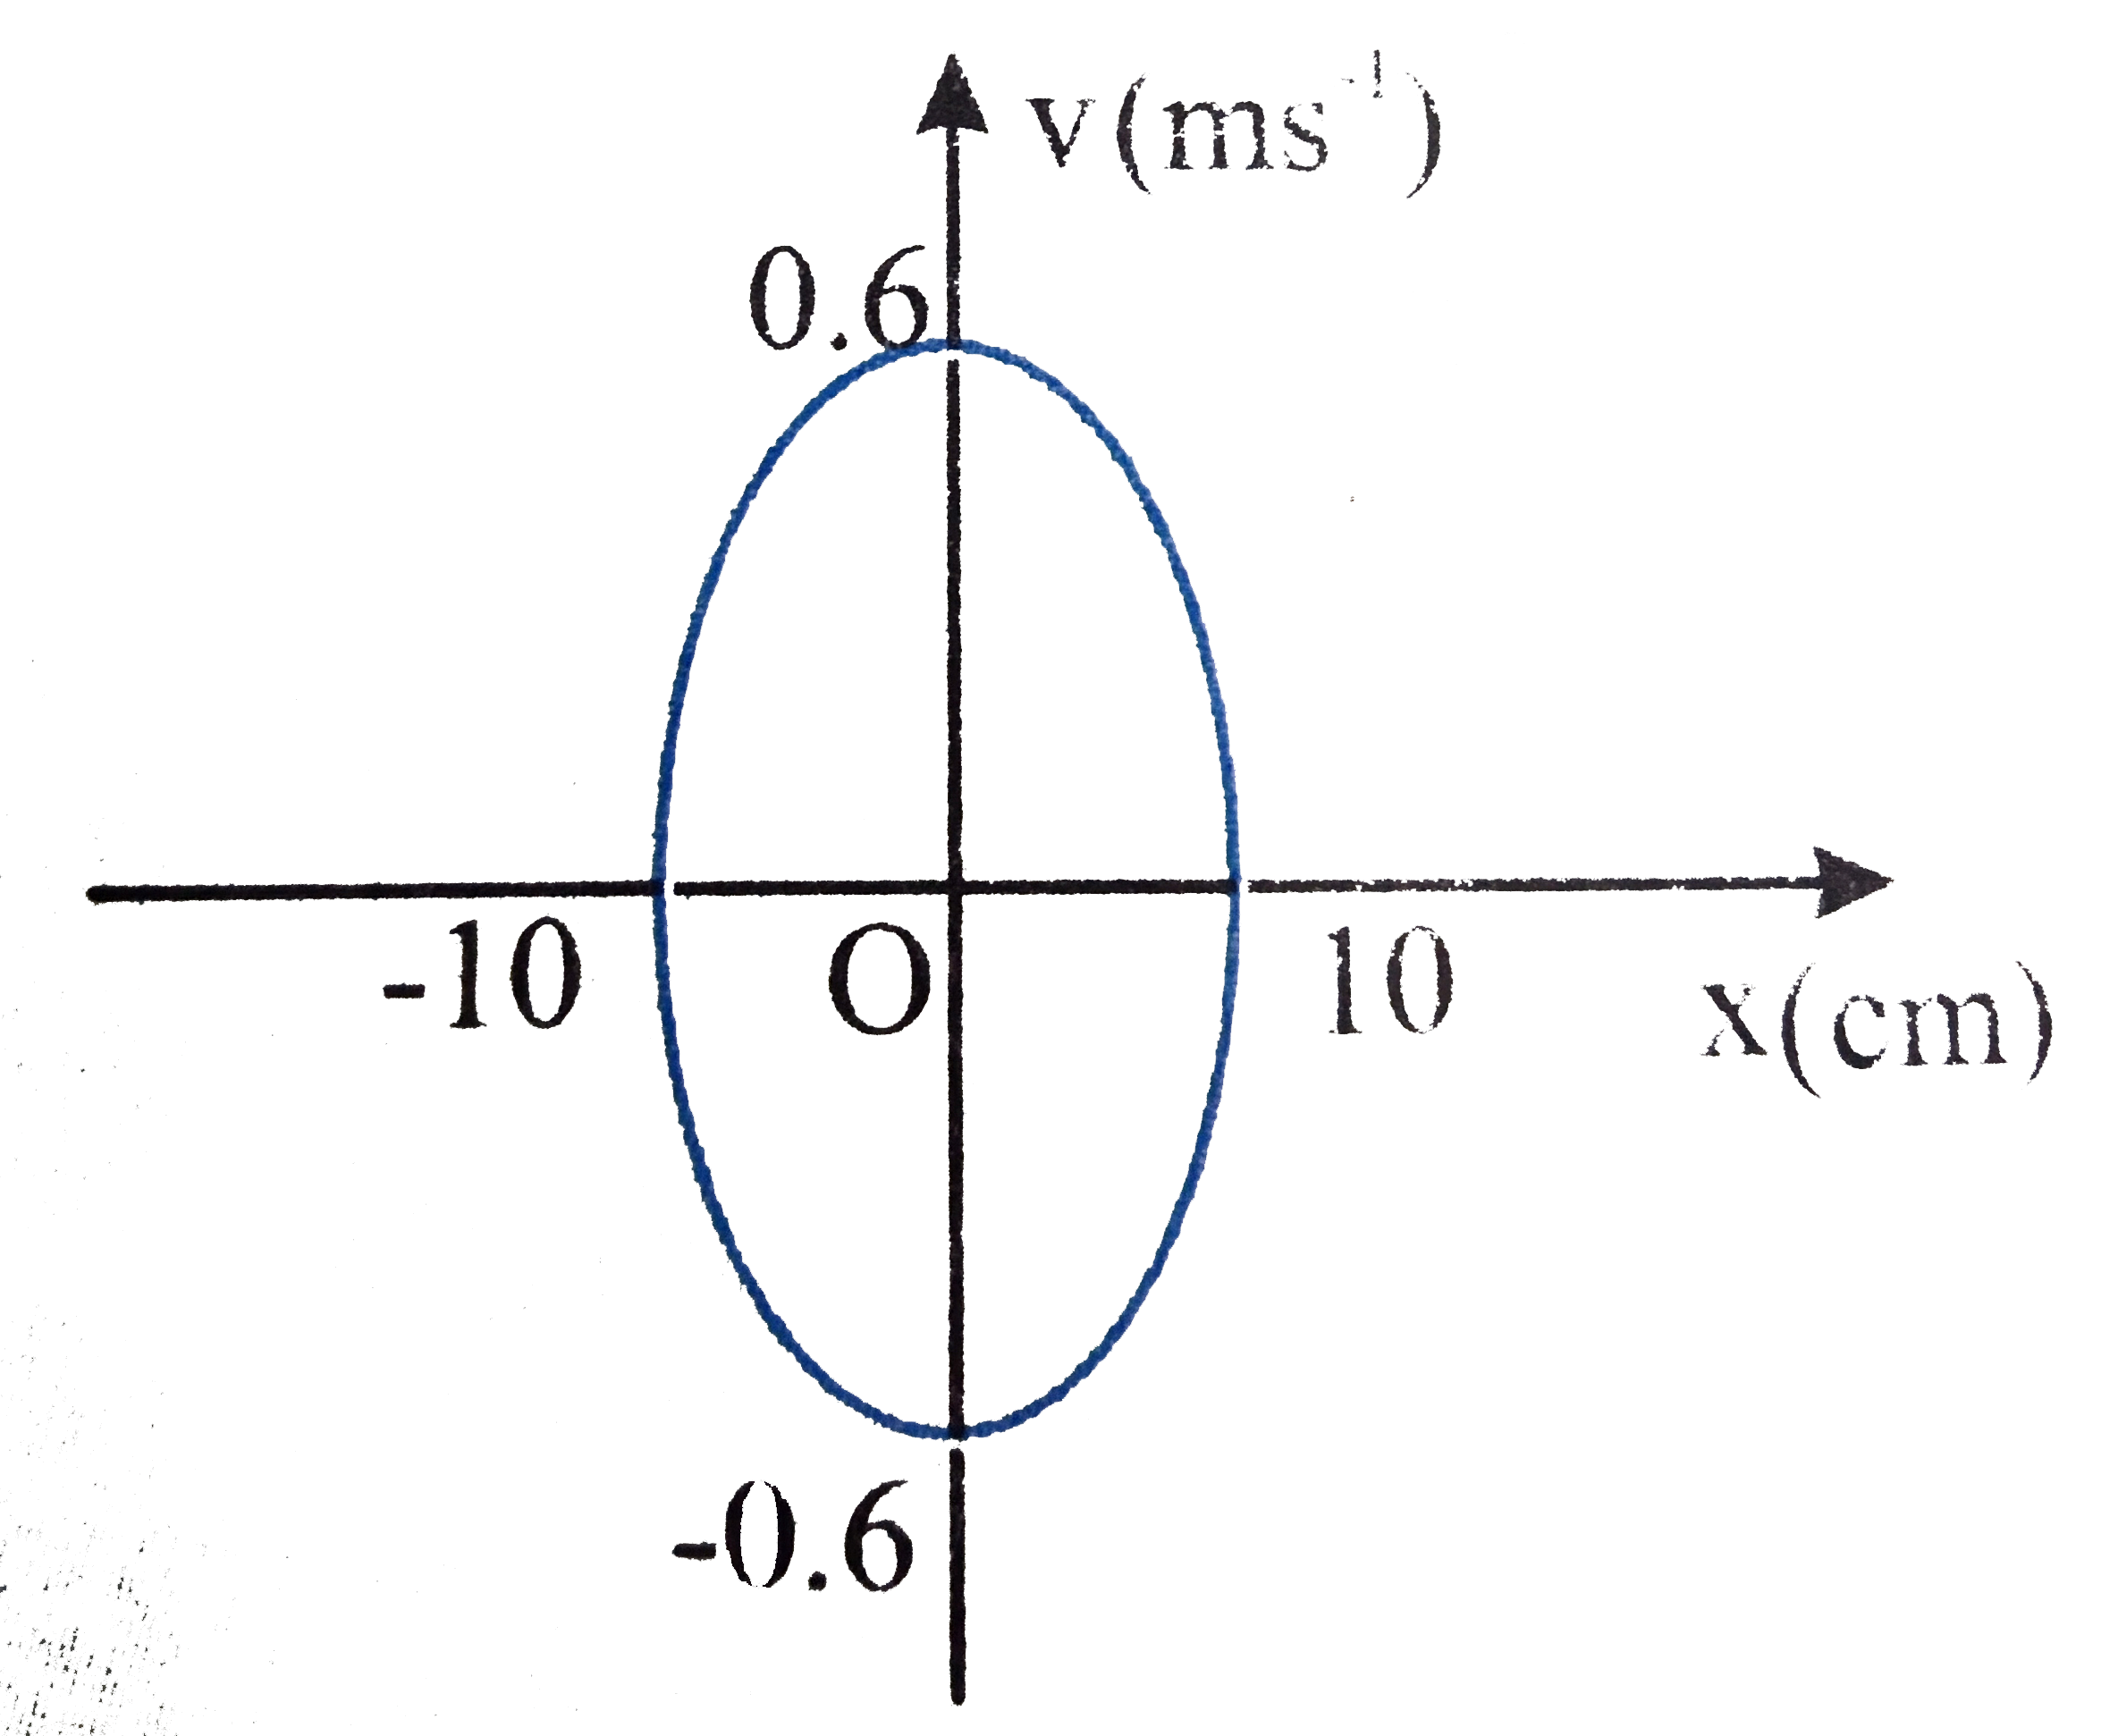
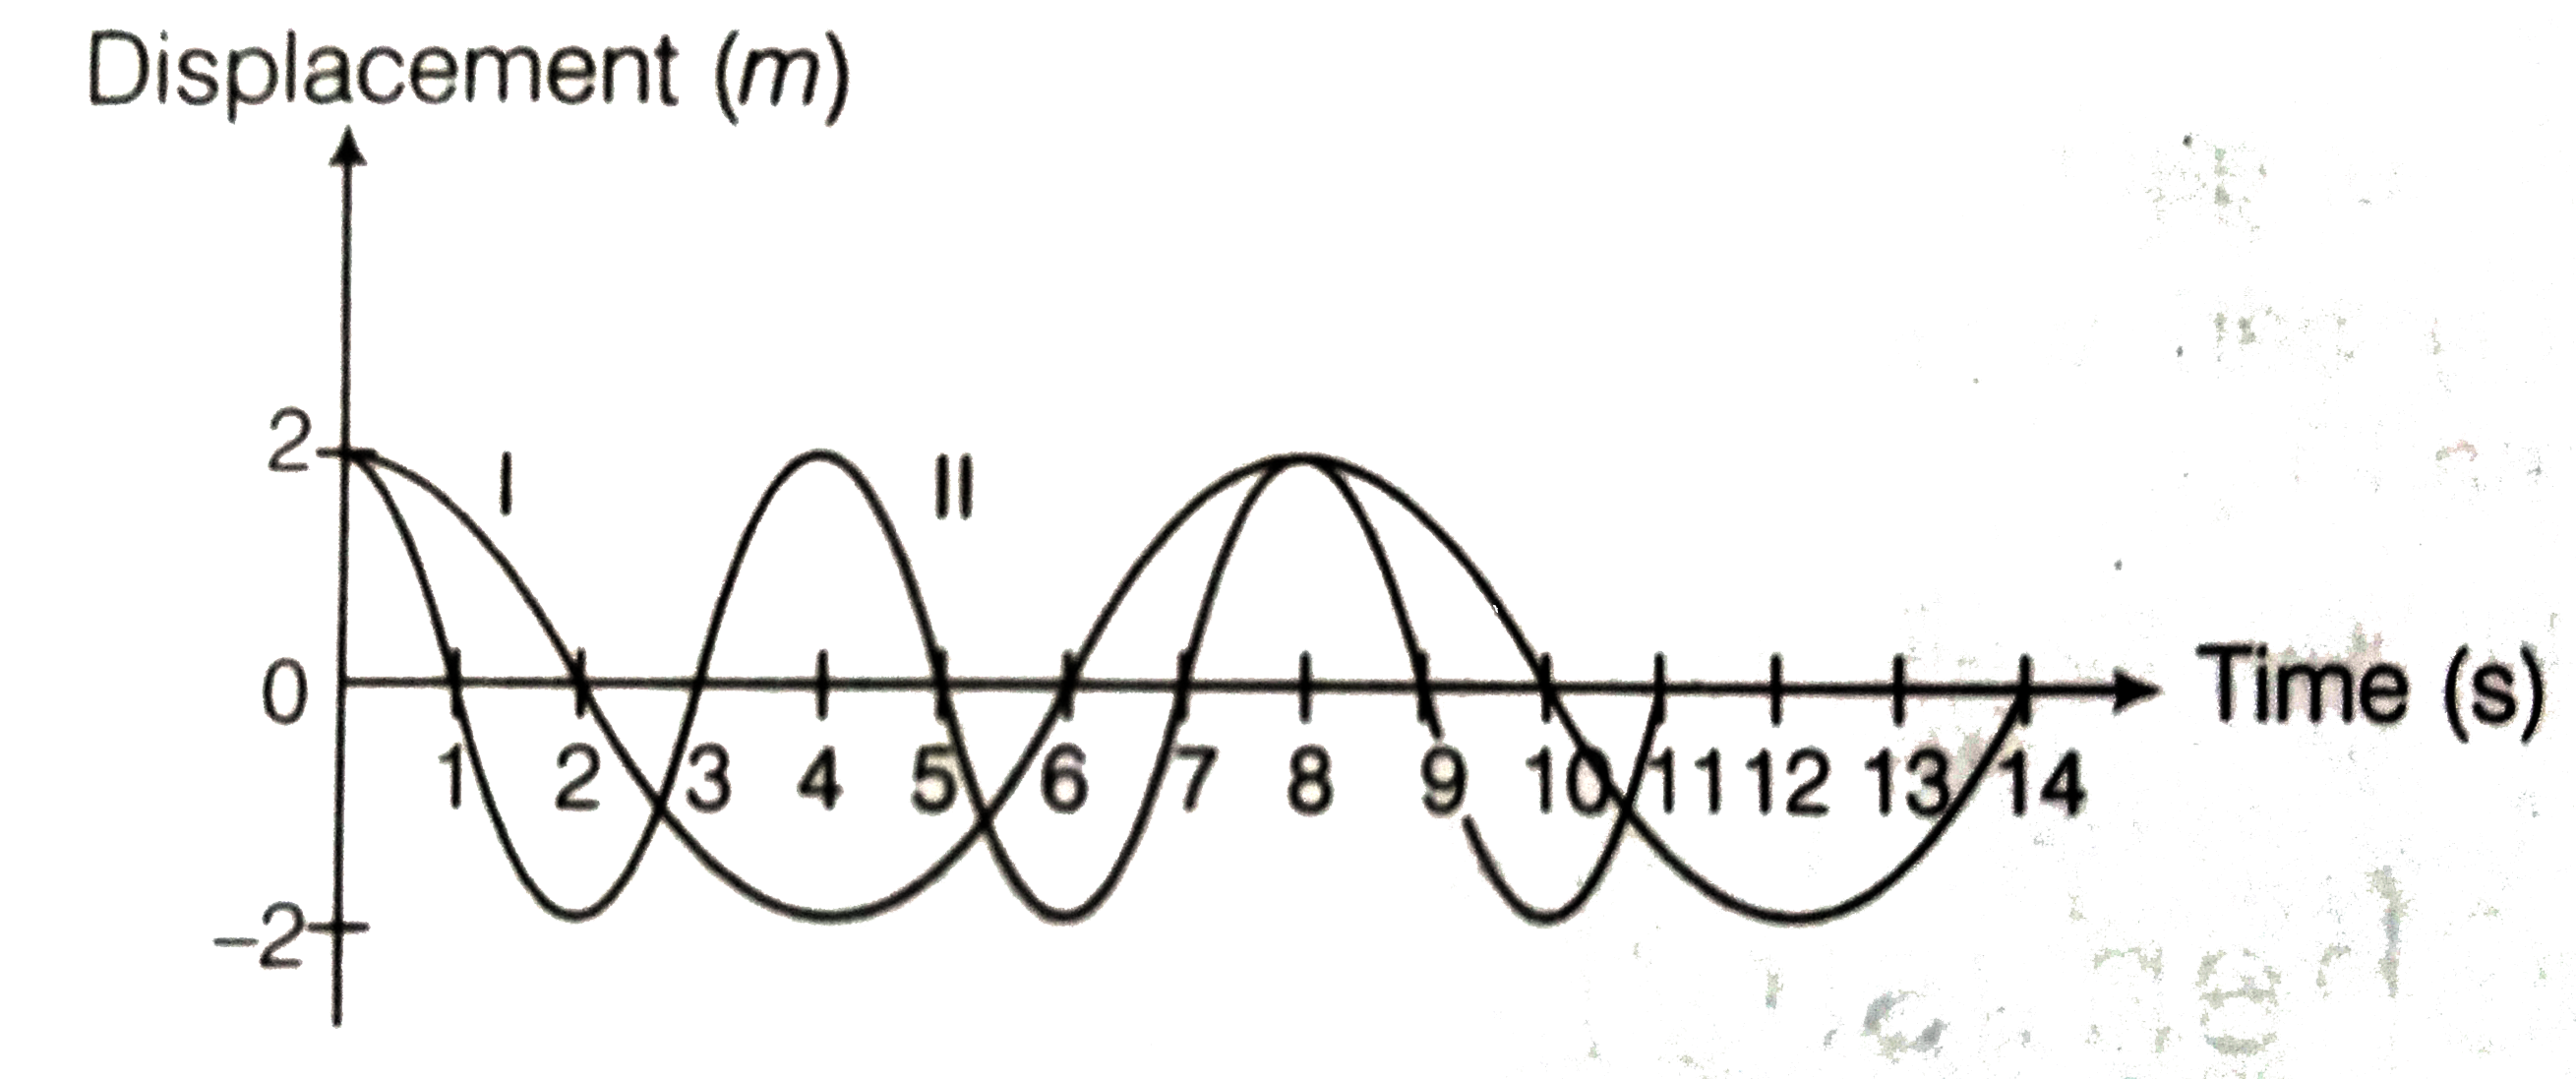
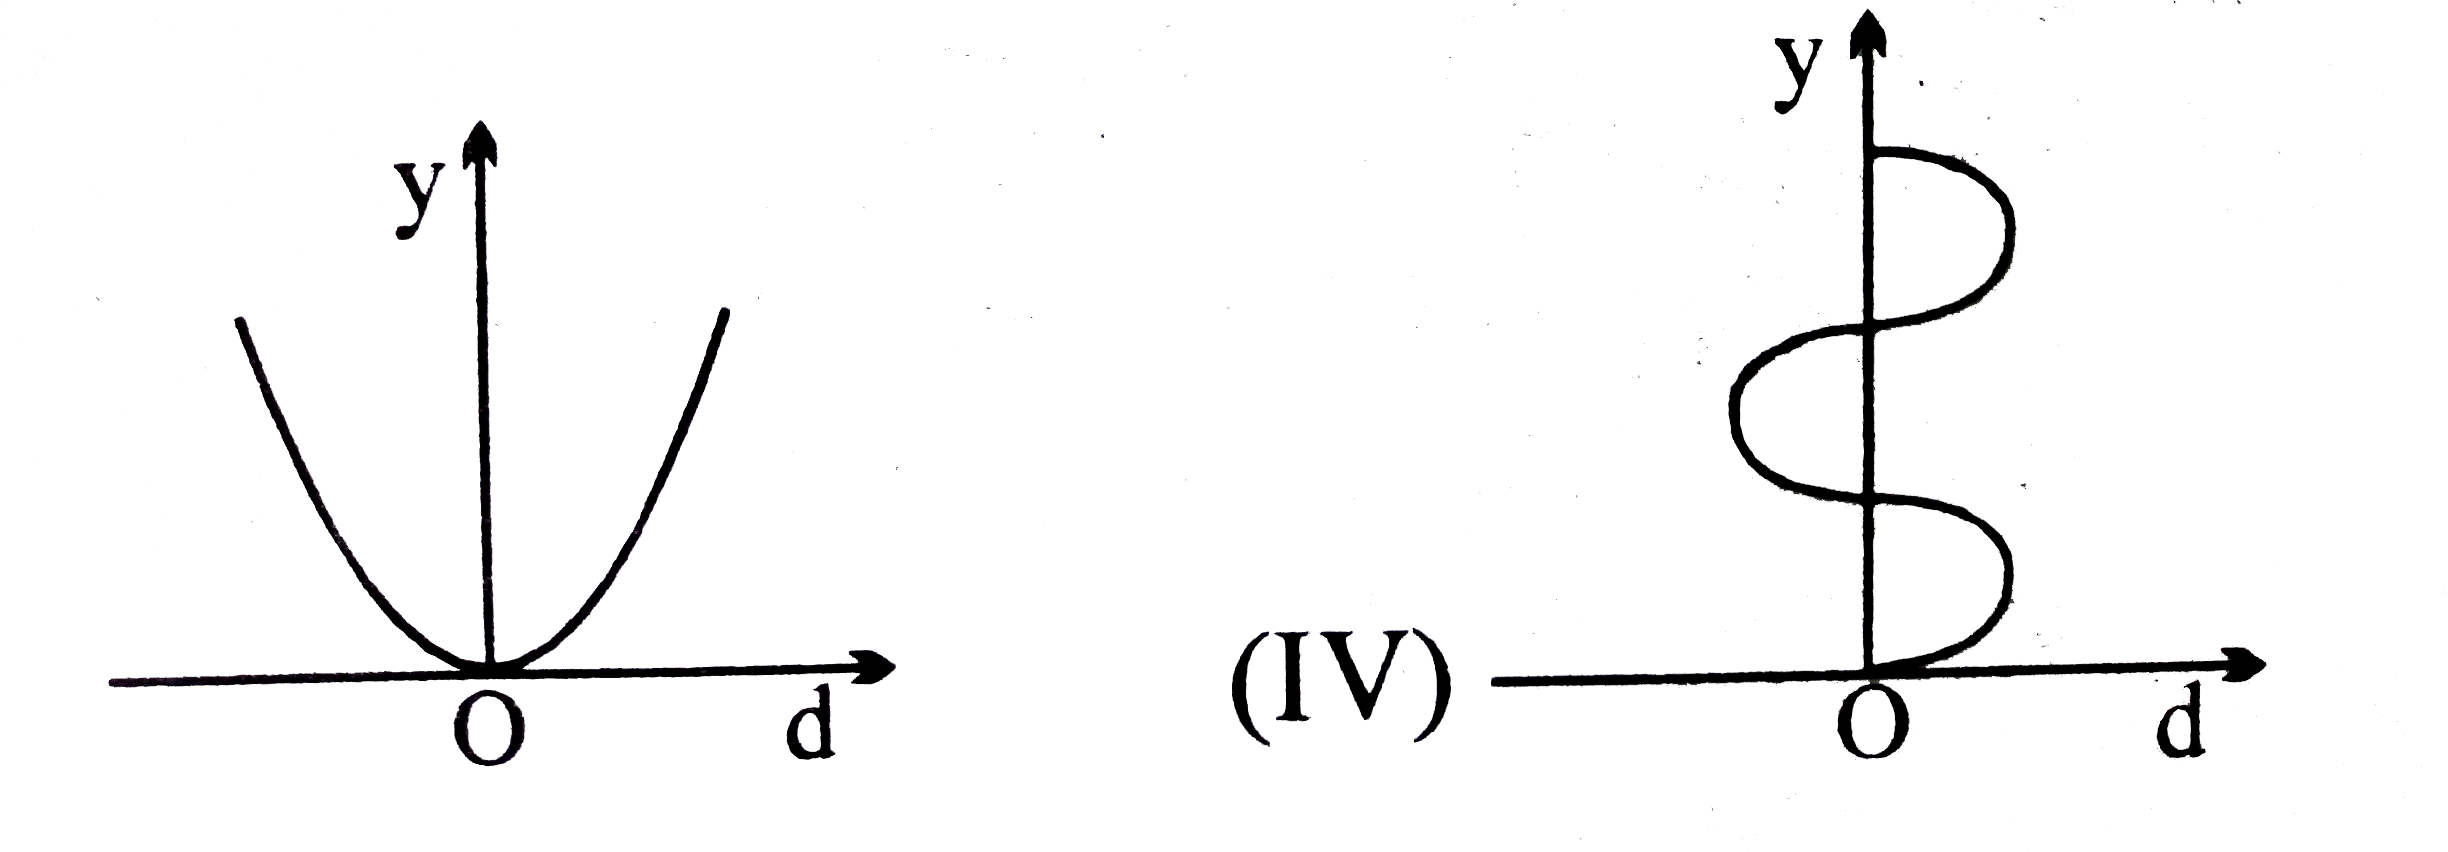
The graphs in fugure show that a quantity varies with displacement in a system undergoing simple harmonic motion.
(I) 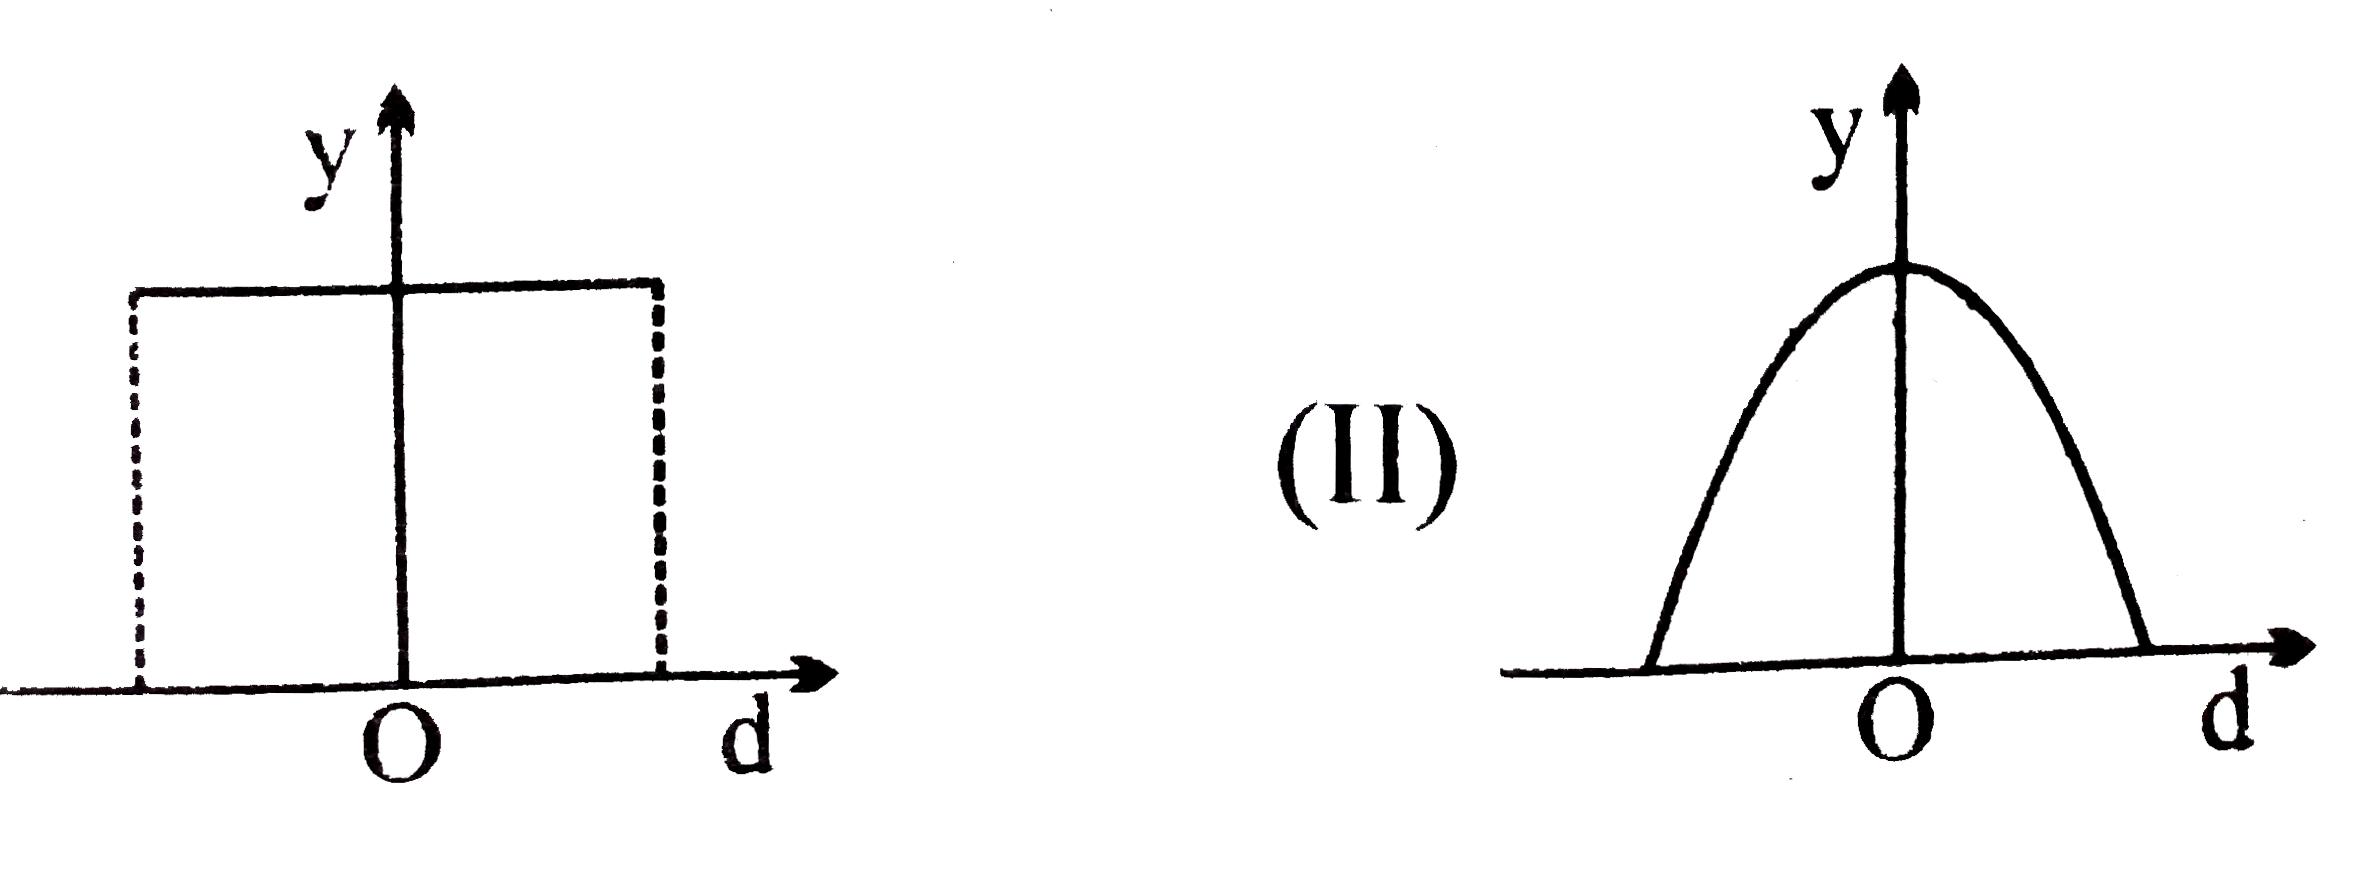 ,
, 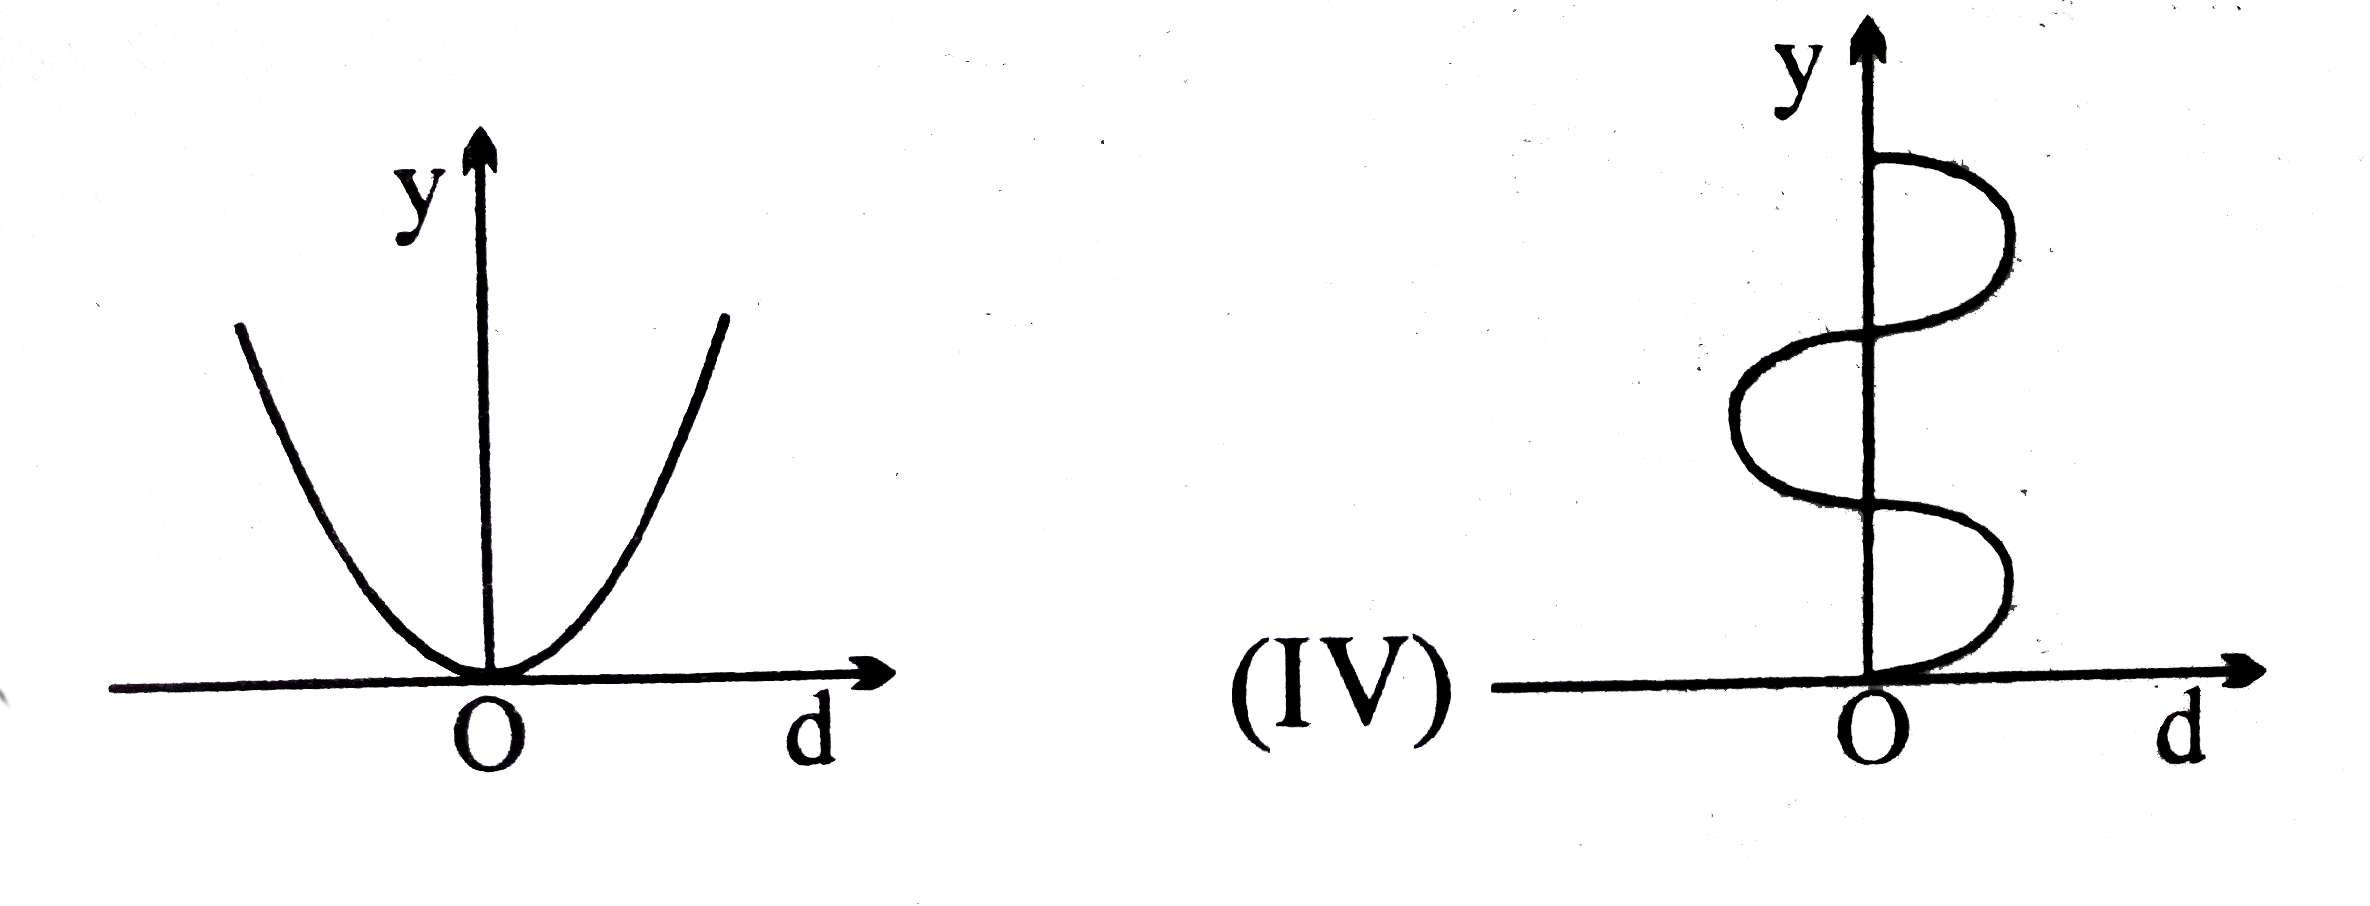
The unbalanced force acting on the system.
A
B
C
D
None
Video Solution
Text Solution
The correct Answer is:D
Figure
|
Updated on:21/07/2023
Similar Questions
Knowledge Check
- Question 1 - Select One
The graphs in fugure show that a quantity Y varies with displacement d in a system undergoing simple harmonic motion.
(I)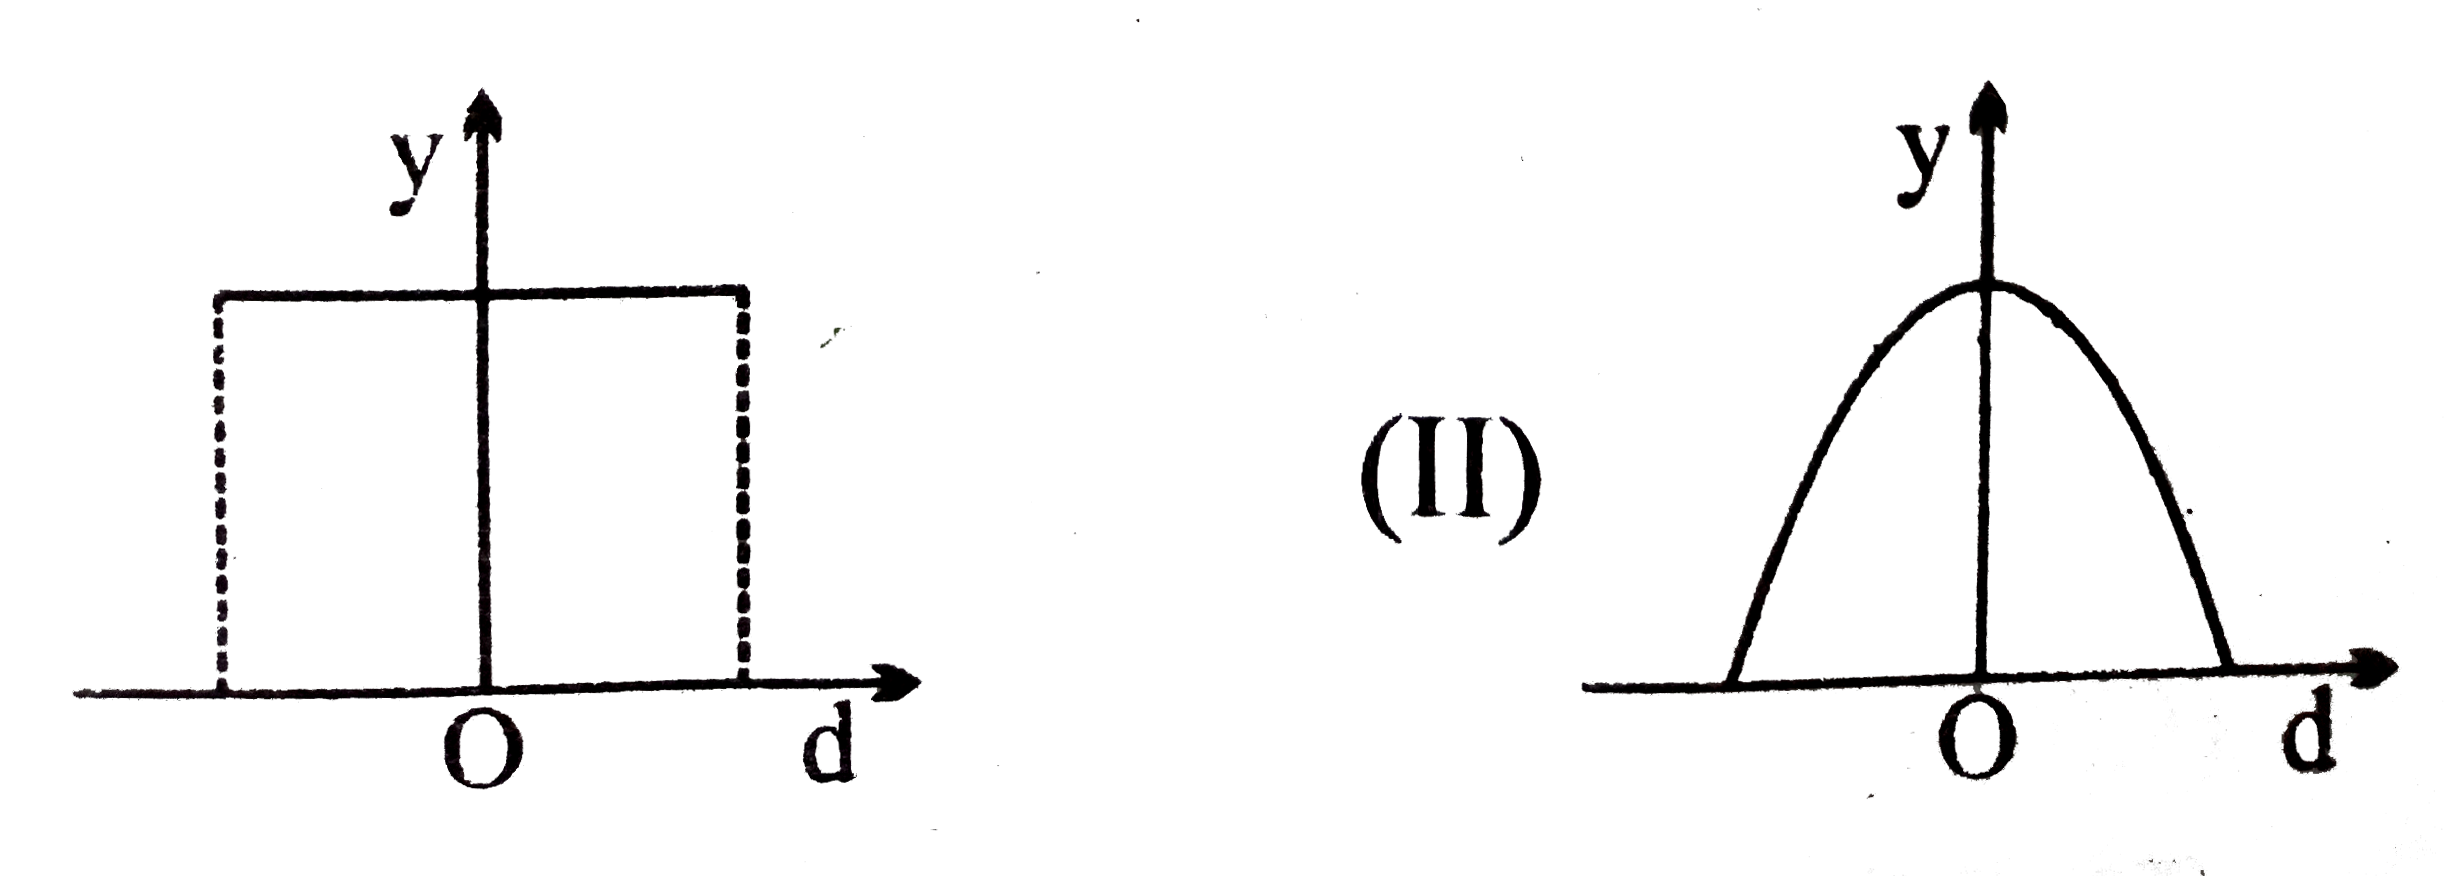 ,
, 
The timeAIBIICIIIDIV - Question 2 - Select One
The graphs in fugure show that a quantity Y varies with displacement d in a system undergoing simple harmonic motion.
(I)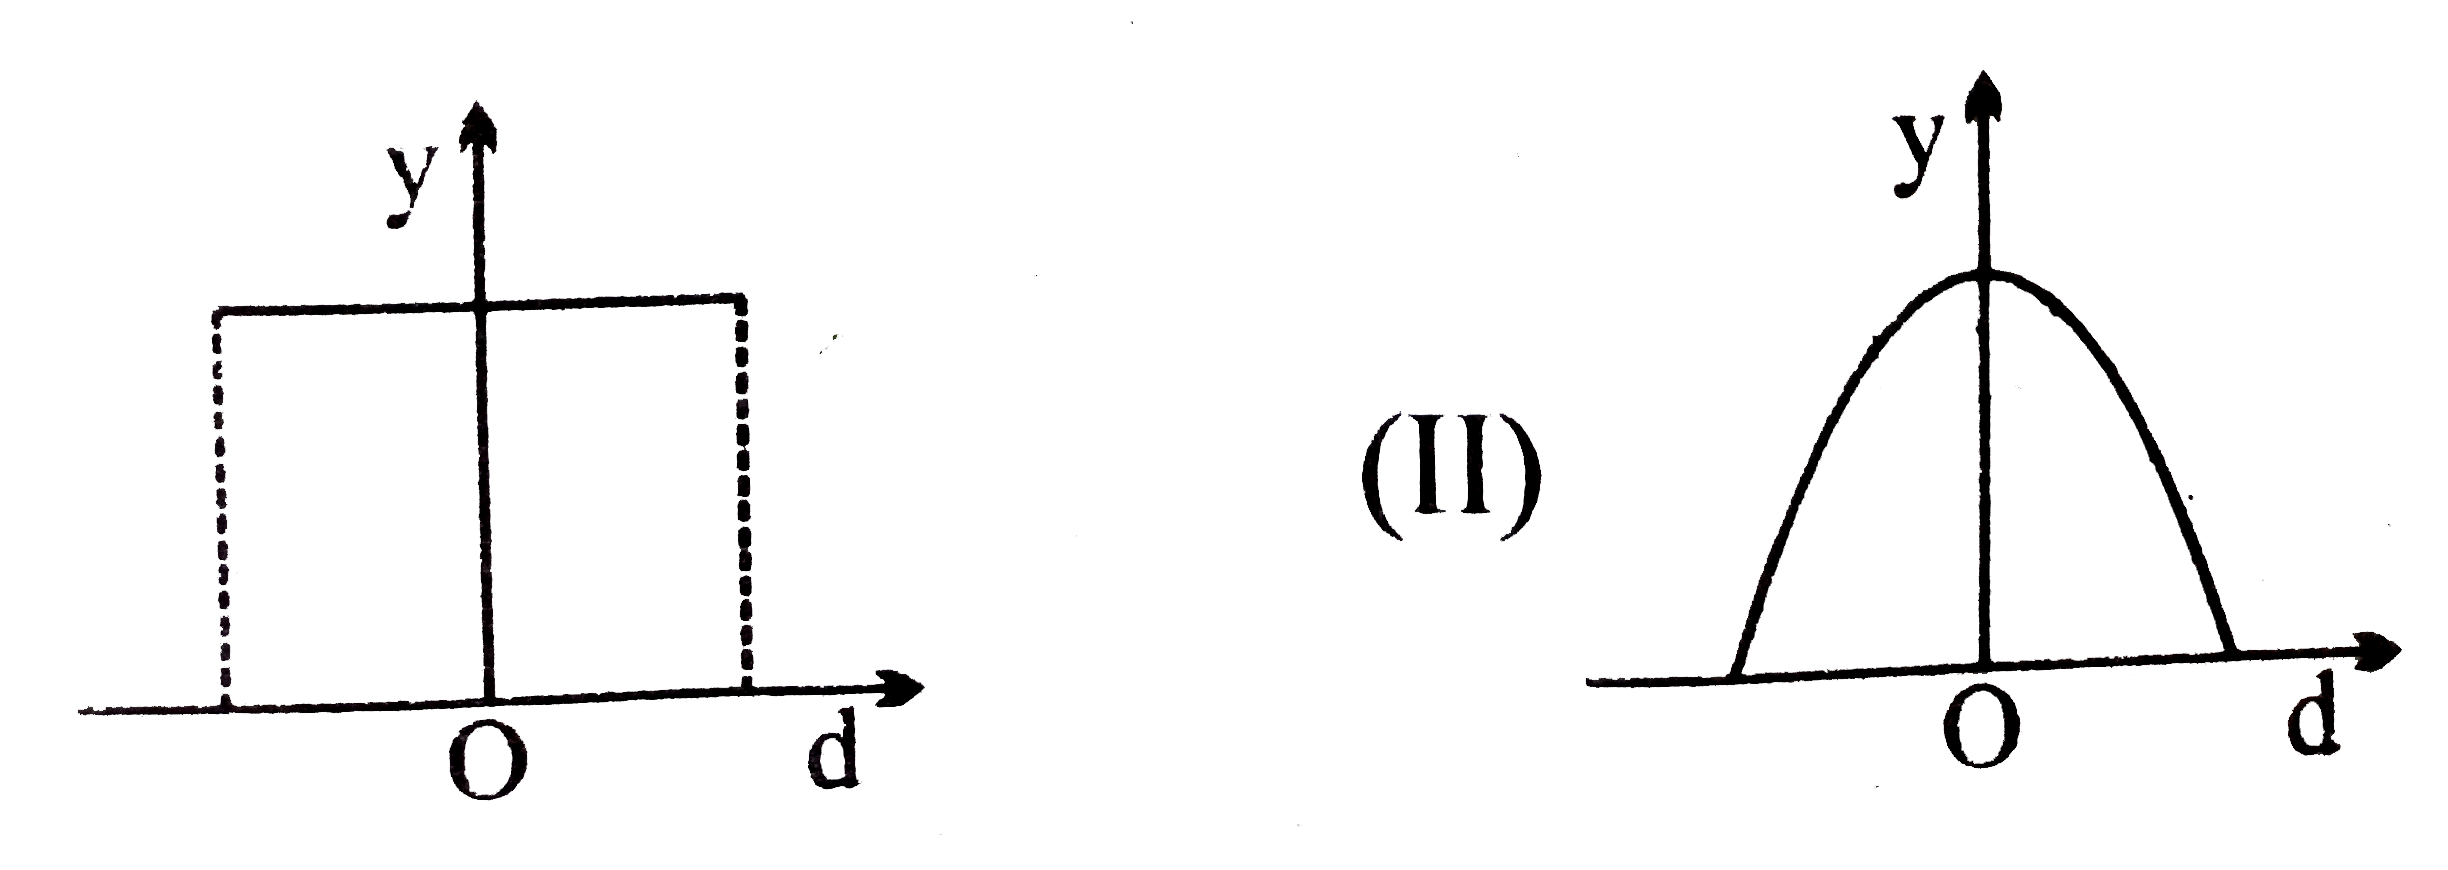 ,
, 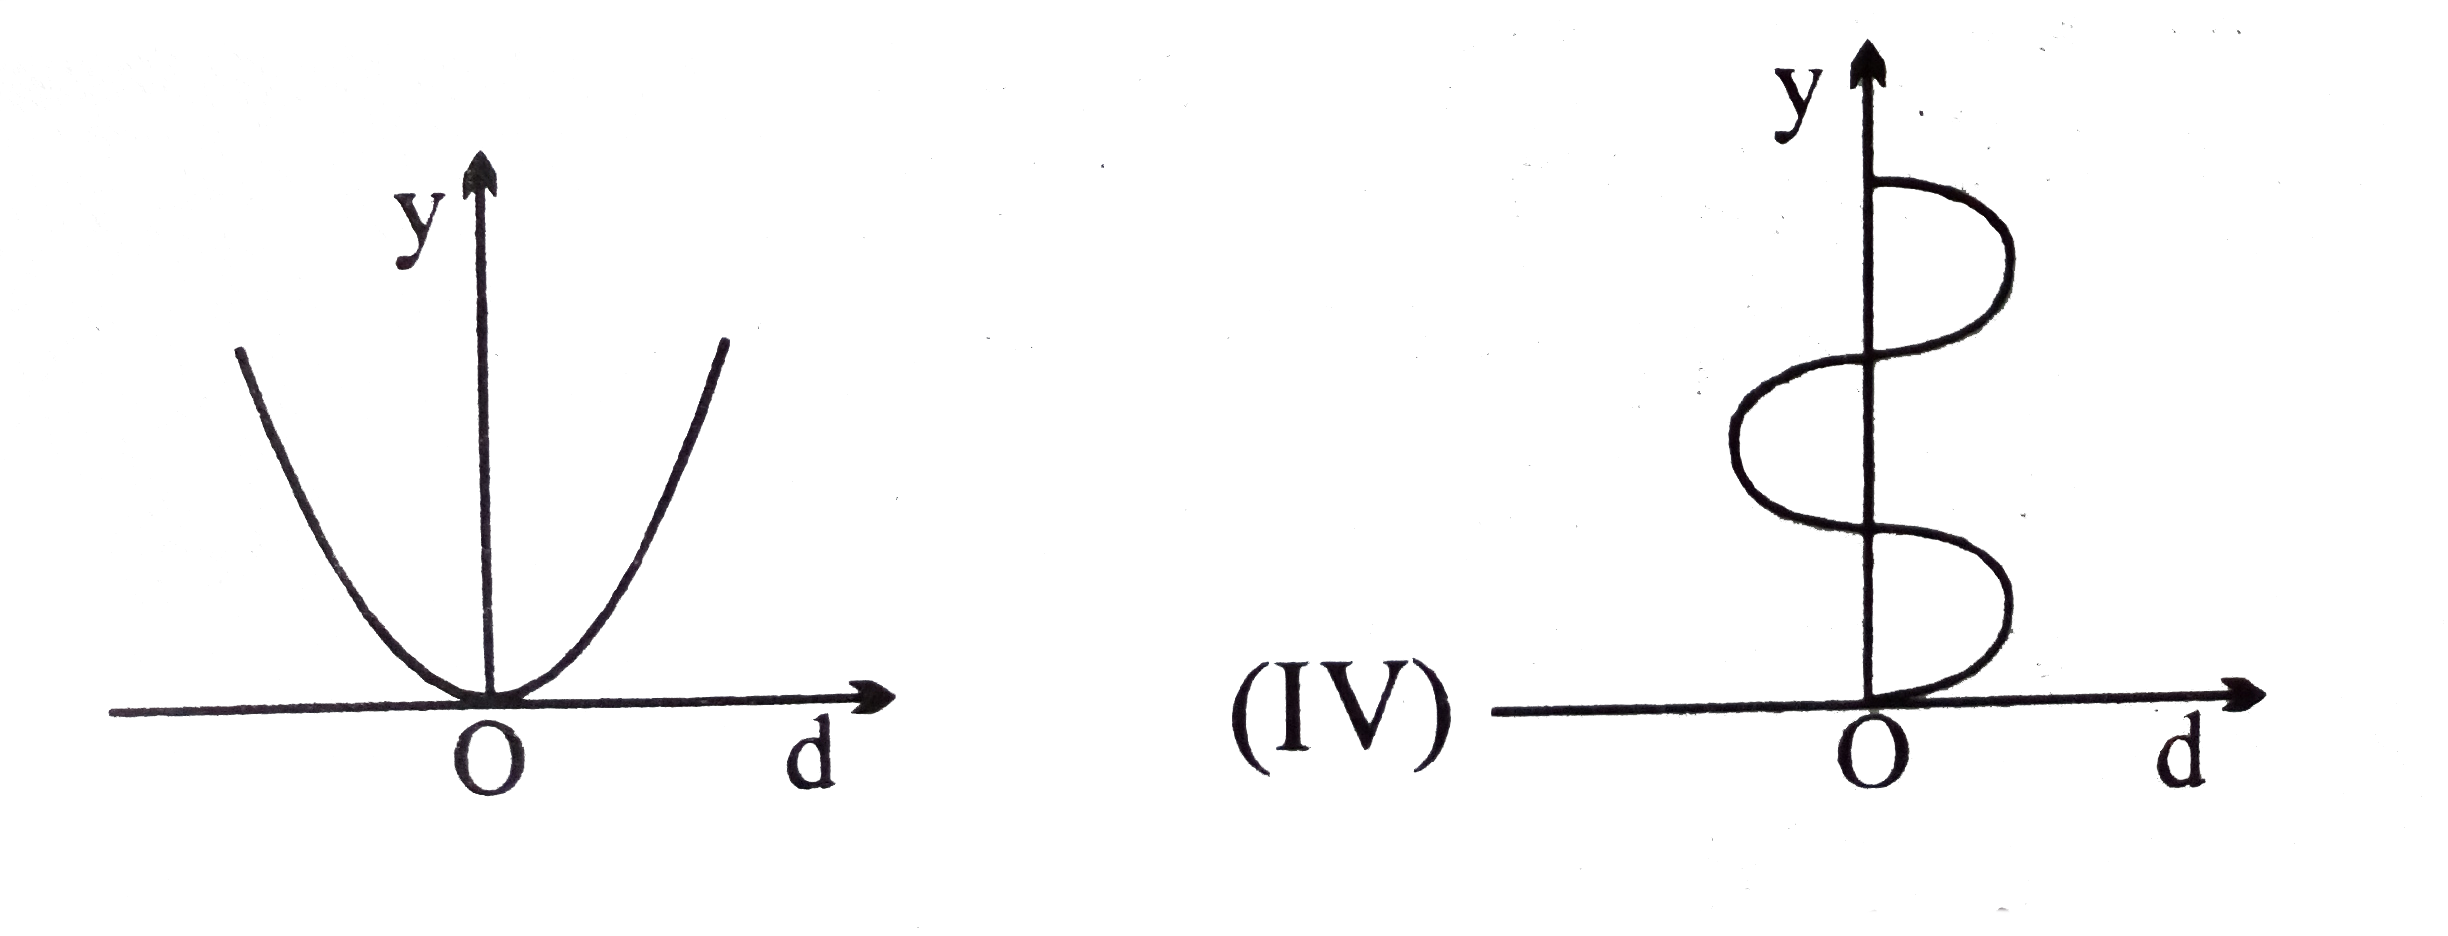
Which graphs best represents the relationship obtained when y is
The total energy of the systemAIBIICIIIDIV - Question 3 - Select One or More
A system is oscillating with undamped simple harmonic motion. Then the
Aaverage total energy per cycle of the motion is its maximum kinetic energyBaverage total energy per cycle of the motion is 1√2 times its maximum kinetic energy.Croot mean square velocity is 1√2 times its maximum velocityDmean velocity is 1/2 of maximum velocity.
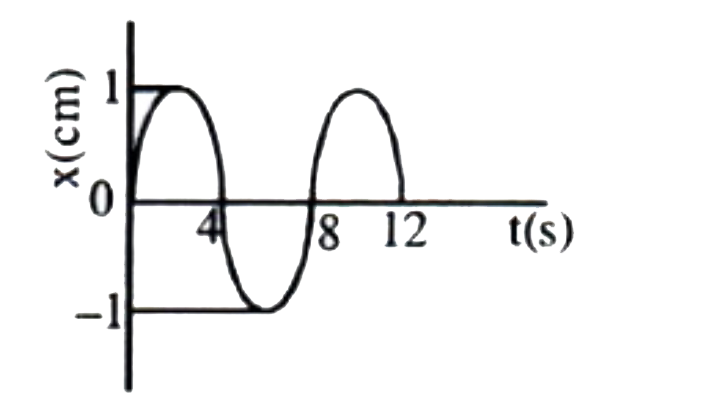
The x-t graph of a particle undergoing simple harmonic motion is shown below. The acceleration of the particle at t=23s is
 View Solution
When a mass undergoes simple harmonic motion, there is always a constant ratio between its displacement and
View Solution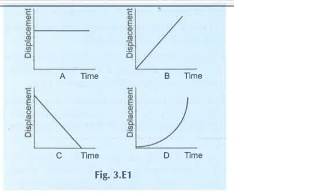
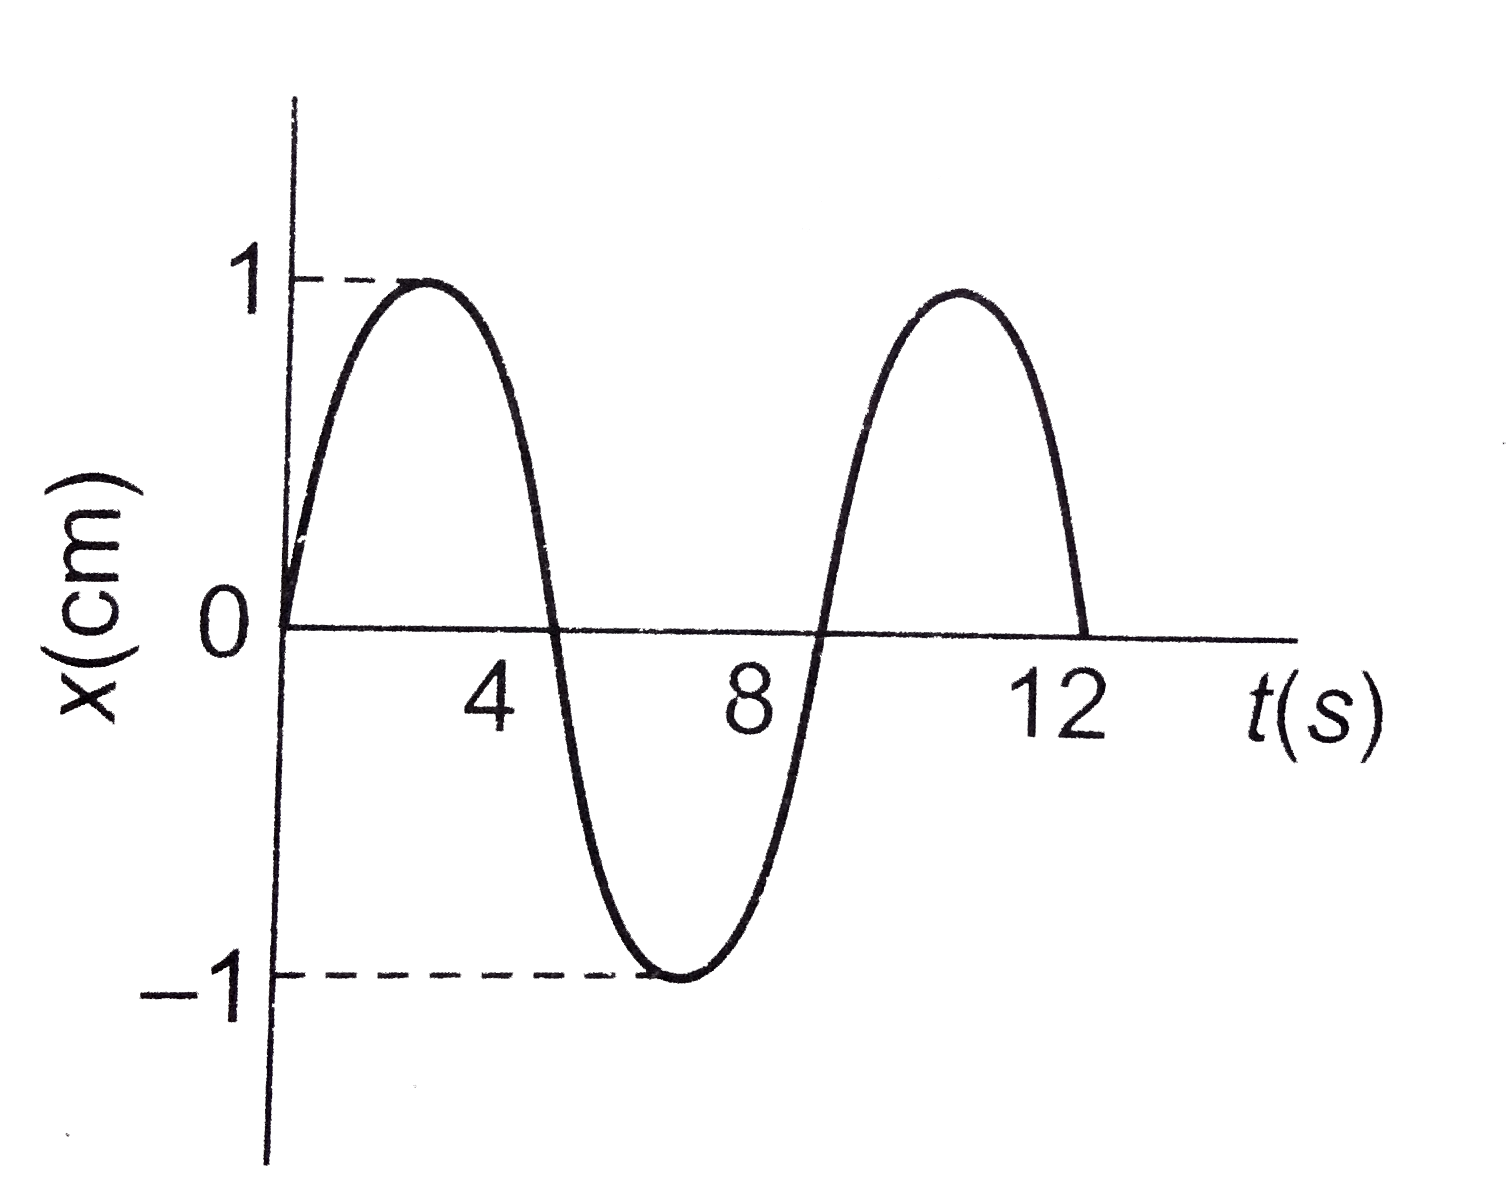
figure 3.E1 shows the displacement -time graphs for the four particles, A, B,C and D. An unbalanced force is acting on the particleView SolutionThe x-t graph of a particle undergoing simple harmonic motion is shown below. The acceleration of the particle of t=4/3s is
 View Solution
For a particle undergoing simple harmonic motion, the velocity is plotted against displacement. The curve will be
View Solution


