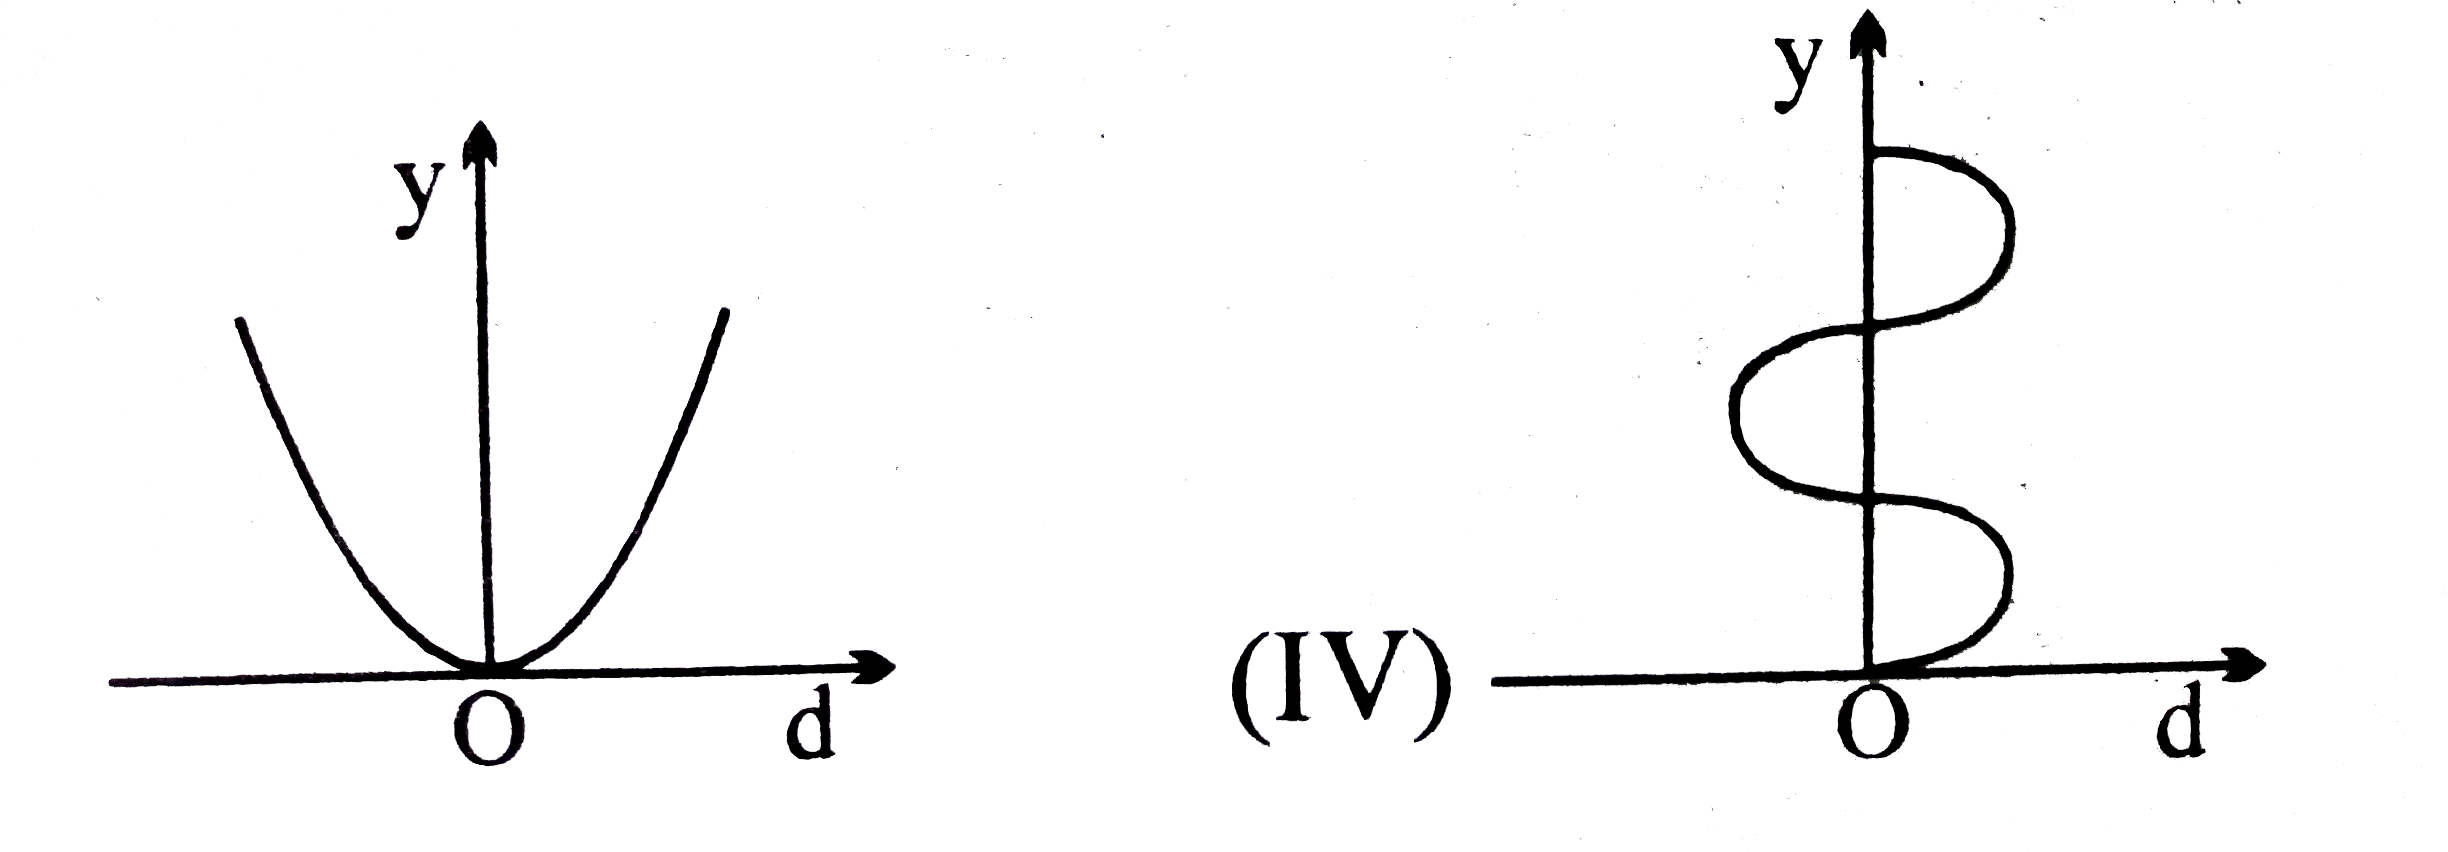
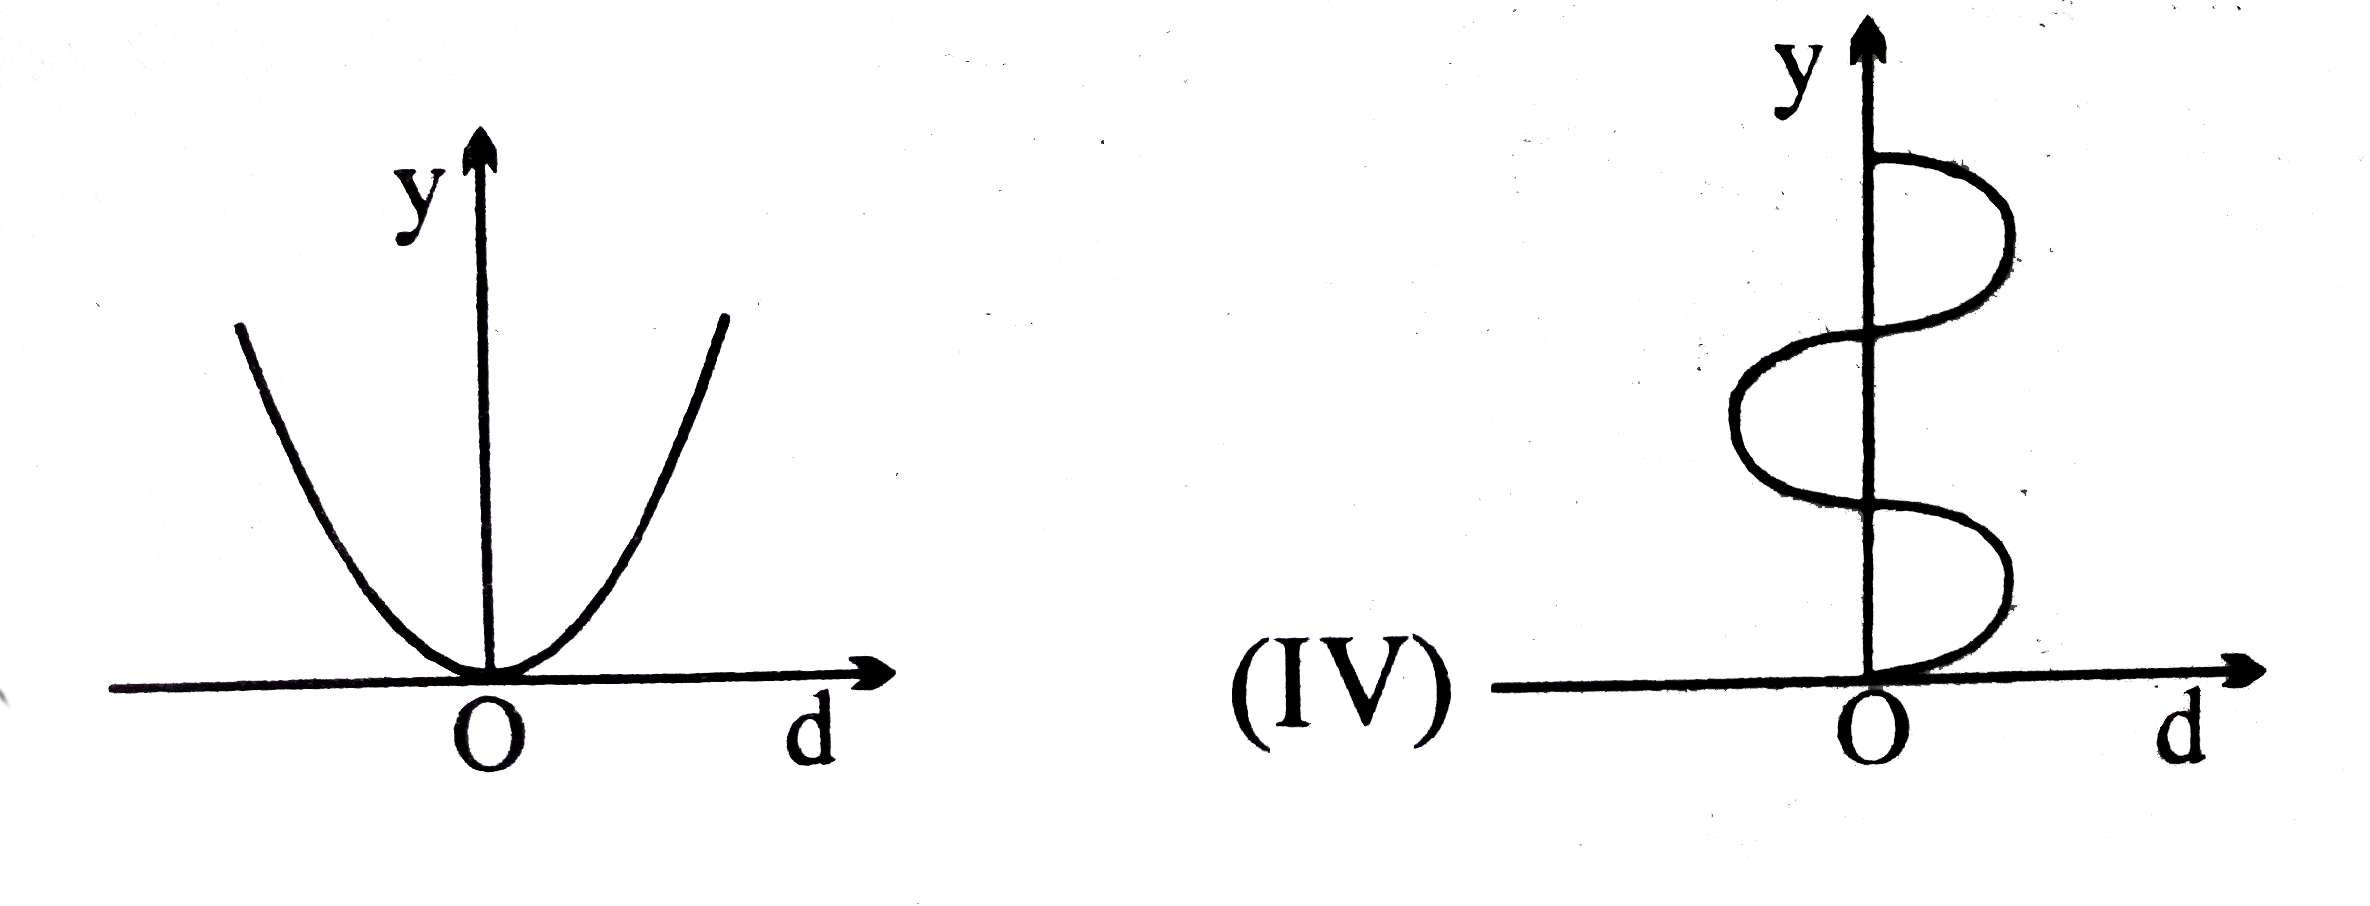
The graphs in fugure show that a quantity Y varies with displacement d in a system undergoing simple harmonic motion.
(I) 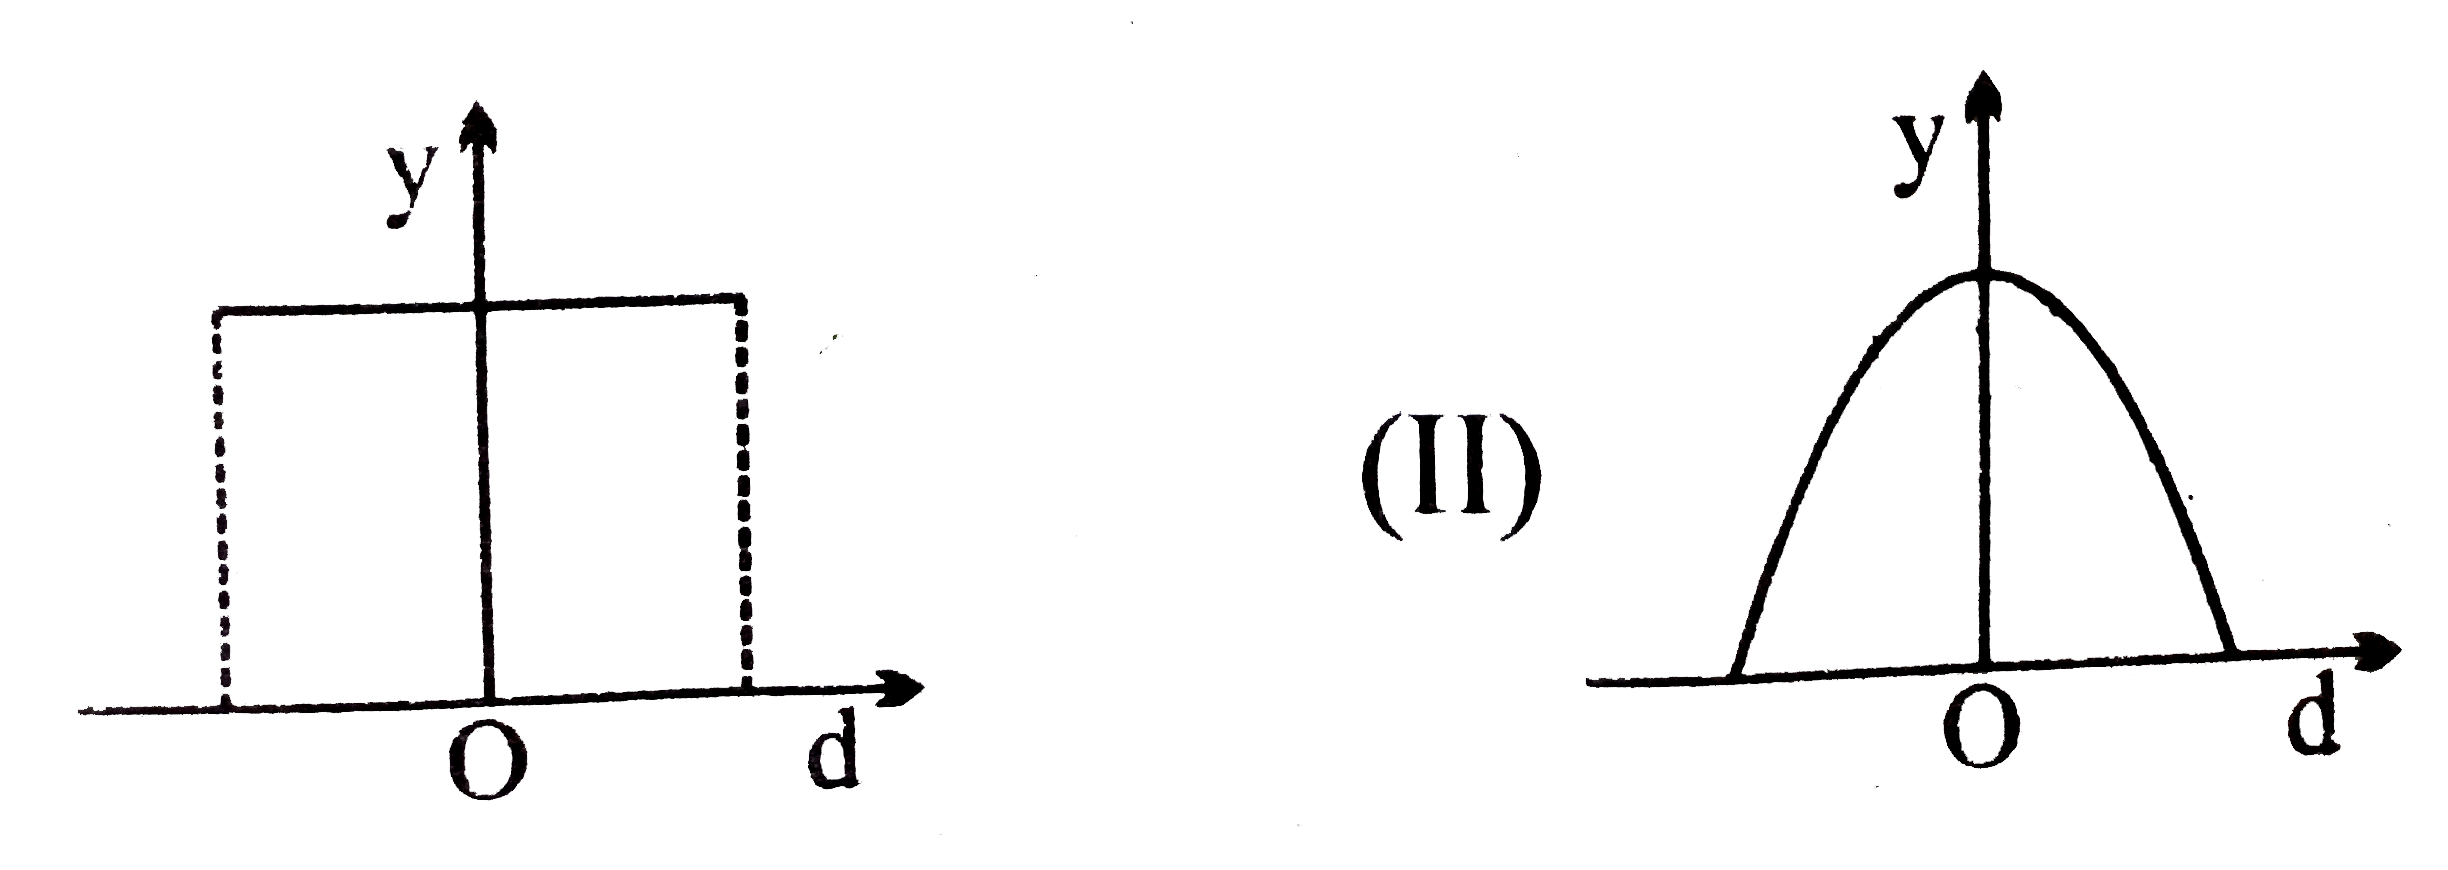 ,
, 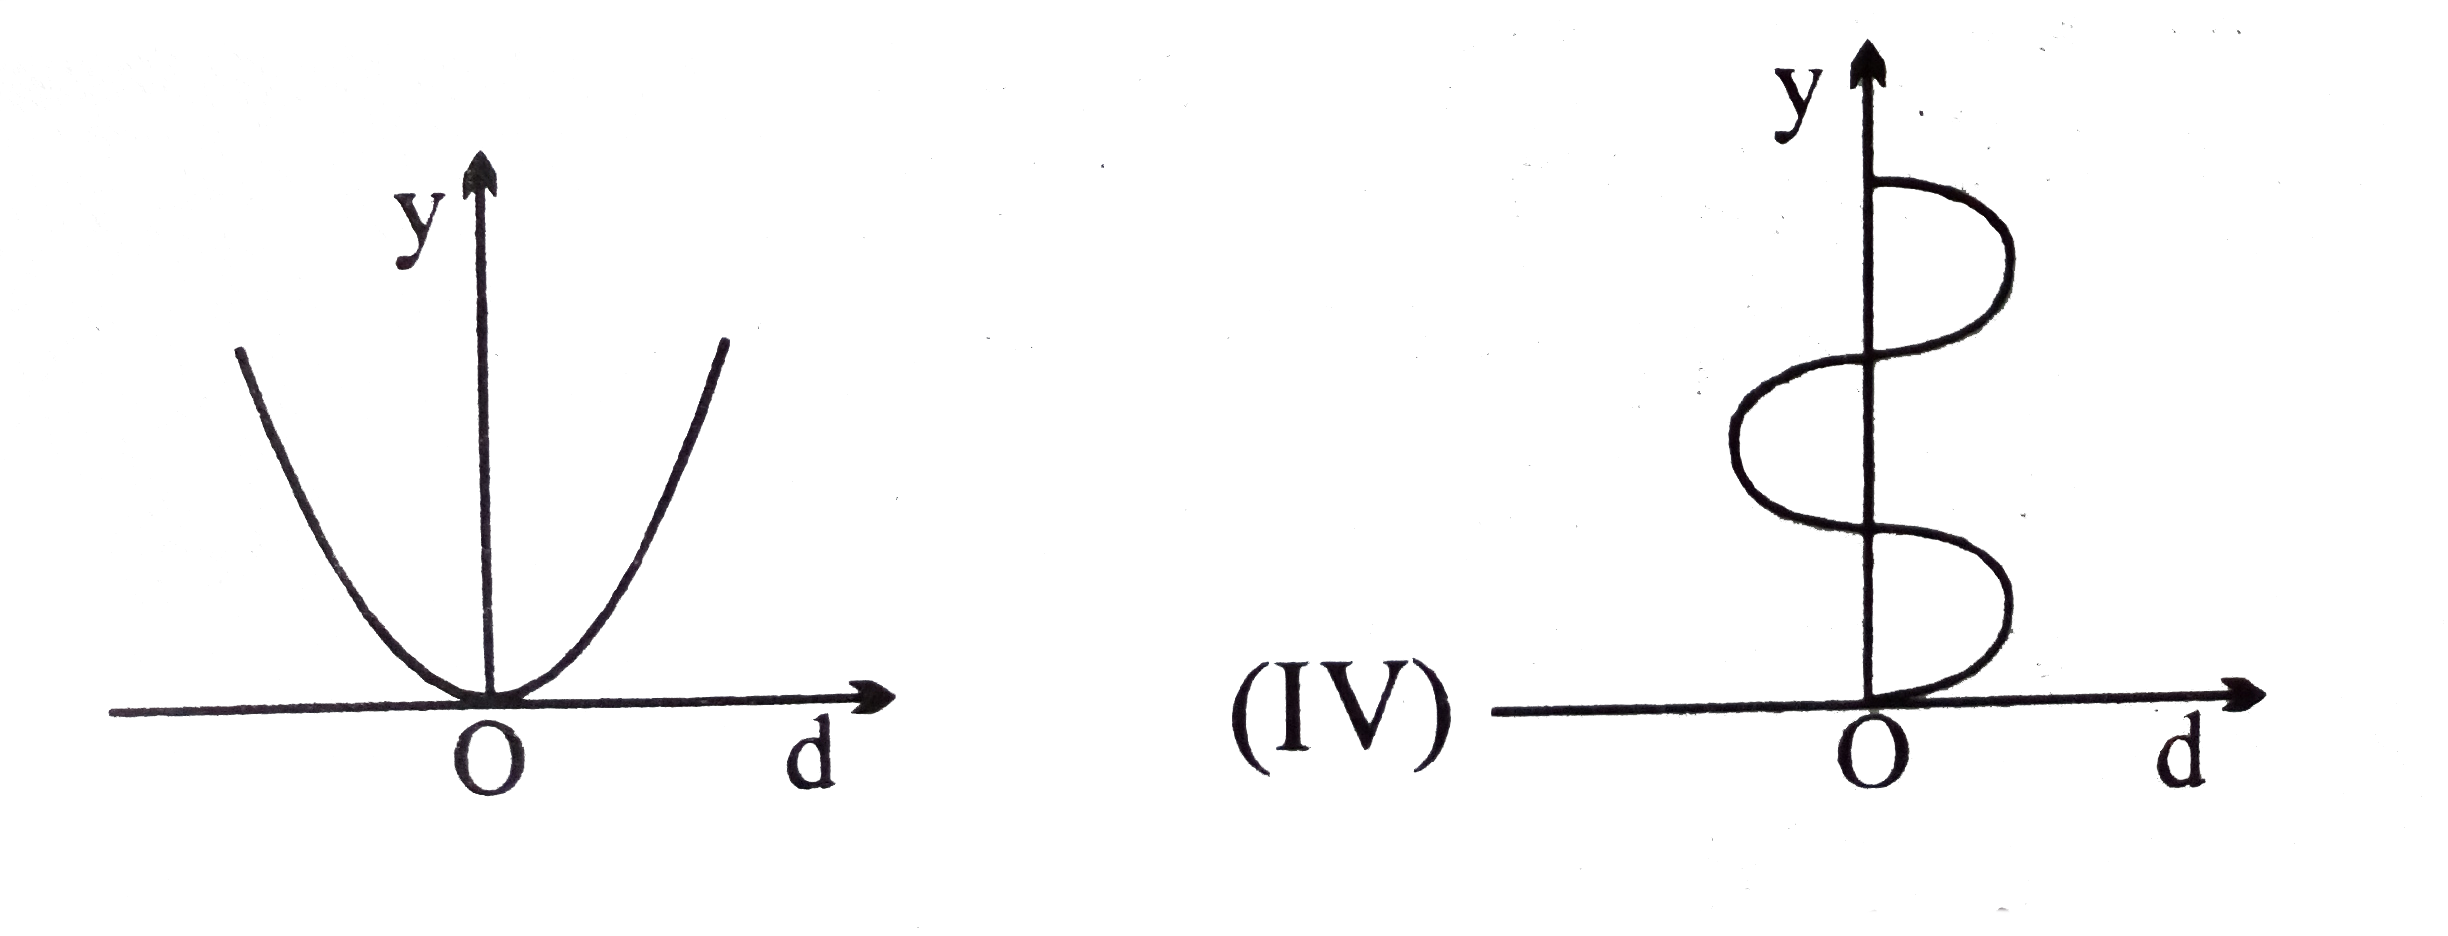
Which graphs best represents the relationship obtained when y is
The total energy of the system
I
II
III
IV
The correct Answer is:A
Figure
Similar Questions
Knowledge Check
The graphs in fugure show that a quantity Y varies with displacement d in a system undergoing simple harmonic motion.
(I)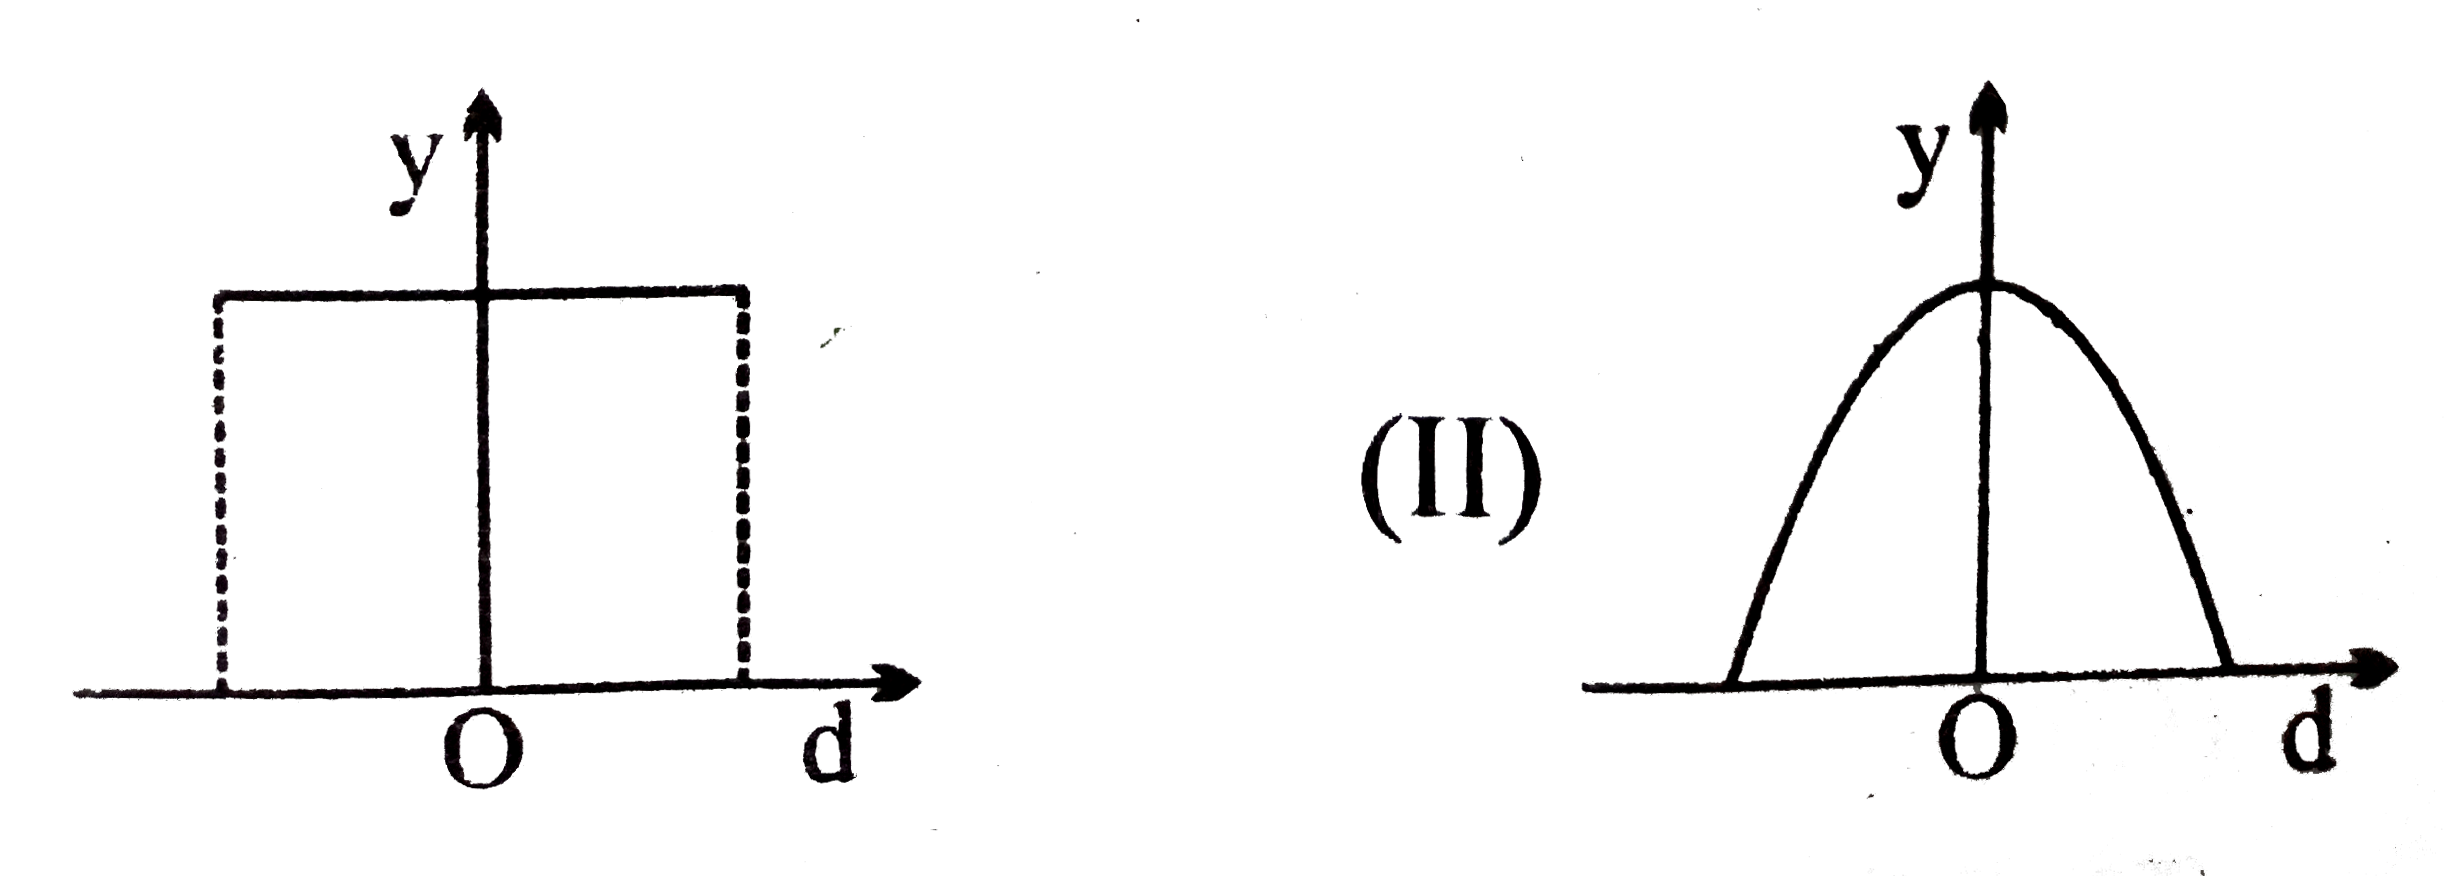 ,
, 
The timeAIBIICIIIDIVThe graphs in fugure show that a quantity Y varies with displacement d in a system undergoing simple harmonic motion.
(I) ,
, 
The unbalanced force acting on the system.AIBIICIIIDNoneIn Q. 29, Which os the folllowing graphs best represents the current flowing from X to Y?
A B
B C
C D
D
Which of the following graph best represents the relationship between absolute temperature of gas and the average kinetic energy of the gas molecules?
View SolutionIn case of simple harmonic motion –
(A) What fraction of total energy is kinetic and what fraction is potential when displacement is one half of the amplitude.
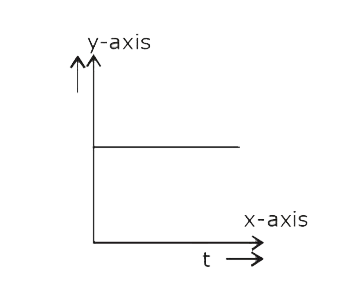
View SolutionIn the graph shown in figure, which quantity associated with projectile motion is plotted along y-axis ?
View SolutionThe displacement-time graph of a particle executing simple harmonic motion is shown in the figure
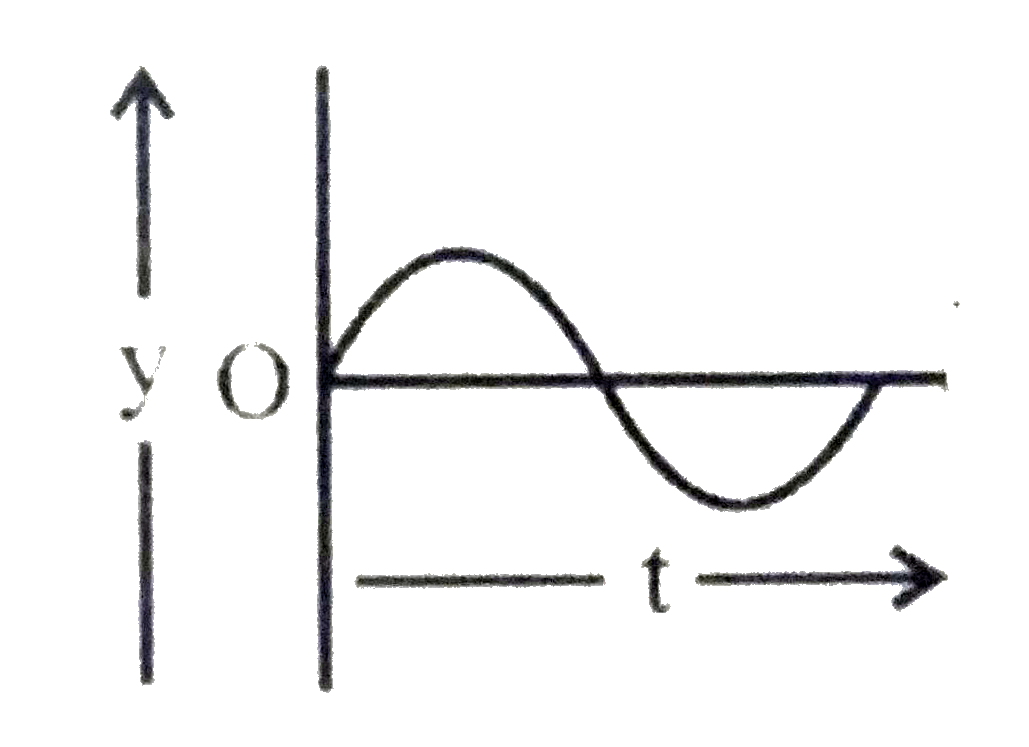
Which one of the following graphs is the correct forcetime graph for the motion of the particle ?
View SolutionFor a simple harmonic oscillator moving along a straight line, the graphs which represent the variation of kinetic energy K, potential energy U and total energy T with displacement are
View Solution

