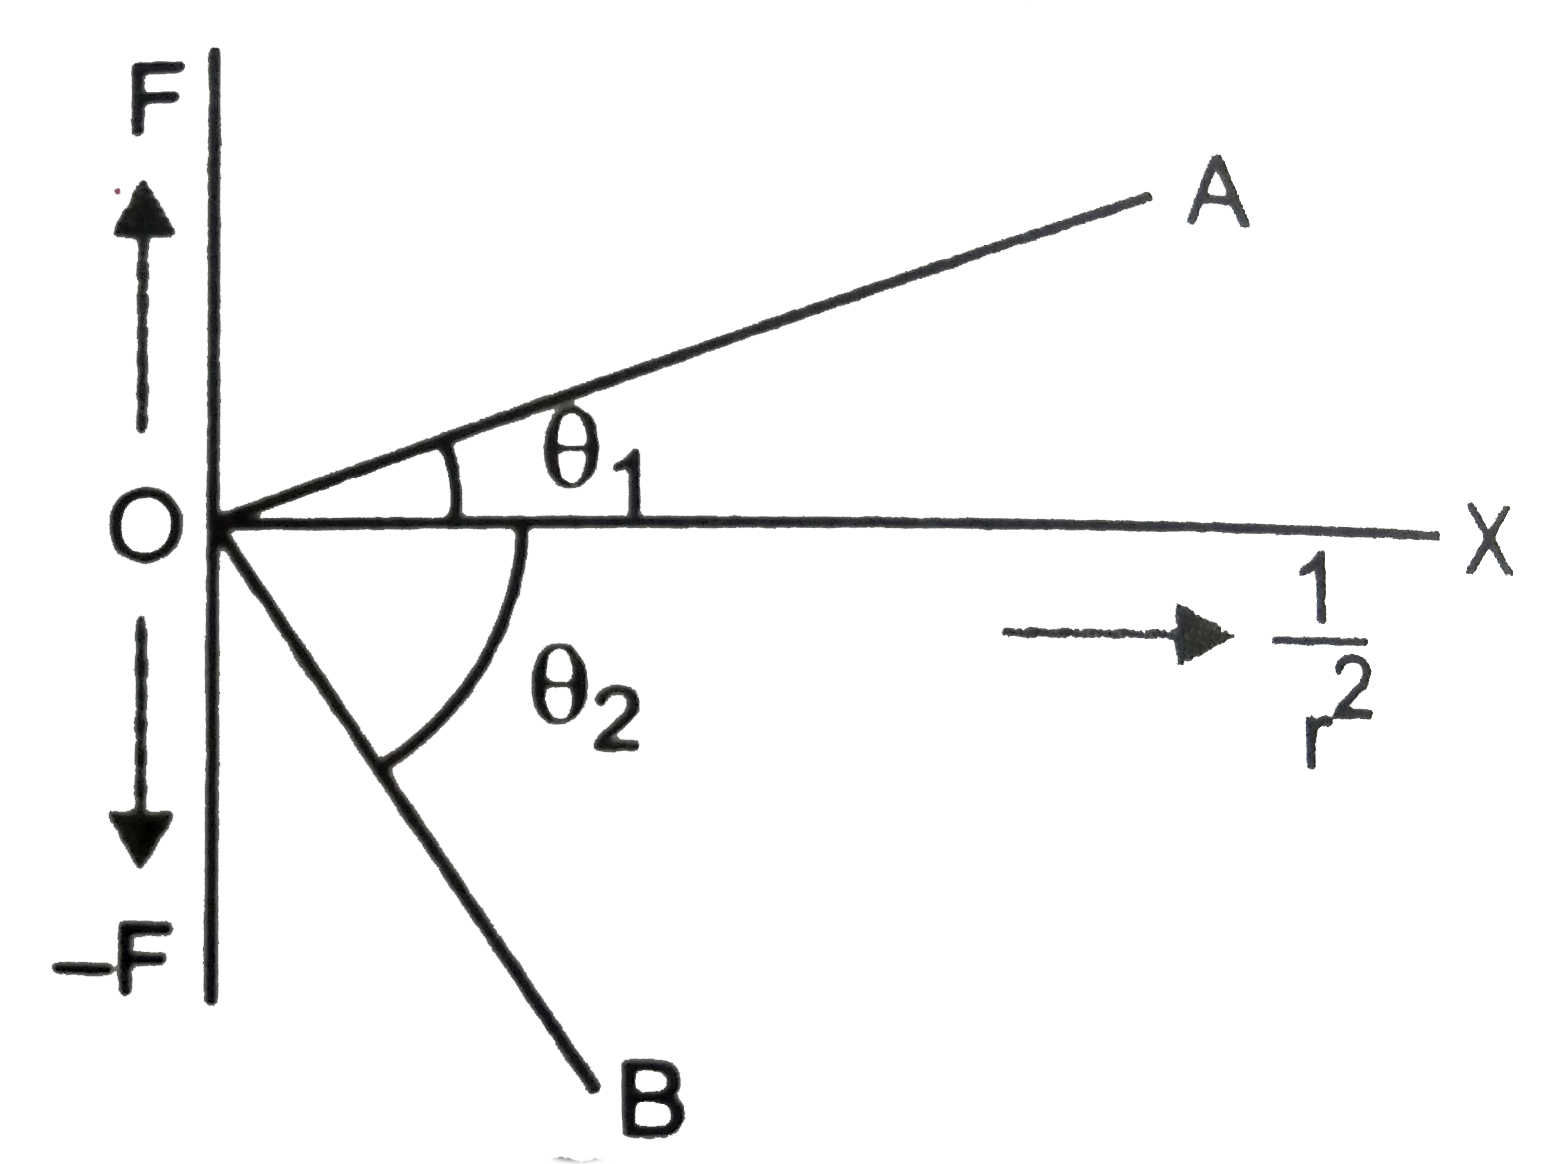
Plot a graph showing the variation of coulomb force (F) versus (1r2), where r is the distance between the two charges of each pair of charges:
(1μC,2μC)and(2μC−3μC). Interpet the graphs obtained.
According to Coulomb's law,
F∞q1q2 and F=∞1r2
Therefore, both pairs of charges graph between
F and 1r2 is a straight line. Between (1μC,2μC), force is positive/ repulsive and proportional to 1(2)=2. Between (2μCand−3μC) force is negative/ attractive and proportional to 2(3)=6
Therefore, in Fig 1(a).25, OA represents the variation between F and l/r2 for the pair (1μC,2μC) And ,OB represents the variation between F and l/r2 for the secound pair (2μC,−3μC). 
Topper's Solved these Questions
- BOOK - PRADEEPCHAPTER - ELECTROSTATICSEXERCISE - SHORT ANSWER QUESTIONS9videos
ELECTROSTATICS
- BOOK - PRADEEPCHAPTER - ELECTROSTATICSEXERCISE - CURIOSITY QUESTIONS4videos
ELECTROSTATICS
- BOOK - PRADEEPCHAPTER - ELECTROSTATICSEXERCISE - TYPICAL EXAMPLES1videos
ELECTROSTATICS
- BOOK - PRADEEPCHAPTER - ELECTRONIC DEVICESEXERCISE - Fill in the Blanks1videos
ELECTRONIC DEVICES
- BOOK - PRADEEPCHAPTER - MAGNETIC EFFECT OF CURRENT AND MAGNETISMEXERCISE - Competition Focus (Multiple Choice Questions)2videos
MAGNETIC EFFECT OF CURRENT AND MAGNETISM
Similar Questions
Plot a graph showing the variation of coulomb force (F) versus (1r2) where r is the distance between the two charges of each pair of charges :(1μC,2μC)and(2μC,−3μC). Interpret the graphs obtained.
View SolutionPlot a graph showing the variation of coulomb force (F) versus (1r2), where r is the distance between the two charges of each pair of charges:
(1μC,2μC)and(2μC−3μC). Interpet the graphs obtained.View Solution
Knowledge Check
- Question 1 - Select One
Which one of the following graphs represents the variation of electric field with distance r from the centre of a charged spherical conductor of radius R?
A B
B C
C D
D
- Question 2 - Select One
The distance between the two charges 25μC and 36μC is 11cm. At what point on the line joining the two, the intensity will be zero
AAt a distance of 5cm from 25μCBAt a distance of 5cm from 36μCCAt a distance of 10cm from 25μCDAt a distance of 11cm from 36μC - Question 3 - Select One
The force of attractions between two charges 8μC and −4μC is 0.2 N. Find the distance of separation.
A1.2 mB12 mC120 mD0.12 m
Plot a graph showing variation of de-broglie wavelength λ versus 1/√V, where V is accelerating potential for two particle A and P carrying same charge but of masses m1andm2(m1>m2). Which one of the two represents a particle of smaller mass and why?
View SolutionPlot a graph showing variation of de-broglie wavelength λ versus 1/√V, where V is accelerating potential for two particle A and P carrying same charge but of masses m1andm2(m1>m2). Which one of the two represents a particle of smaller mass and why?
View Solution(a) Use Gauss's law to show that due to a uniformly charged spherical shell of radius R, the electric field at any point situated outside the shell at a distance r from its centre is equal to the electric field at the same point, when the entire charge on the shell were concentrated at its centre. Also plot the graph showing the variation of electric field with r, for r≤R and r≥R. (b) Two point charges of +1μC and +4μC are kept 30 cm apart. How far from the +1μC charge on the line joining the two charges, will the net electric field be zero ?
View SolutionThe force between two charges 9μ C and 1μc separated by a distance 3m in space is..........
View SolutionTwo point charges +5μCand−2μC are kept at a distance of 1m in free space. The distance between the two zero potential points on the line joining the charges is
View Solution

