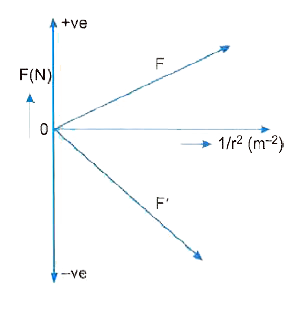
Plot a graph showing the variation of coulomb force (F) versus (1r2) where r is the distance between the two charges of each pair of charges :(1μC,2μC)and(2μC,−3μC). Interpret the graphs obtained.
Force between two charges q1μC1×10−6Candq2=2μC=2×10⁻⁶C separated by a distance r,
F=14π∈0.q1q2r2=9×109×1×10−6×2×10−6r2=18×10−3r2N
and force between two charges q1.=2μC=2×10⁻⁶Candq2.=−3μC=−3×10⁻⁶C separated by a distance r, the force
F.=14π∈0.q1.q2.r2=9×109×(2×10−6)×(−3×10⁻⁶)r2
=54×10−3r2N
Graph showing variation of force F and F. versus 1r2 is shown in adjoining From the graph we note following points:
(i) Both the graphs are straight line graphs. As force F is repulsive, its graph is in 1st quadrant. But force F. is attractive and the graph is in 4th quadrant.
(ii) As∣∣∣→F∣∣∣=3∣∣∣→F∣∣∣, hence slope of F −1r2 graph for second pair of charges is 3 times as compared to that for first pair of charges.

Topper's Solved these Questions
- BOOK - U-LIKE SERIESCHAPTER - ELECTRIC CHARGES AND FIELDS EXERCISE - LONG ANSWER QUESTIONS -I30videos
ELECTRIC CHARGES AND FIELDS
- BOOK - U-LIKE SERIESCHAPTER - ELECTRIC CHARGES AND FIELDS EXERCISE - LONG ANSWER QUESTIONS -II9videos
ELECTRIC CHARGES AND FIELDS
- BOOK - U-LIKE SERIESCHAPTER - ELECTRIC CHARGES AND FIELDS EXERCISE - VERY SHORT ANSWER QUESTIONS39videos
ELECTRIC CHARGES AND FIELDS
- BOOK - U-LIKE SERIESCHAPTER - DUAL NATURE OF RADIATION AND MATTEREXERCISE - SELF ASSESSMENT TEST SECTION-C (VERY SHORT ANSWER QUESTIONS)3videos
DUAL NATURE OF RADIATION AND MATTER
- BOOK - U-LIKE SERIESCHAPTER - ELECTROMAGNETIC WAVESEXERCISE - SELF ASSESSMENT TEST (SECTION C)1videos
ELECTROMAGNETIC WAVES
Similar Questions
Plot a graph showing the variation of coulomb force (F) versus (1r2), where r is the distance between the two charges of each pair of charges:
(1μC,2μC)and(2μC−3μC). Interpet the graphs obtained.View SolutionPlot a graph showing the variation of coulomb force (F) versus (1r2), where r is the distance between the two charges of each pair of charges:
(1μC,2μC)and(2μC−3μC). Interpet the graphs obtained.View Solution
Knowledge Check
- Question 1 - Select One
The distance between the two charges 25μC and 36μC is 11cm. At what point on the line joining the two, the intensity will be zero
AAt a distance of 5cm from 25μCBAt a distance of 5cm from 36μCCAt a distance of 10cm from 25μCDAt a distance of 11cm from 36μC - Question 2 - Select One
The force of attractions between two charges 8μC and −4μC is 0.2 N. Find the distance of separation.
A1.2 mB12 mC120 mD0.12 m
Plot a graph showing the variation of coulomb force (F) versus (1r2), where r is the distance between the two charges of each pair of charges:
(1μC,2μC)and(2μC−3μC). Interpet the graphs obtained.View SolutionThe distance between the two charges 25μC and 36μC is 11cm. At what point on the line joining the two, the intensity will be zero
View Solution(a) Use Gauss's law to show that due to a uniformly charged spherical shell of radius R, the electric field at any point situated outside the shell at a distance r from its centre is equal to the electric field at the same point, when the entire charge on the shell were concentrated at its centre. Also plot the graph showing the variation of electric field with r, for r≤R and r≥R. (b) Two point charges of +1μC and +4μC are kept 30 cm apart. How far from the +1μC charge on the line joining the two charges, will the net electric field be zero ?
View SolutionThe force of attractions between two charges 8μC and −4μC is 0.2 N. Find the distance of separation.
View SolutionThe force between two charges 9μ C and 1μc separated by a distance 3m in space is..........
View SolutionTwo charges one +5μC, and another −5μC ,are placed 1 mm apart . Calculate the dipole moment.
View Solution

