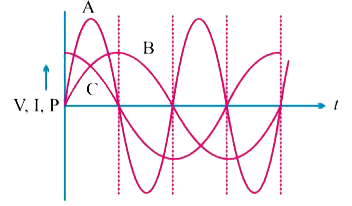
A derive 'X' is connected to an ac source V=V0sinωt.The variation of voltage ,current and power in one cycle is shown in the following graph:
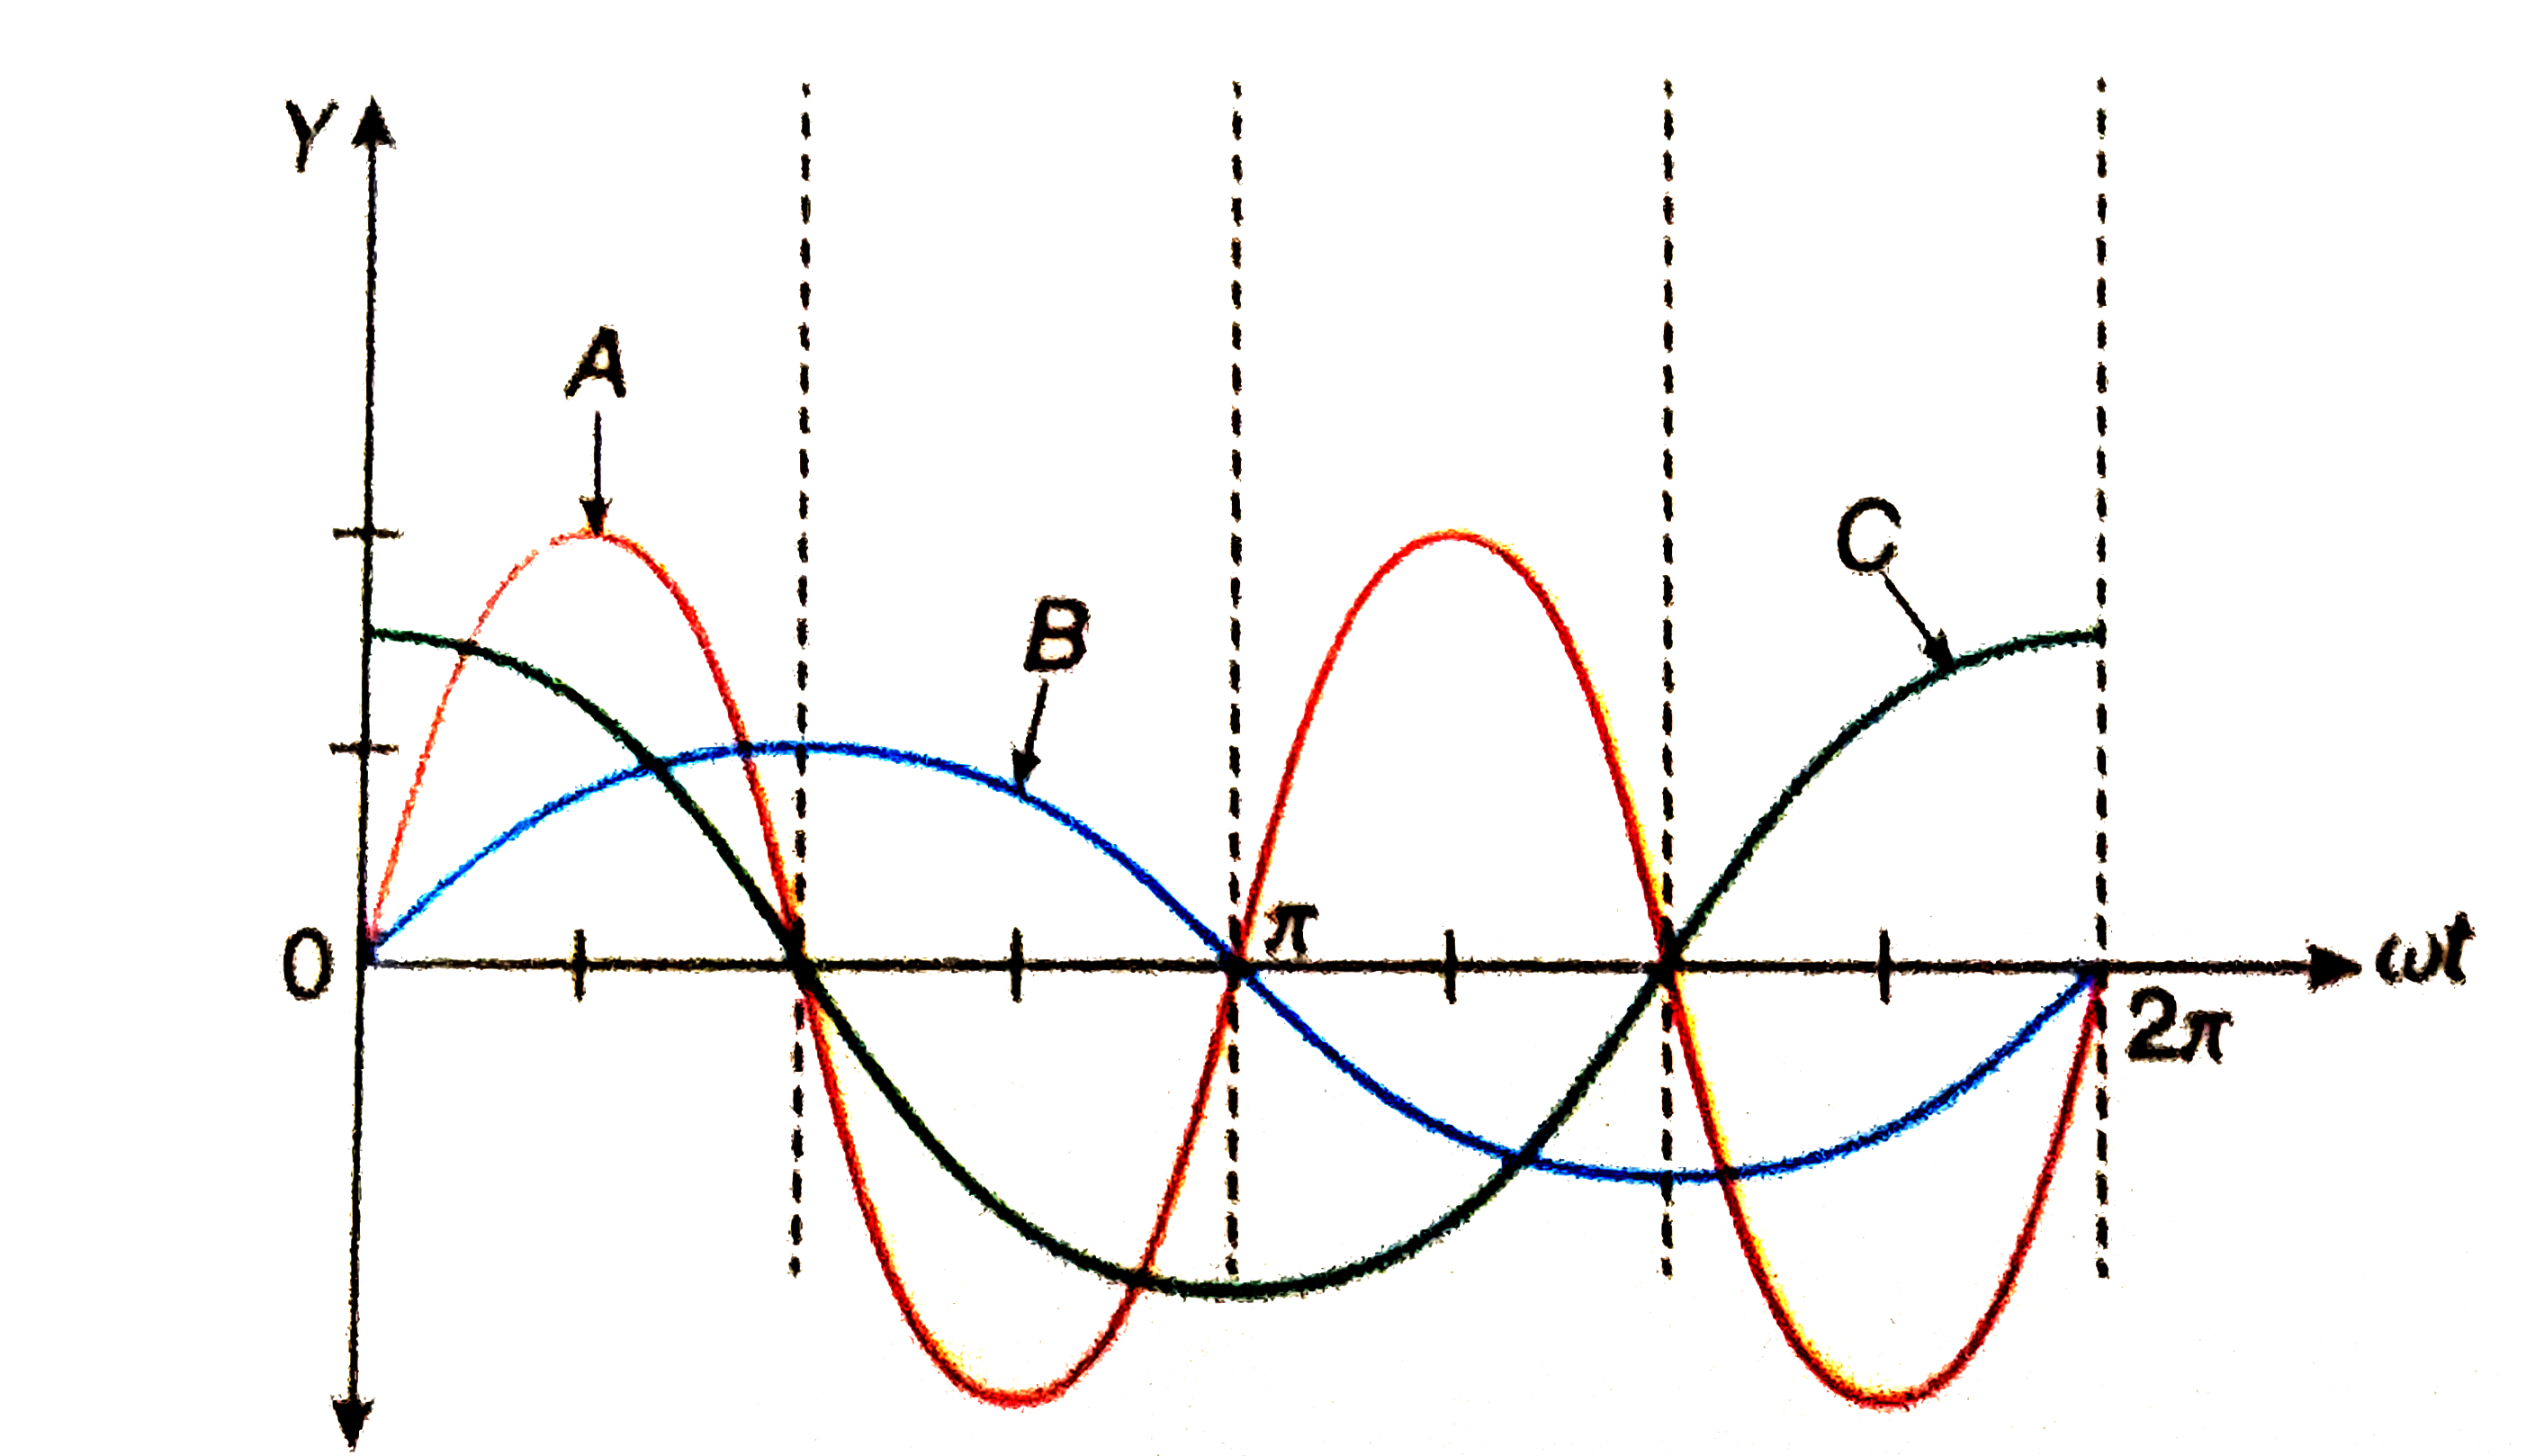
Which of the curves A,B and C represent the voltage , current and the power consumed in the circuit ? Justify your answer .Solution in Bengali
B represents voltage because it is sine wave.C represents current because current leads voltage by π2. A represents power because average power over one cycle is zero.
Topper's Solved these Questions
Similar Questions
A small signal voltage V(t) =V0sinωt is applied across an ideal capacitor C.
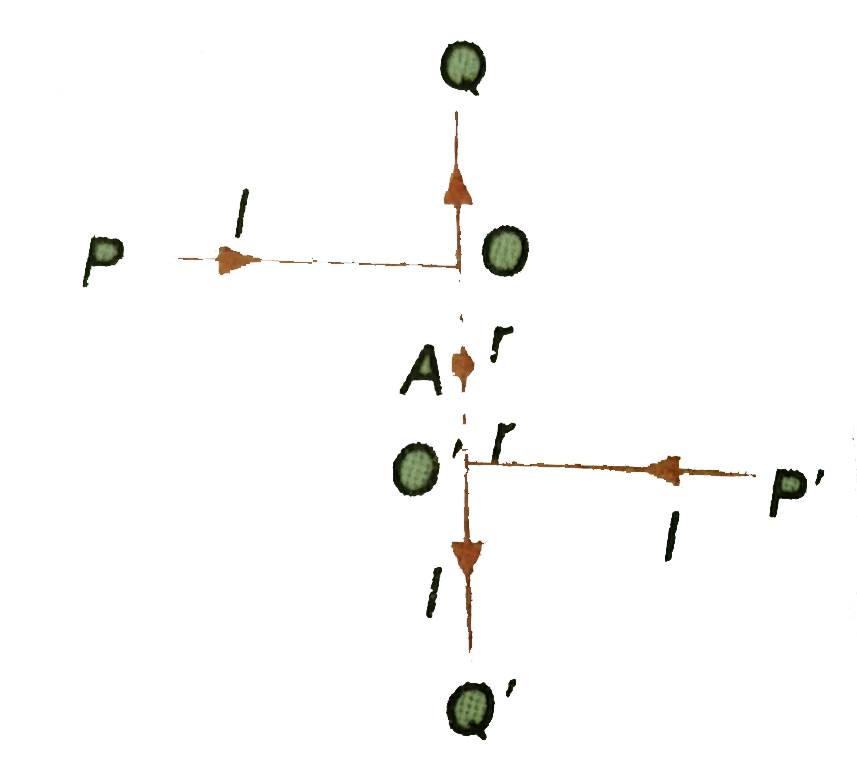
View SolutionThrough each of the two wires POQ and P'O'Q and electric current I is passing [Fig. 1.23]. The points Q,O,O and Q' are collinear. Determine the magnetic field at the midpoint A of OO'.
View SolutionUsing de Broglie's hypothesis , explain with the help of a suitable diagram , Bohr's second postulate of quantisation of energy levels in a hydrogen atom.
View SolutionIn an AC circuit with voltage V and current I, the power dissipated is
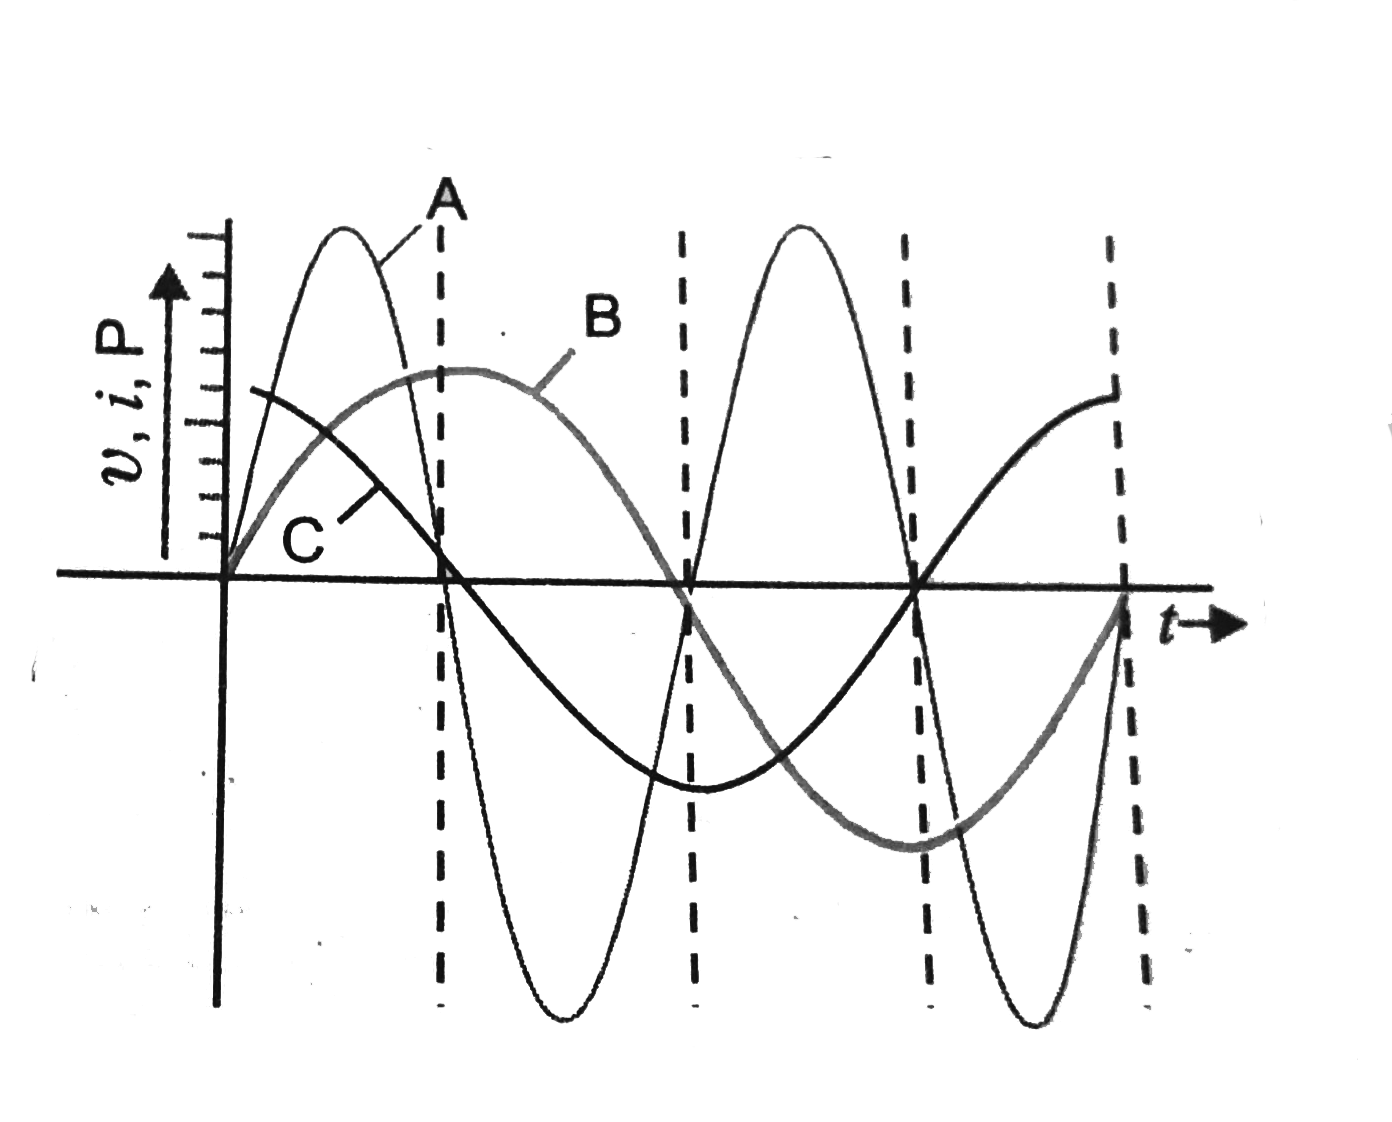
View SolutionA device 'X' is connected to an a.c. source. The variation of voltage, current and power in one complete cycle is shown in Fig.
(a) Which curve shows power consumption over a full cycle?
(b) What is the average power consuption over a cycle ?
(c) Identify the device 'X'.
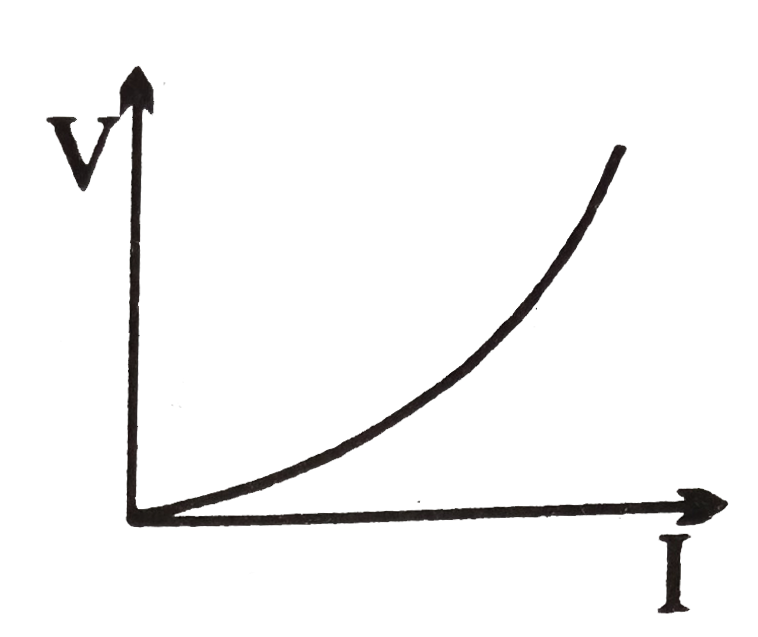
View SolutionThe variation of current (I) and voltage (V) is as shown in figure A. The variation of power P with current I is best shown by which of the following graph
View SolutionA device 'X' is connected to an AC source. The variation of voltage, current and power in one complete cycle is shown in figure. a) Which curve shows power consumption over a full cycle? b) What is the average power consumption over a cycle? c) Identify the device X.
View SolutionA device X is connected across an ac source of voltage V=V_0sinomegat . The current through X is given as I=I_0sin(omegat+pi/2) . Draw graphs showing variations of voltage and current with time over one cycle of ac, for X.
View SolutionA device ‘X’ is connected to an AC source. The variation of voltage, current and power in one complete cycle is shown in fig. (a) Which curves shows power consumption over a full cycle?
View SolutionA device ‘X’ is connected to an AC source. The variation of voltage, current and power in one complete cycle is shown in fig.
(b) What is the average power consumption over a cycle?
View SolutionA device ‘X’ is connected to an AC source. The variation of voltage, current and power in one complete cycle is shown in fig.
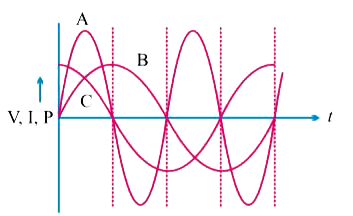
(c) Identify the device X if curve B shows voltage.
View SolutionA device 'X' is connected to an AC source. The variation of voltage, current and power in one complete cycle is shown in figure. a) Which curve shows power consumption over a full cycle? b) What is the average power consumption over a cycle? c) Identify the device X.
View SolutionA device 'X' is connected to an ac source V=V0sinωt. The variation of voltage, current and power in one cycle is shown in the following graph:
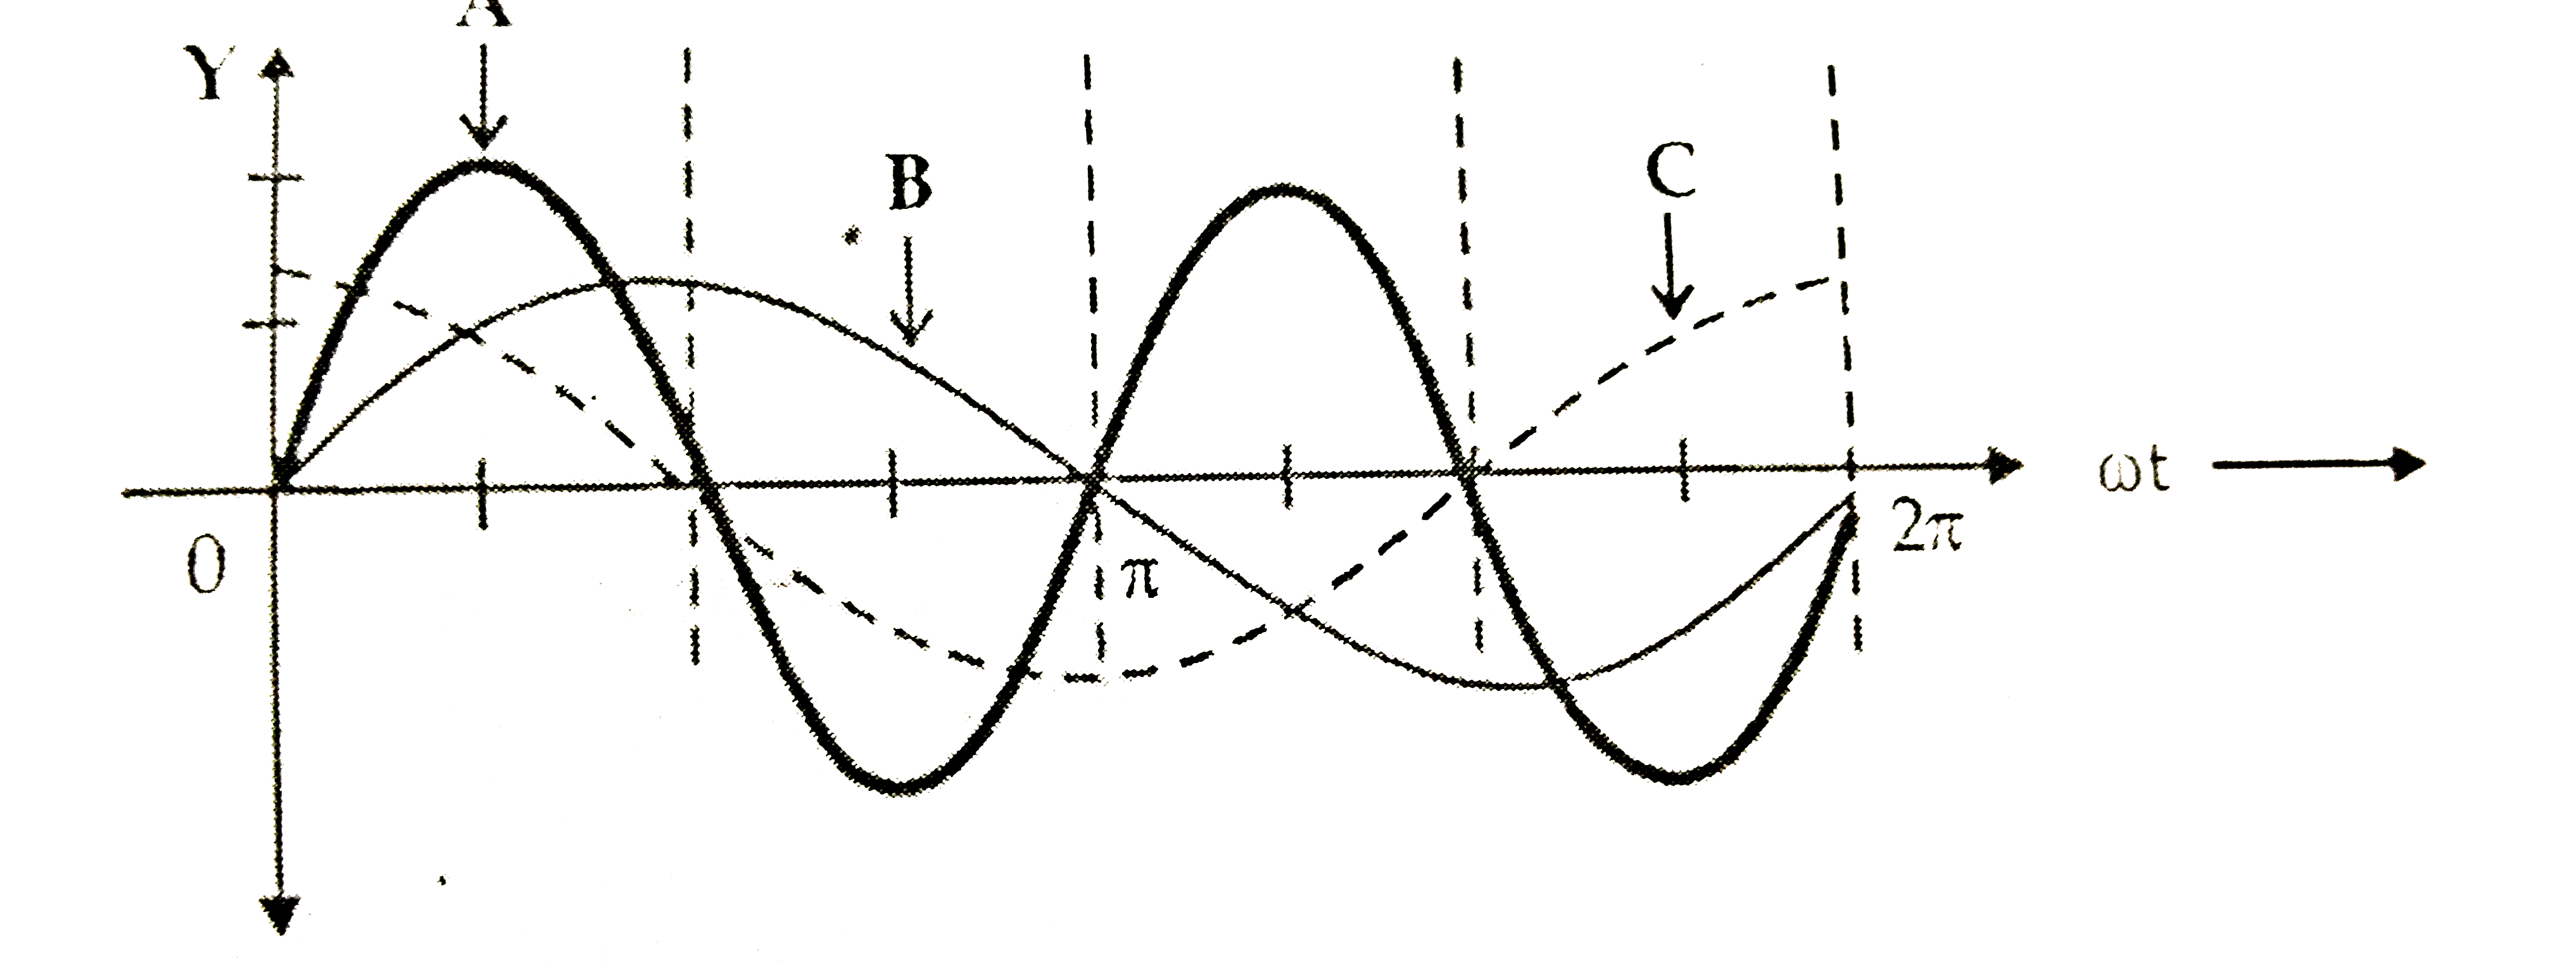
(a) Identify the device 'X'
(b) Which of the curves A,B and C represent the voltage , current and the power consumed in the circuit ? Justify your answer.
(c) How does its impedance wary with frequency of the source ?
(d) Obtain an expression for the current in the circuit and its phase relation with ac voltage.
View SolutionThe variation of current (I) and voltage (V) is as shown in figure A . The variation of power P with current I is best shown by which of the following graph
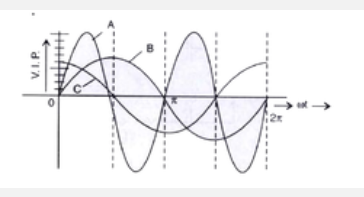
View SolutionA device .X. is connected to an ac source V= Vosinωt. The variation of voltage, current and power in one complete cycle is shown in the following figure.
(i) Which curve shows power consumption over a full cycle ?
(ii) Identify the device .X..
View Solution
