A device 'X' is connected to an ac source V=V0sinωt. The variation of voltage, current and power in one cycle is shown in the following graph:
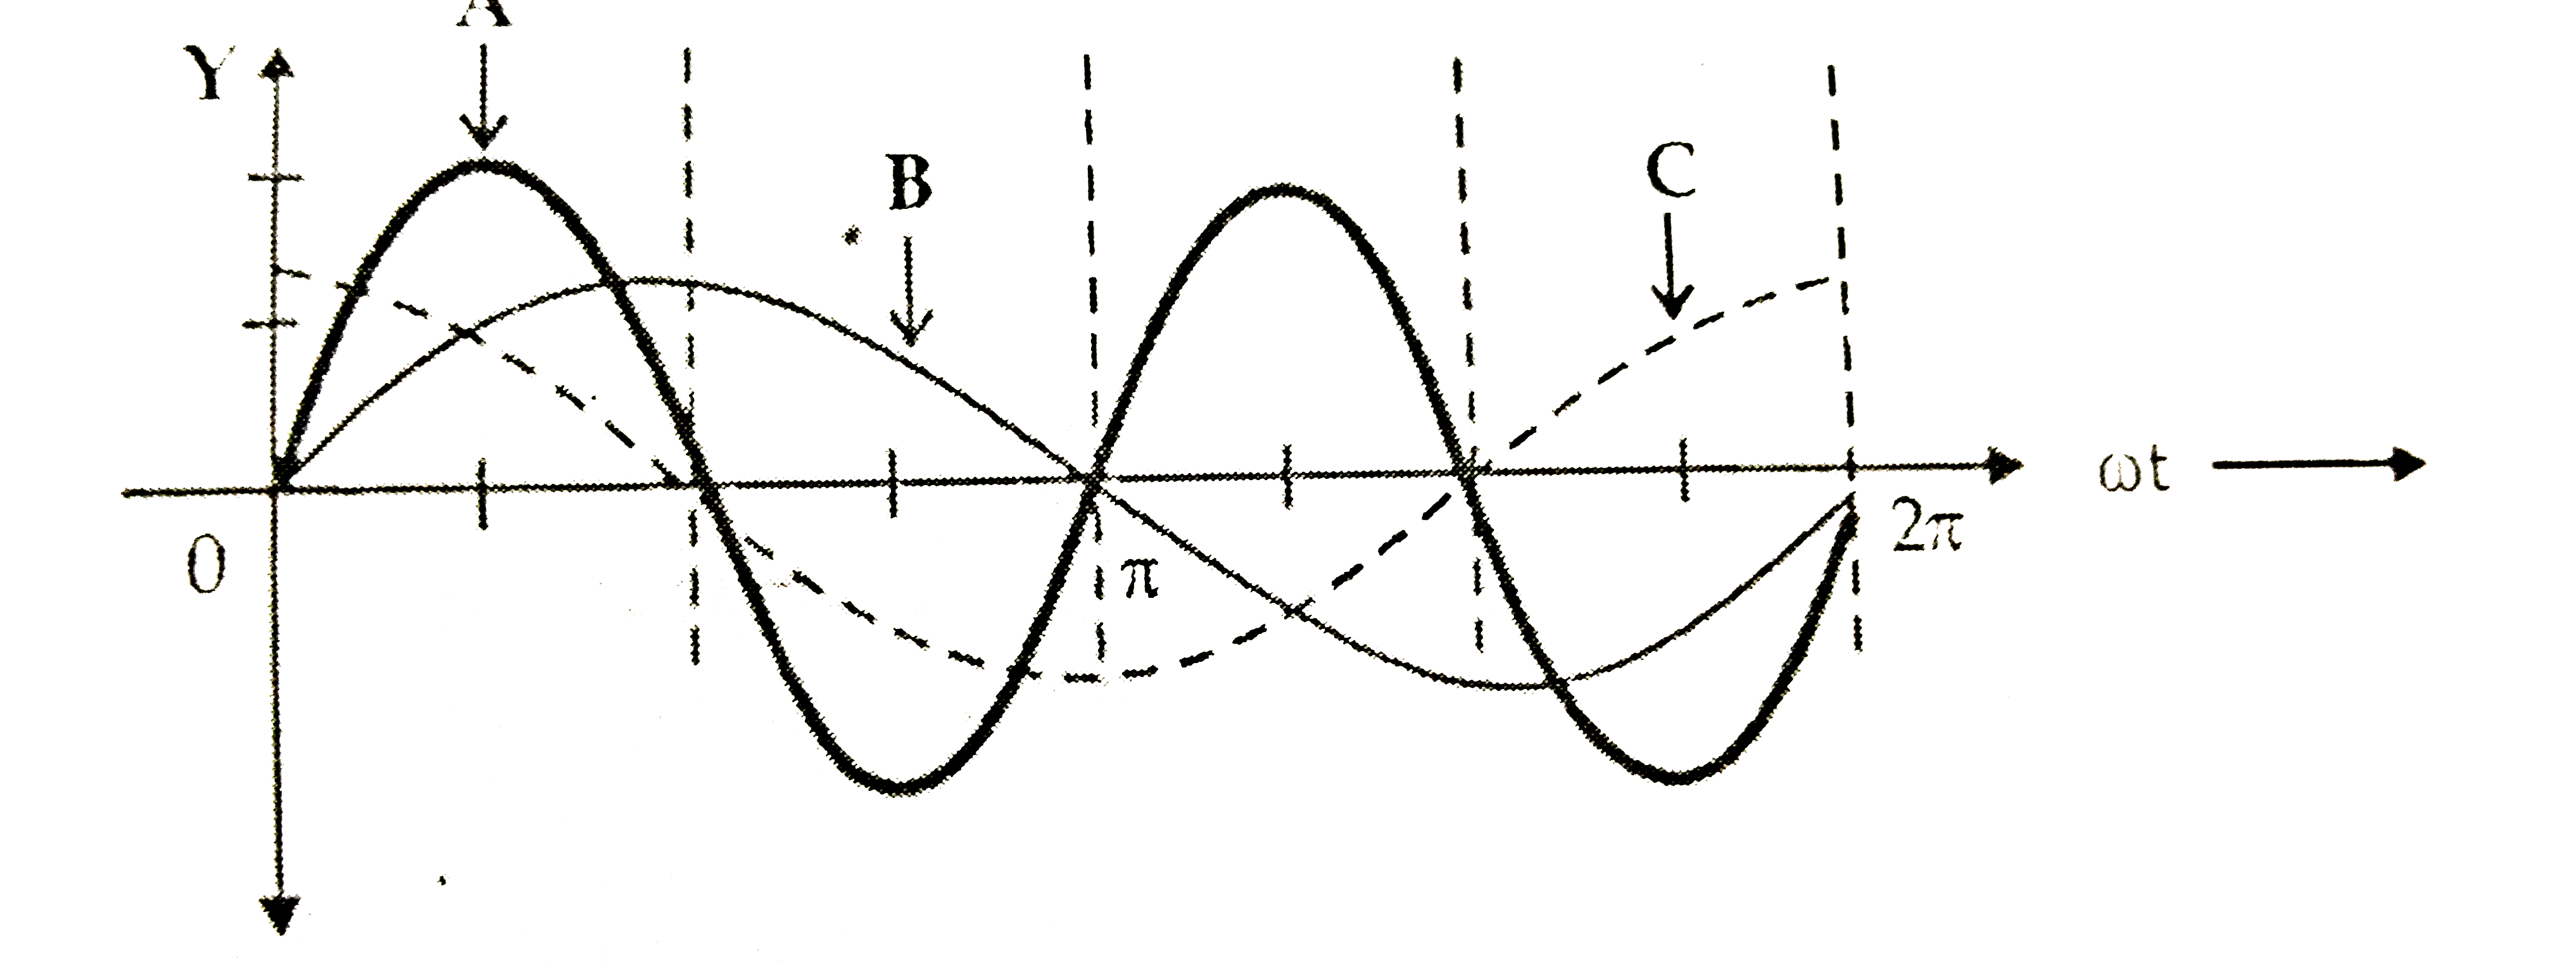
(a) Identify the device 'X'
(b) Which of the curves A,B and C represent the voltage , current and the power consumed in the circuit ? Justify your answer.
(c) How does its impedance wary with frequency of the source ?
(d) Obtain an expression for the current in the circuit and its phase relation with ac voltage.
Step by step video & image solution for A device 'X' is connected to an ac source V = V_(0) sin omegat. The variation of voltage, current and power in one cycle is shown in the following graph: (a) Identify the device 'X' (b) Which of the curves A,B and C represent the voltage , current and the power consumed in the circuit ? Justify your answer. (c) How does its impedance wary with frequency of the source ? (d) Obtain an expression for the current in the circuit and its phase relation with ac voltage. by Physics experts to help you in doubts & scoring excellent marks in Class 12 exams.
Updated on:21/07/2023Similar Questions
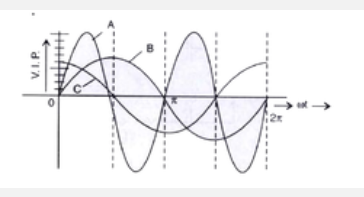
A device .X. is connected to an ac source V= Vosinωt. The variation of voltage, current and power in one complete cycle is shown in the following figure.
(i) Which curve shows power consumption over a full cycle ?
(ii) Identify the device .X..
View SolutionIn an AC circuit with voltage V and current I, the power dissipated is
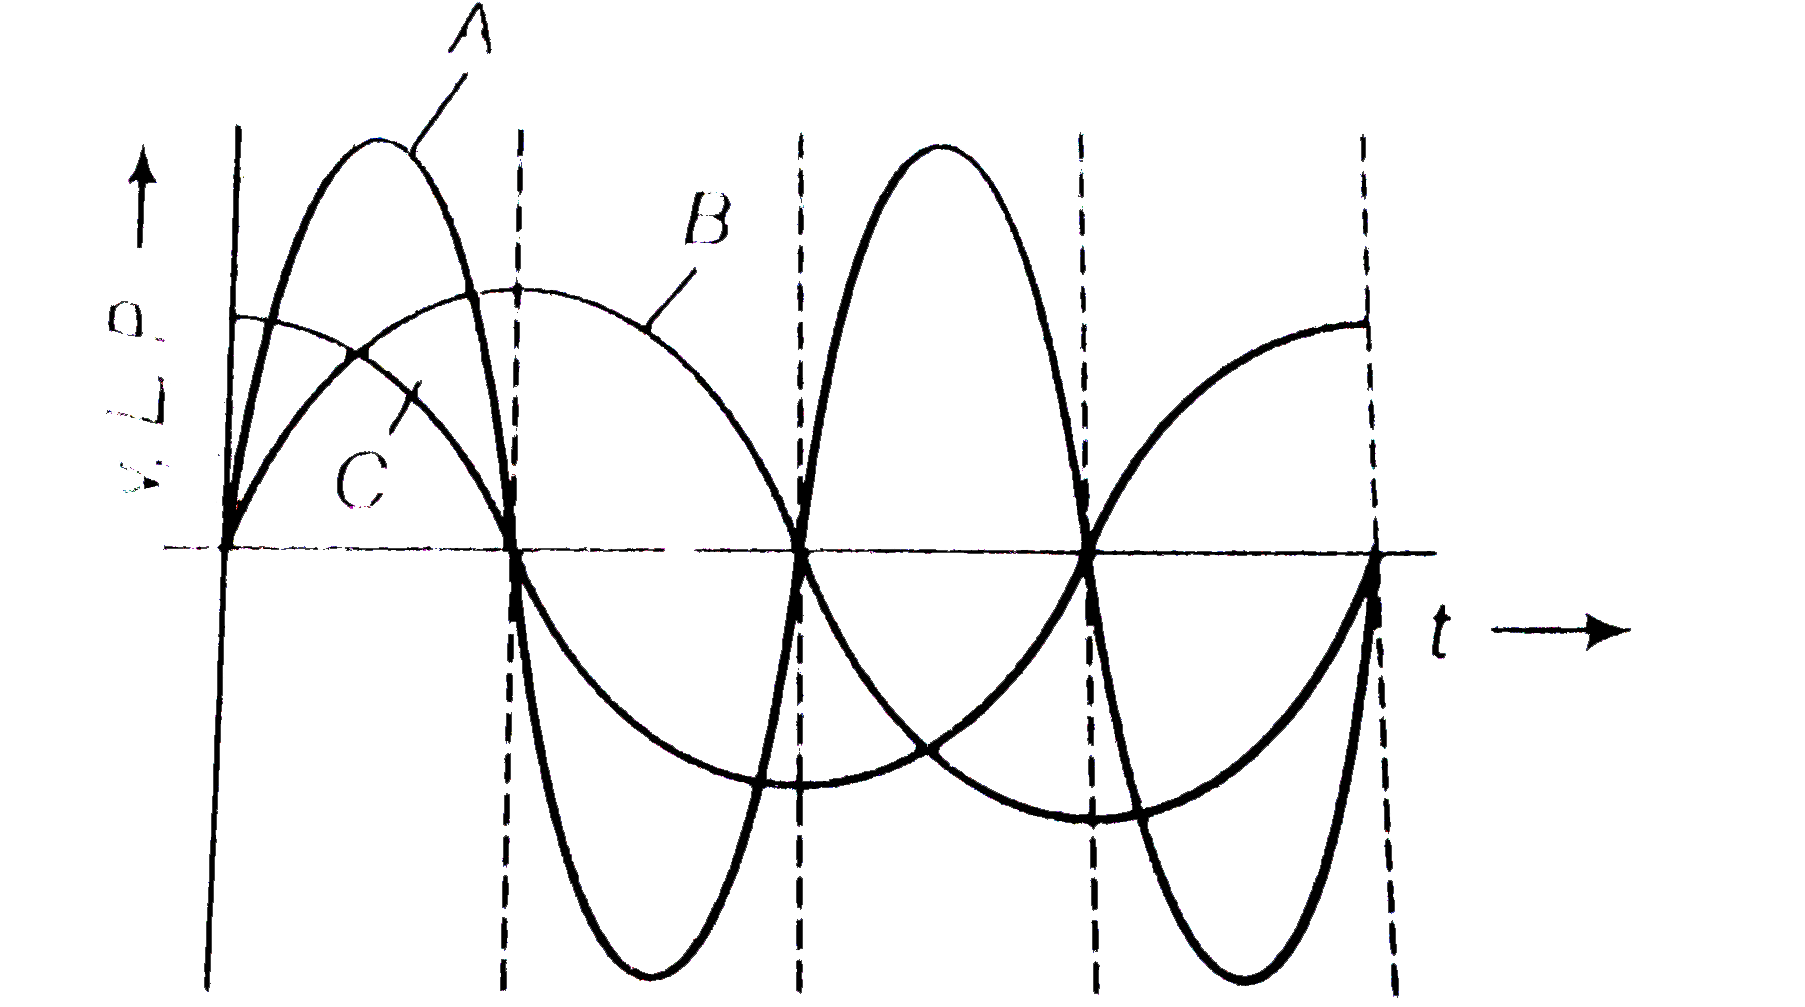
View SolutionA device 'X' is connected to an AC source. The variation of voltage, current and power in one complete cycle is shown in figure.
a) Which curve shows power consumption over a full cycle?
b) What is the average power consumption over a cycle?
c) Identify the device X.
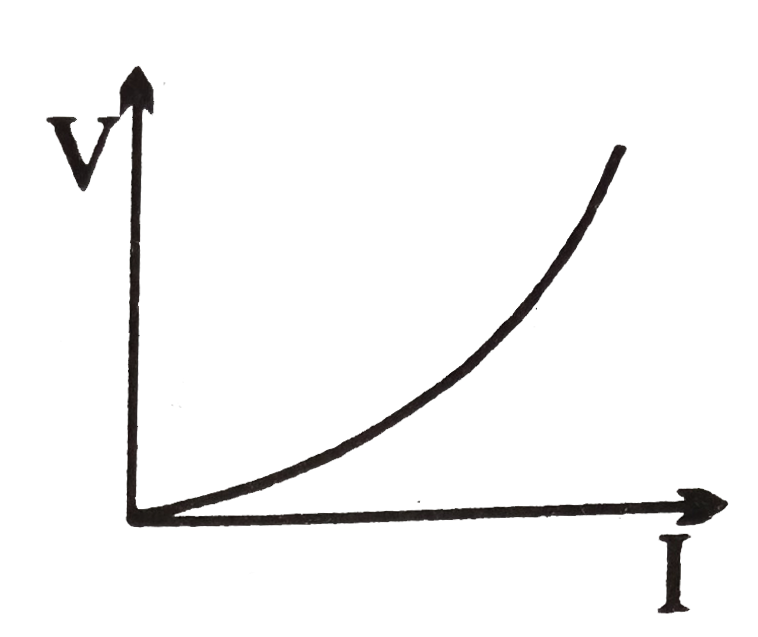
View SolutionThe variation of current (I) and voltage (V) is as shown in figure A. The variation of power P with current I is best shown by which of the following graph
View SolutionA device X is connected across an ac source of voltage V=V0sinωt. The current throught X is given as I=I0sin(ωt+π2)
(a) Identify the device X and write the expression for its reactance.
(b) Draw graph showing variation of voltage and current with time over one cycle of ac, for X.
How does the reactance of the device X vary with frequency of the ac? Show this variation graphically.
(d) Draw the phasor diagram for the device X.
View SolutionA 0.21H inductor and a 12ohm resistance are connected in series to a 220V. 50Hz ac source. Calculate the current in the circuit and the phase angle between the current and the source voltage.
View SolutionCurrent-voltage characteristics of two elements A and B are as shown in Figs. (a) and (b)
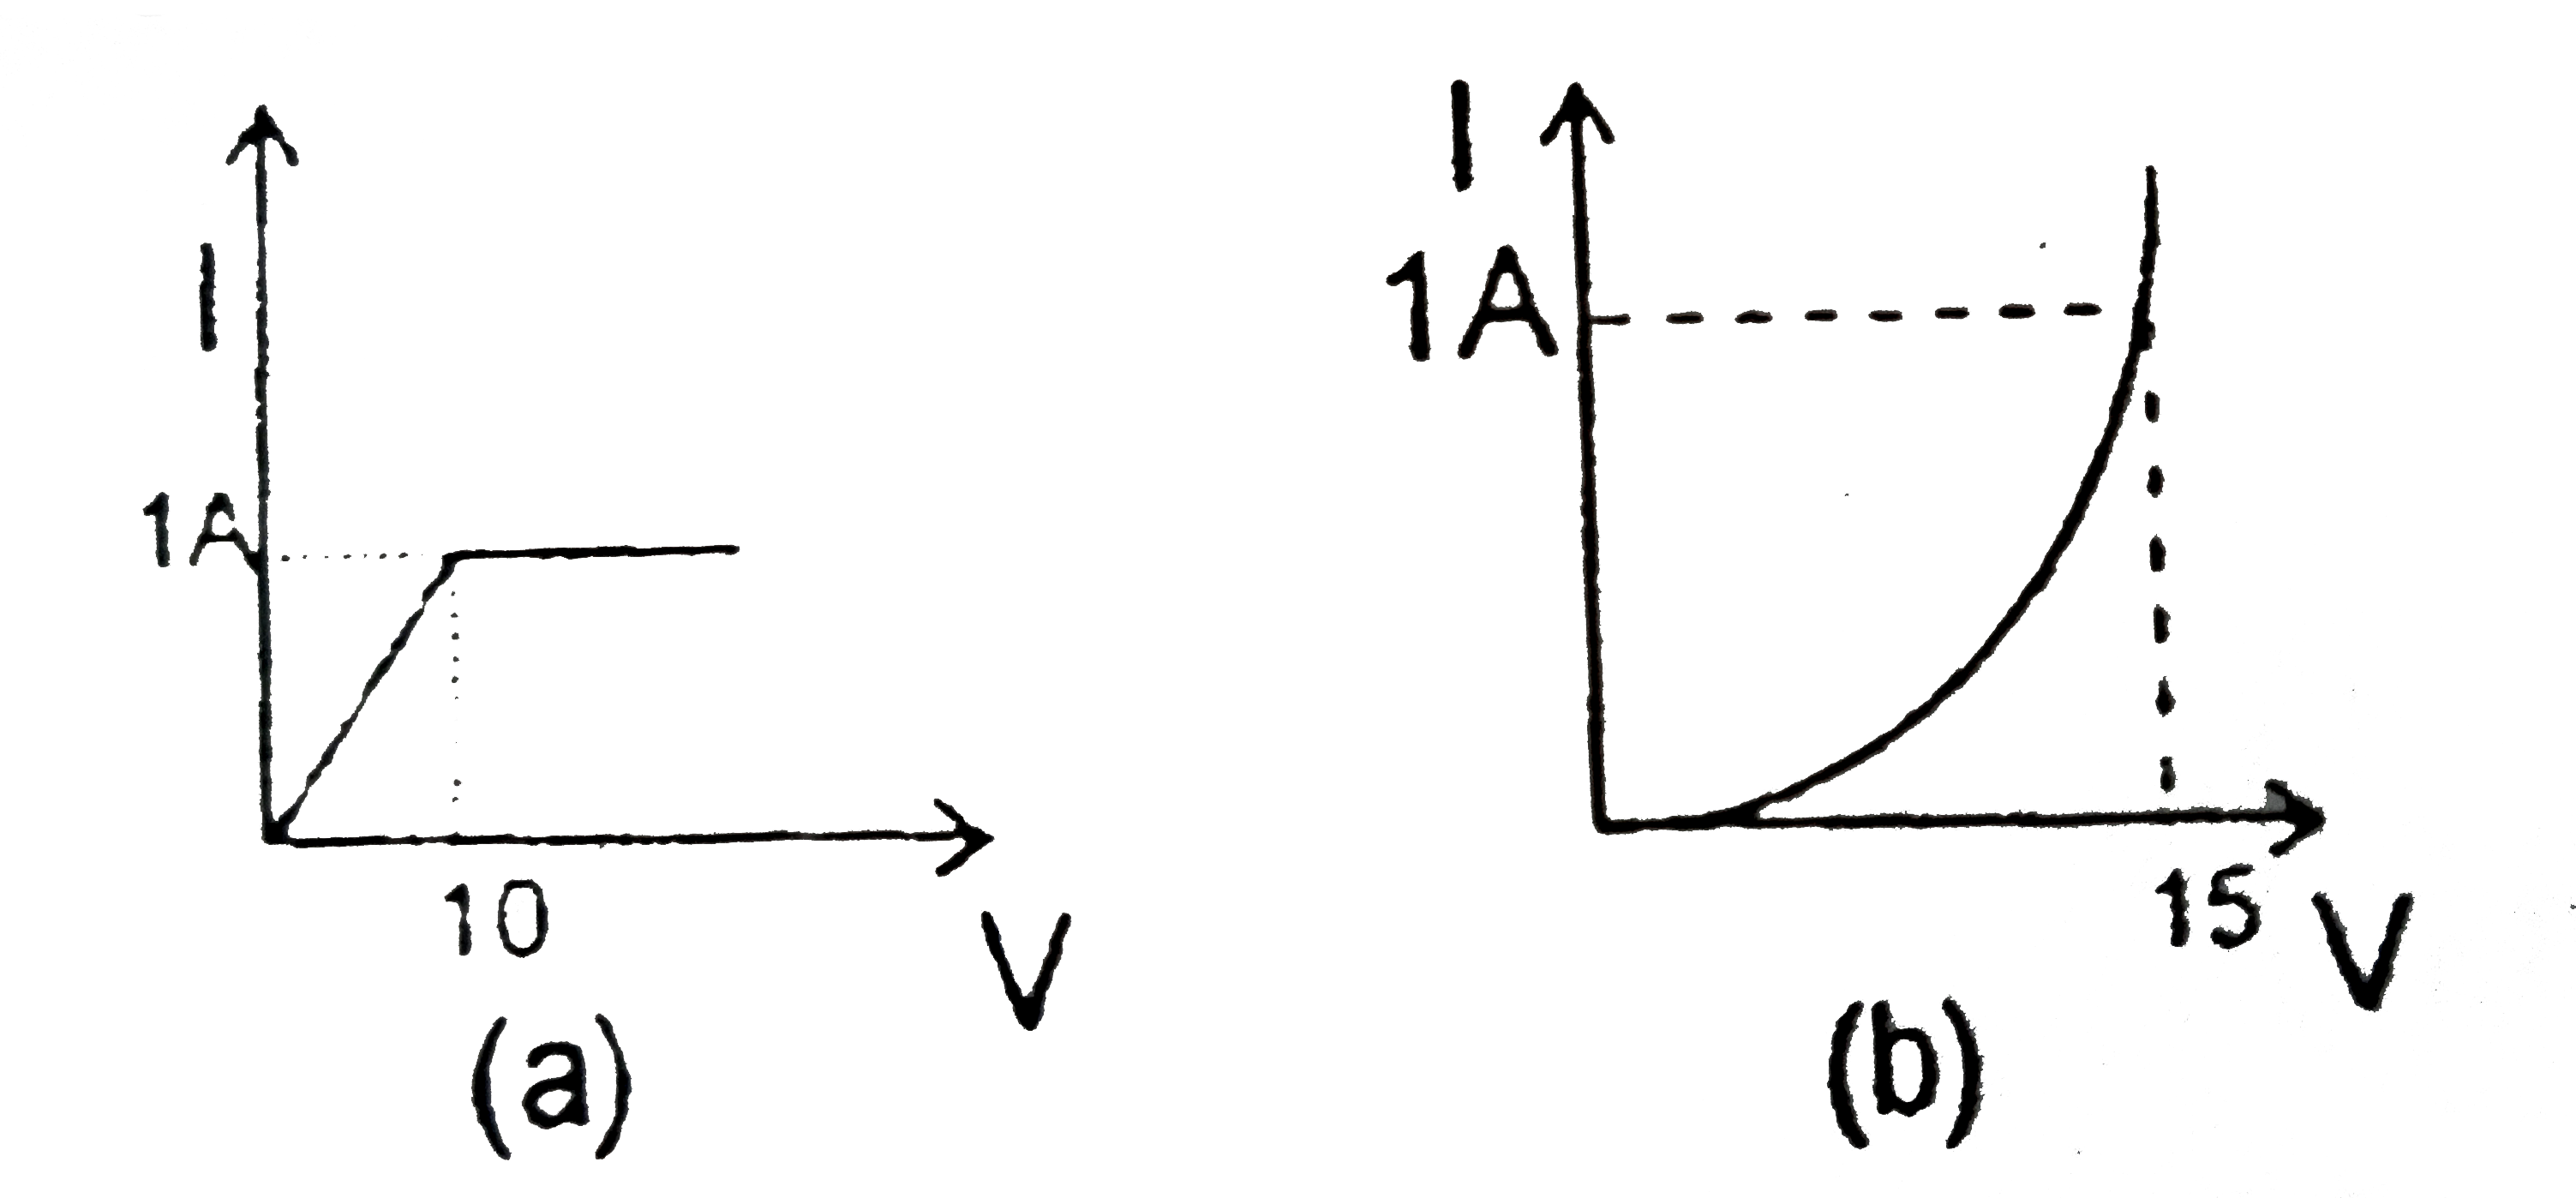
Which of the following graphs represents current voltage characteristics for their series combinations ?
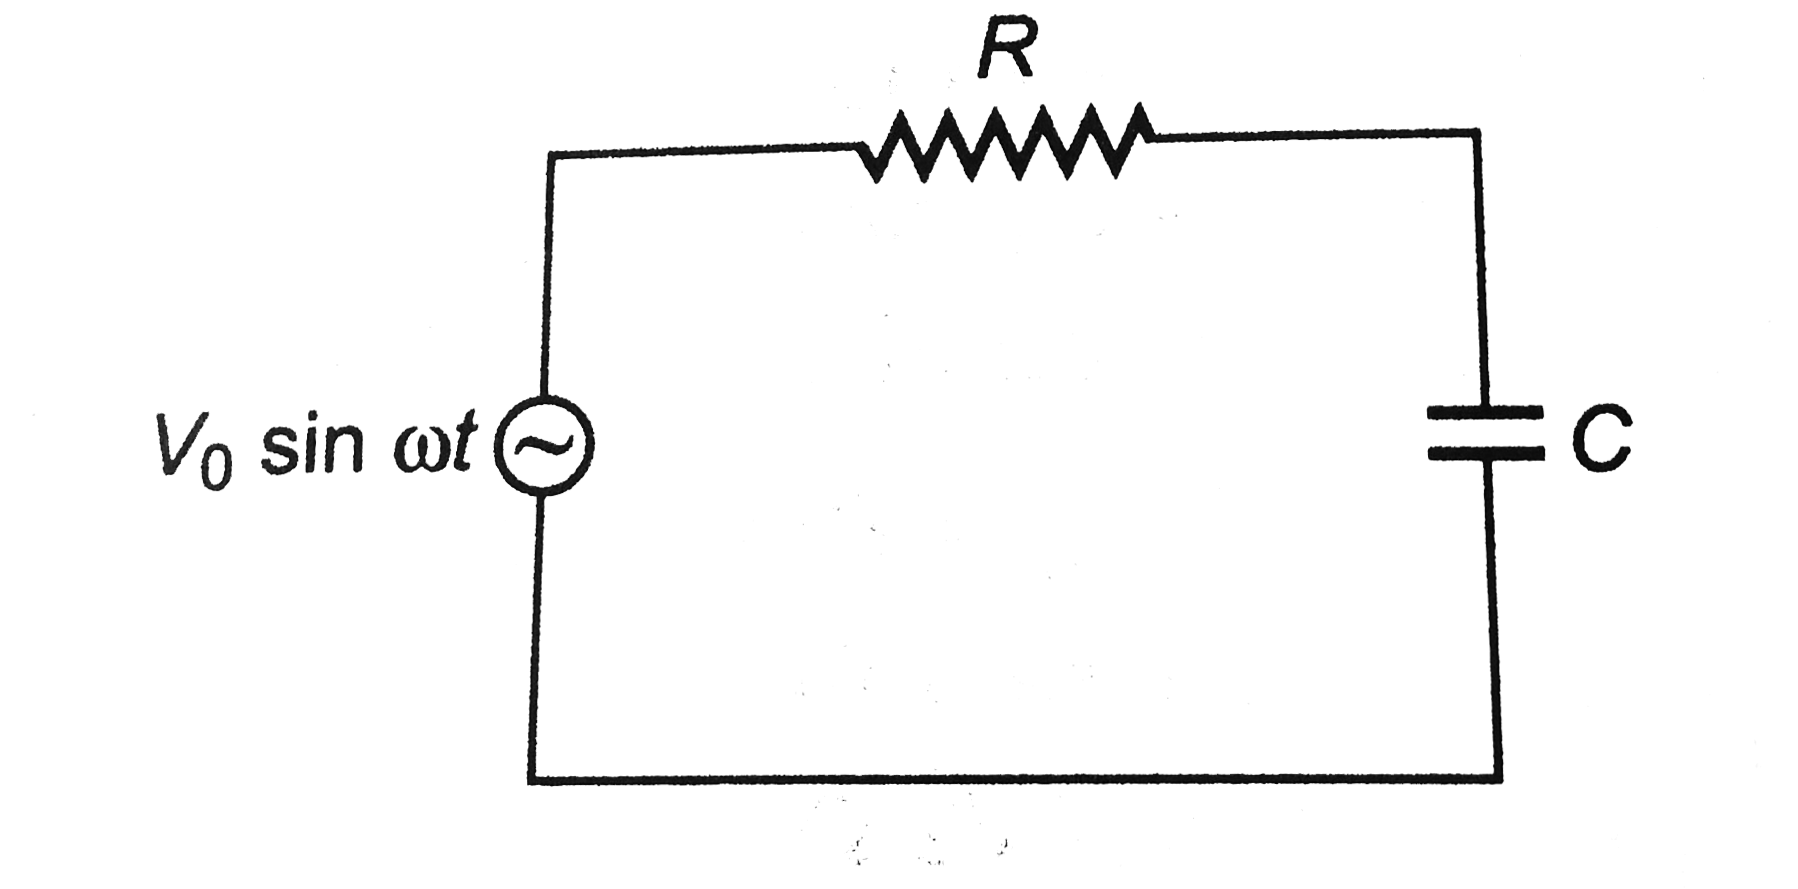
View SolutionAn AC voltage source V=V0sinωt is connected across resistance R and capacitance C as shown in figure. It is given that ωC=1R. The peak current is I0. If the angular frequency of the voltage source is changed to ω√3, then the new peak current in the circuit is
 .
.
View SolutionCurrent-voltage characteristics of two elements A and B are as shown below in Figs. (a) and (b).
(a)
Which of the following graphs represents current voltage characteristics for their series combinations ?
View SolutionWhen a voltage V=V0 cos ωt is applied across a resistor of resistance R, the average power dissipated per cycle in the resistor is given by
View Solution
