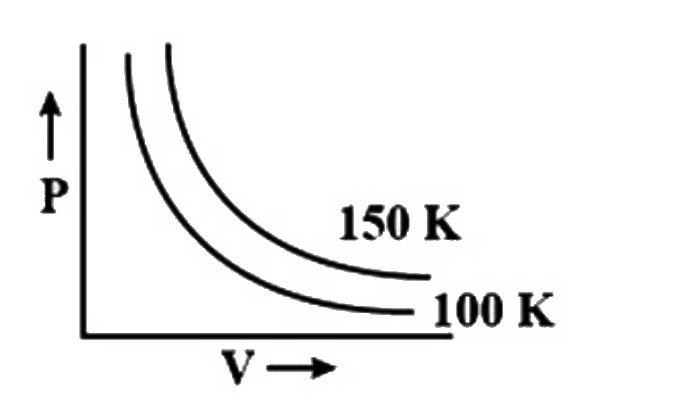
A graph is plotted between pressure and volume at different temperature. On the basis of the graph what changes will you observe in the volume if
(i) the pressure is increased at constant temperature
(ii) the temperature is decreased at constant pressure

volume increases in both the cases
volume decreases in both the cases
volume increases in (i) and decreases in (ii)
volume decreases in (i) and increases in (ii)
The correct Answer is:B
Volume decreases when pressure is in increases at constant temperature. When temperature is decreased at constant pressure the volume decreases.
Topper's Solved these Questions
- BOOK - MARVEL PUBLICATIONCHAPTER - STATES OF MATTER : GASES AND LIQUIDS EXERCISE - TEST YOUR GRASP50videos
STATES OF MATTER : GASES AND LIQUIDS
- BOOK - MARVEL PUBLICATIONCHAPTER - STATES OF MATTER : GASES AND LIQUIDS EXERCISE - HIGHER LEVEL35videos
STATES OF MATTER : GASES AND LIQUIDS
- BOOK - MARVEL PUBLICATIONCHAPTER - SOLID STATE EXERCISE - Multiple choice questions183videos
SOLID STATE
- BOOK - MARVEL PUBLICATIONCHAPTER - SURFACE CHEMISTRYEXERCISE - TEST YOUR GRASP35videos
SURFACE CHEMISTRY
Similar Questions
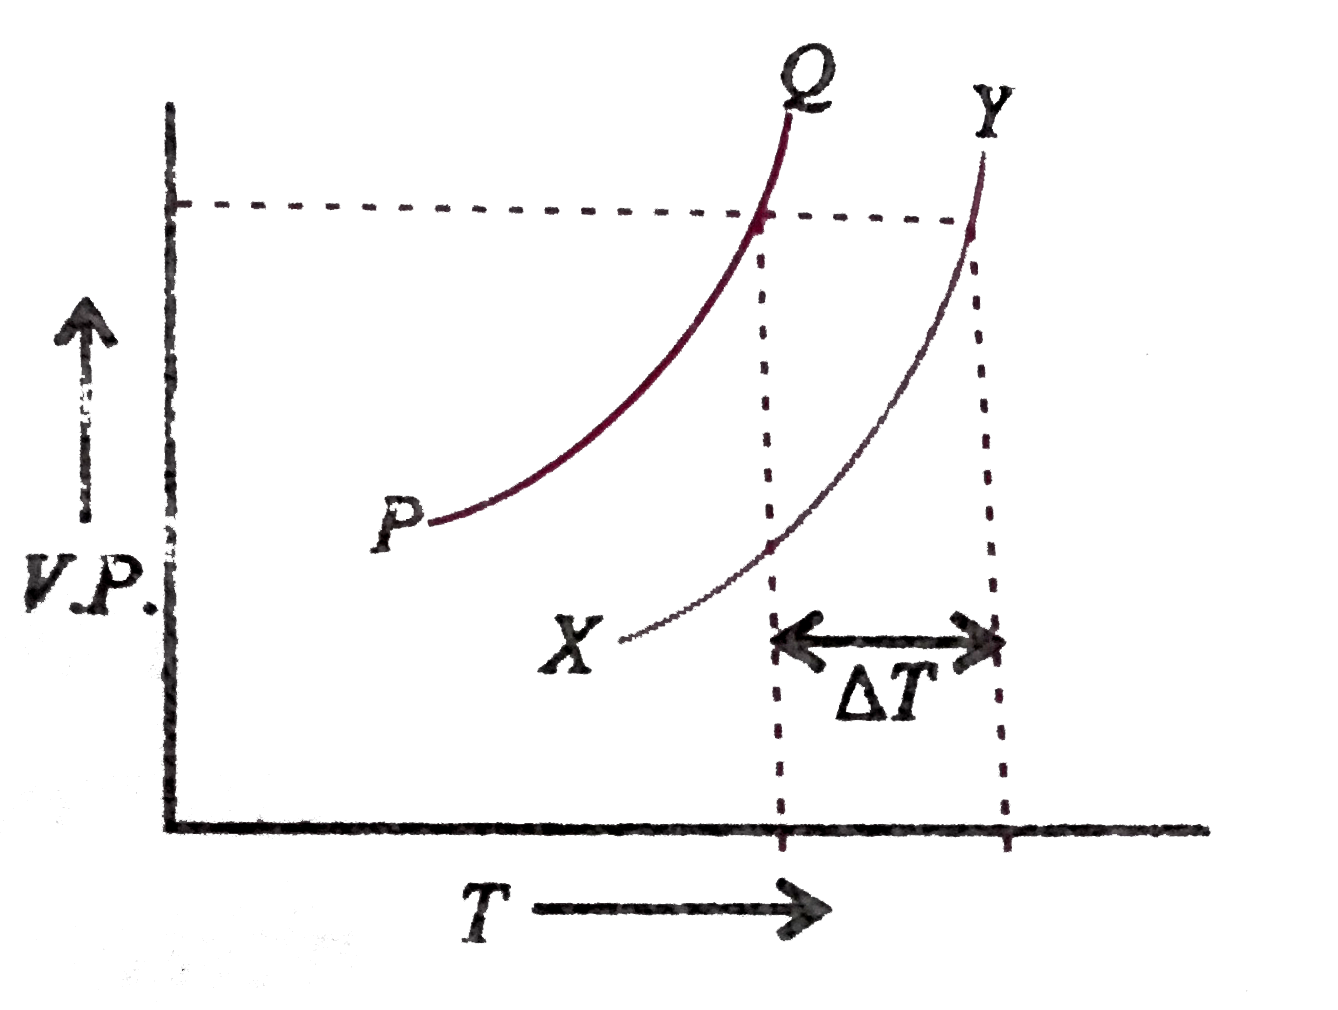
In the graph plotted between vapour pressure (V.P.) and temperature (T),
 View Solution
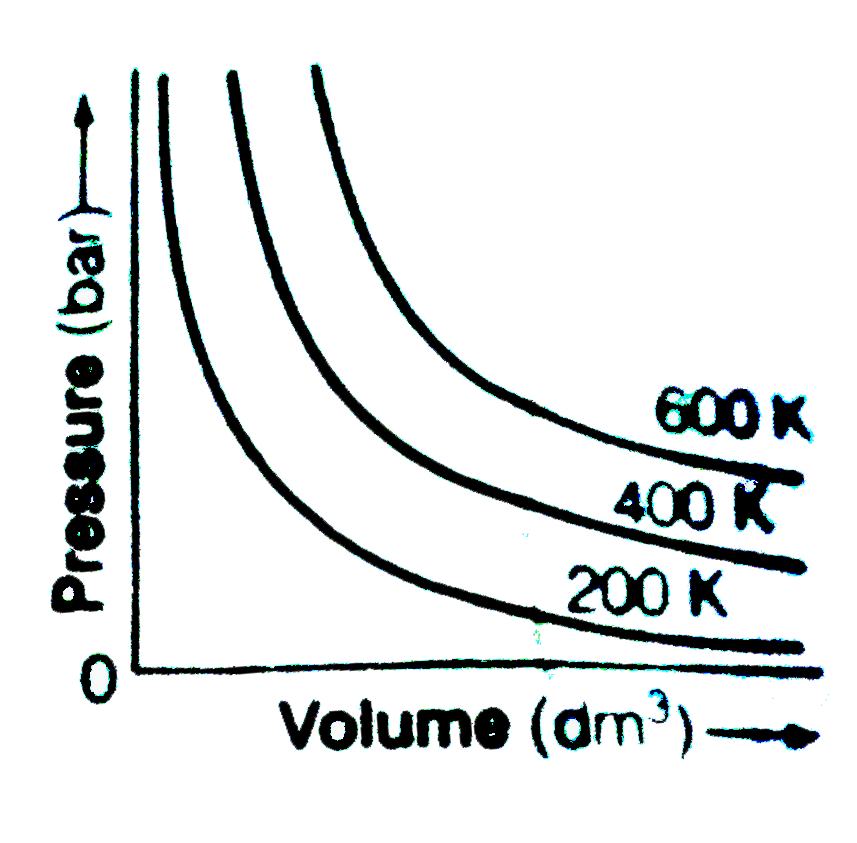
The variation of pressure with volume of the gas at different temperatures can be graphically represented as shown in figure. On the basis of this graph answer the following question.
(i) How will the volume of a gas change if its pressure is increased at constant temperature ?
(ii) At a constant pressure, how will the volume of a gas change if the temperature is increased from 200 K to 400 K ?
 View Solution
Knowledge Check
- Question 1 - Select One
When pressure is increased at constant temperature.
ARate of Haber's process decresesBsolublity of gas in a liquid incresesCsolubility of solid in a liquid incresesD2C(s)+CO2(g)⇔2CO(g), rations moves in the froward direction. - Question 2 - Select One
How is pressure related to volume at constant temperature?
AP∝VBP∝1VCP=VDNo relation - Question 3 - Select One
What is the effect on the pressure of a gas if its temperature is increased at constant volume ?
AThe pressure of the gas increases.BThe pressure of the gas decreases .CThe pressure of the gas remains same .DThe pressure of the gas remains same .
Name the gas law which relates volume and pressure of gas at constant temperature.
View SolutionPressure vs volume graph at constant temperature is known as…………….
View SolutionAssertion: The plot of volume (V) versus pressure (P) at constant temperature is a hyperbola in the first quadrant.
Reason: V∝1/P at constant temperature.View SolutionJustify the statement 'volume of a gas at a constant pressure decreases if its temperature is decreased.'
View SolutionThe pressure of a gas is increased by 50% at constant temperature. The decrease in volume will be nearest to
View Solution
