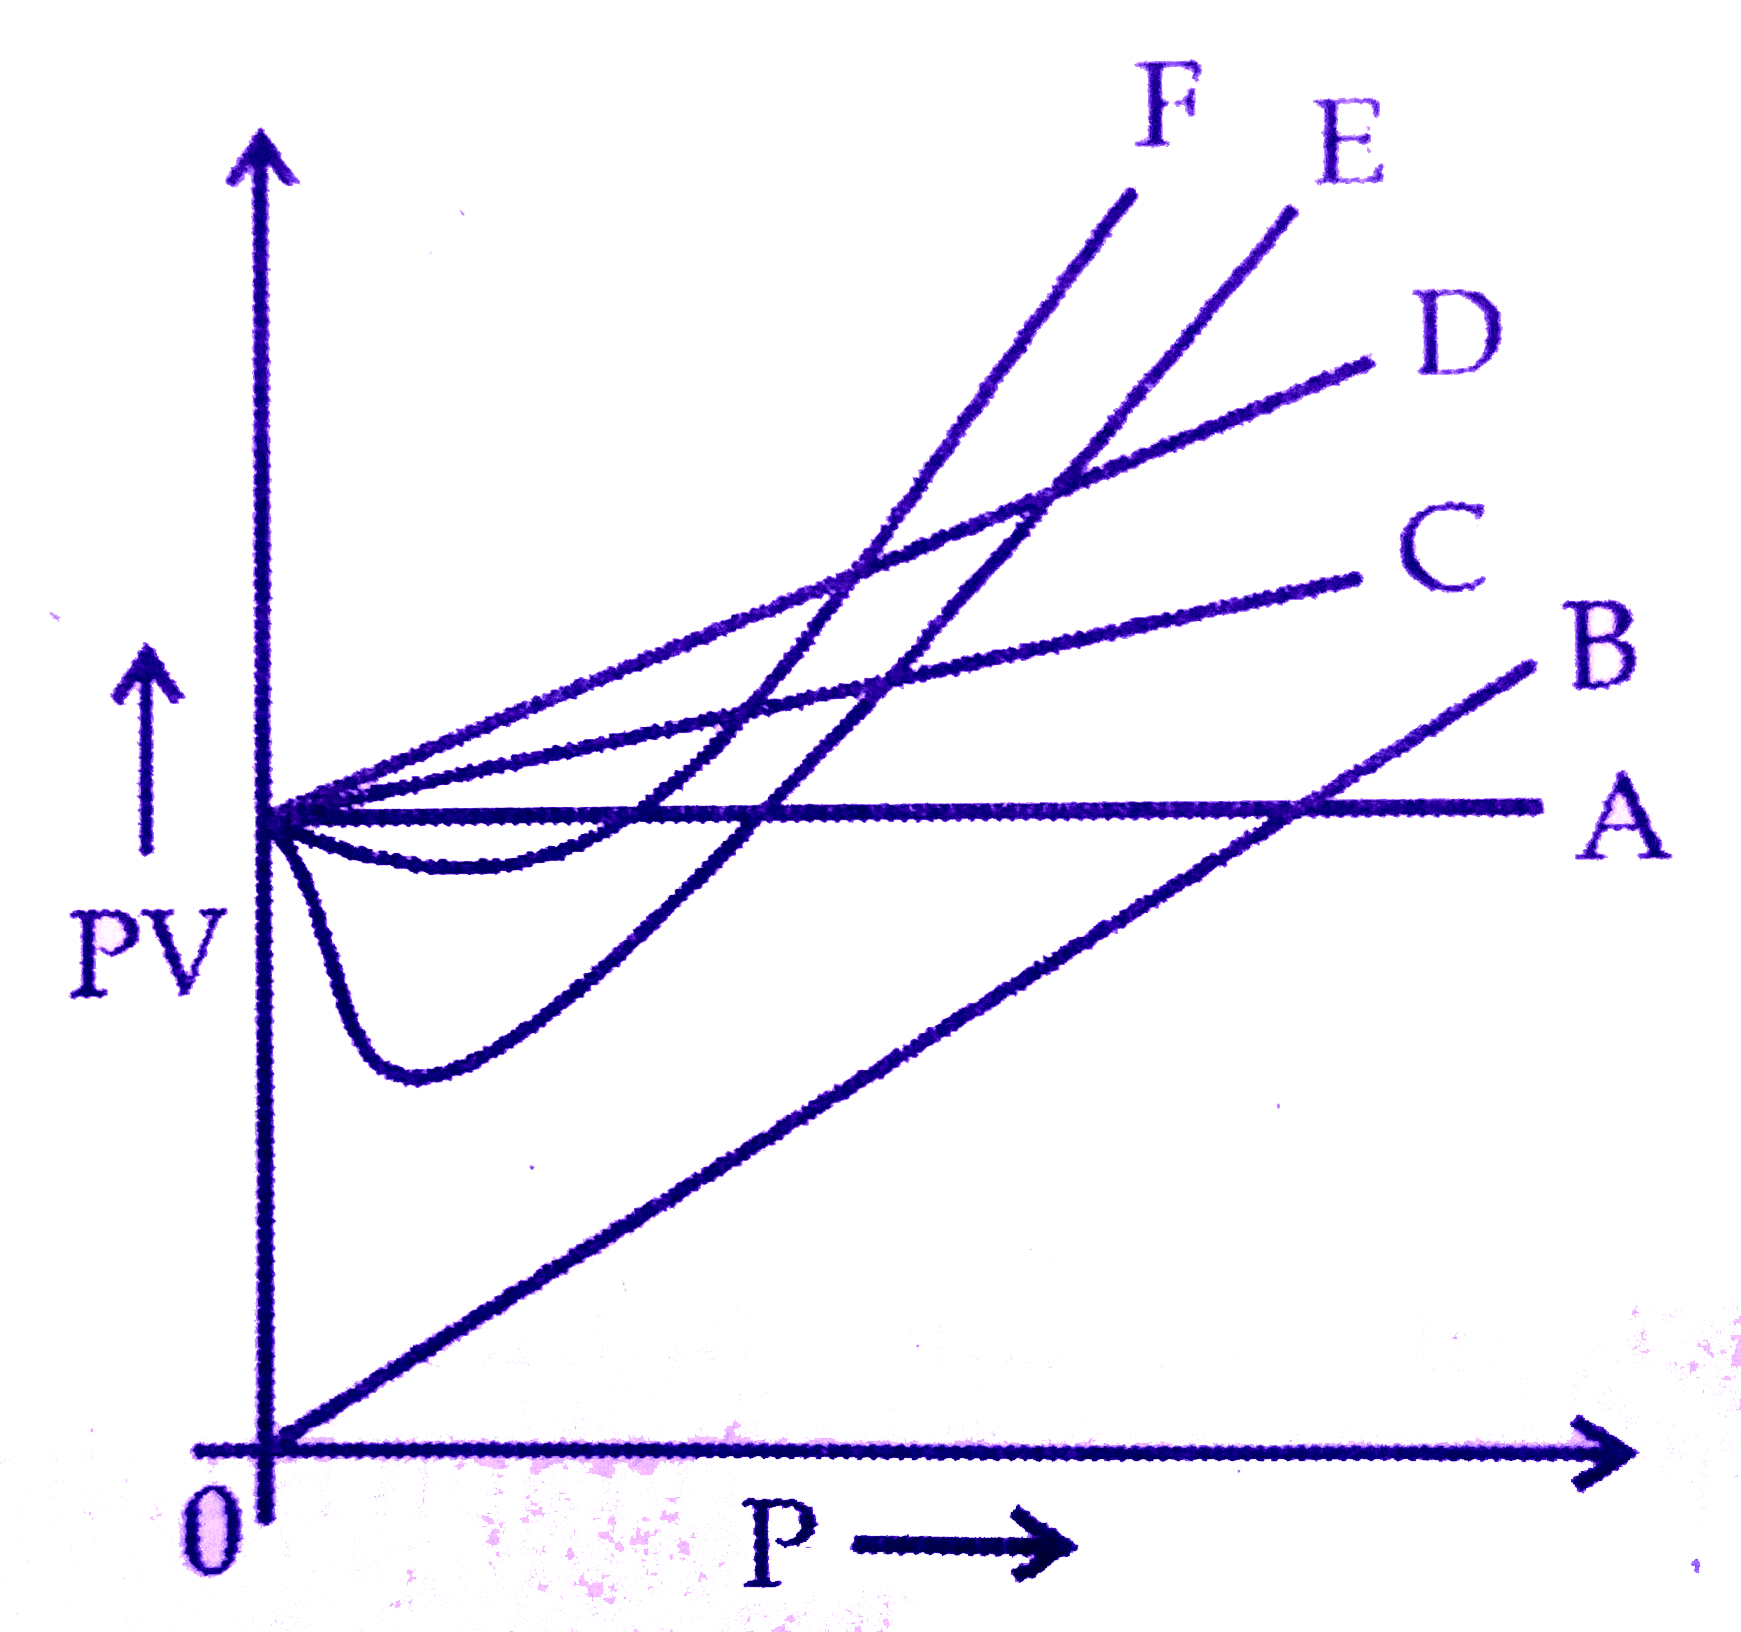
Which curve (in figure ) represents the curve of ideal gas ?
B only
C and D
E and F
A and B
The correct Answer is:A
For ideal gas PV= constant at all pressure
Topper's Solved these Questions
- STATES OF MATTER : GASES AND LIQUIDS BOOK - MARVEL PUBLICATIONCHAPTER - STATES OF MATTER : GASES AND LIQUIDS EXERCISE - TEST YOUR GRASP
50 Videos
- STATES OF MATTER : GASES AND LIQUIDS BOOK - MARVEL PUBLICATIONCHAPTER - STATES OF MATTER : GASES AND LIQUIDS EXERCISE - HIGHER LEVEL
35 Videos
- SOLID STATE BOOK - MARVEL PUBLICATIONCHAPTER - SOLID STATE EXERCISE - Multiple choice questions
183 Videos
- SURFACE CHEMISTRYBOOK - MARVEL PUBLICATIONCHAPTER - SURFACE CHEMISTRYEXERCISE - TEST YOUR GRASP
35 Videos
Similar Questions
Knowledge Check
Which curve in the following graph represents the curve of ideal gas ?
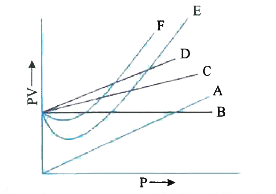 AB onlyBC and D onlyCE and F onlyDA and B only
Which curve does not represent Boyle's law ?
A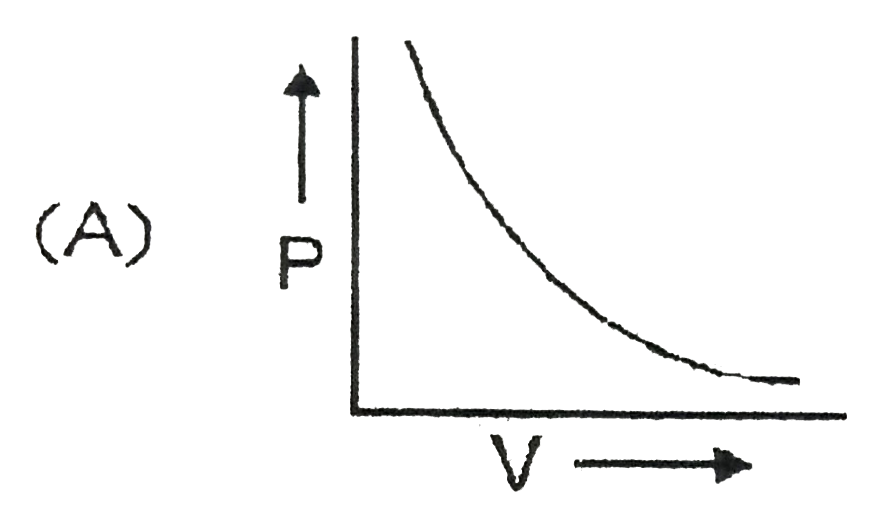 B
B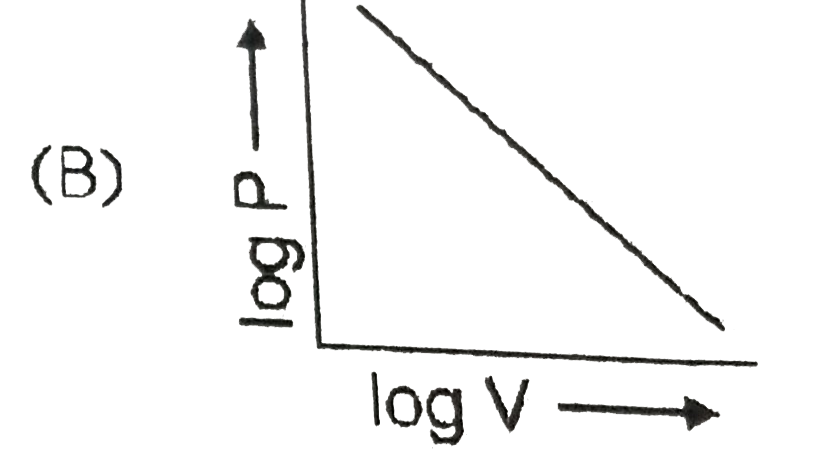 C
C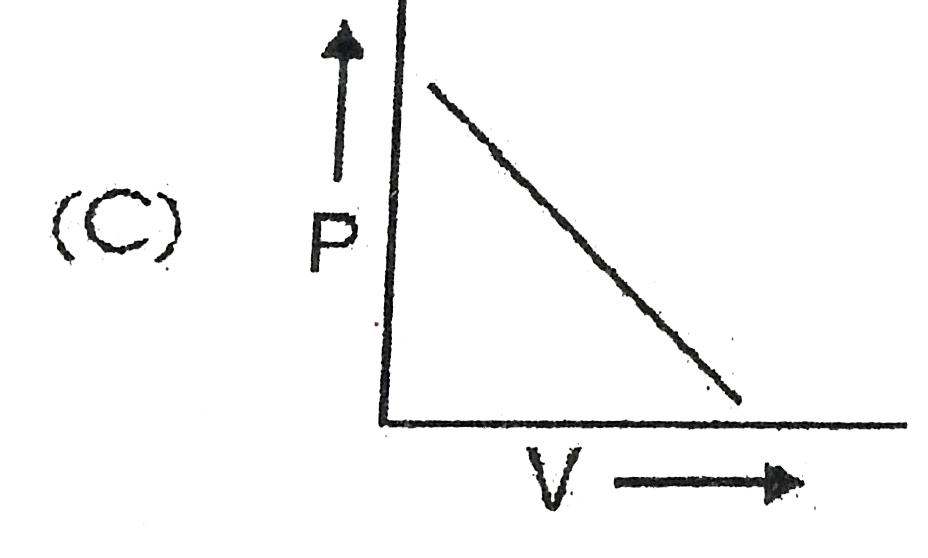 D
D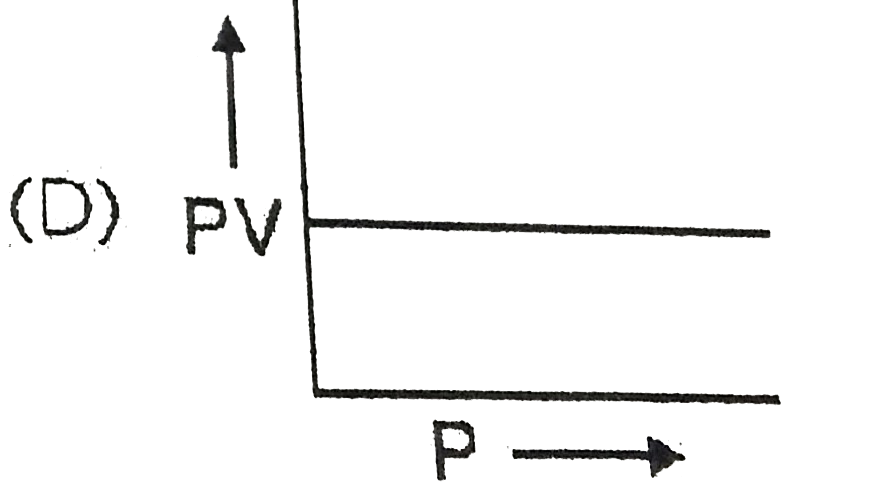
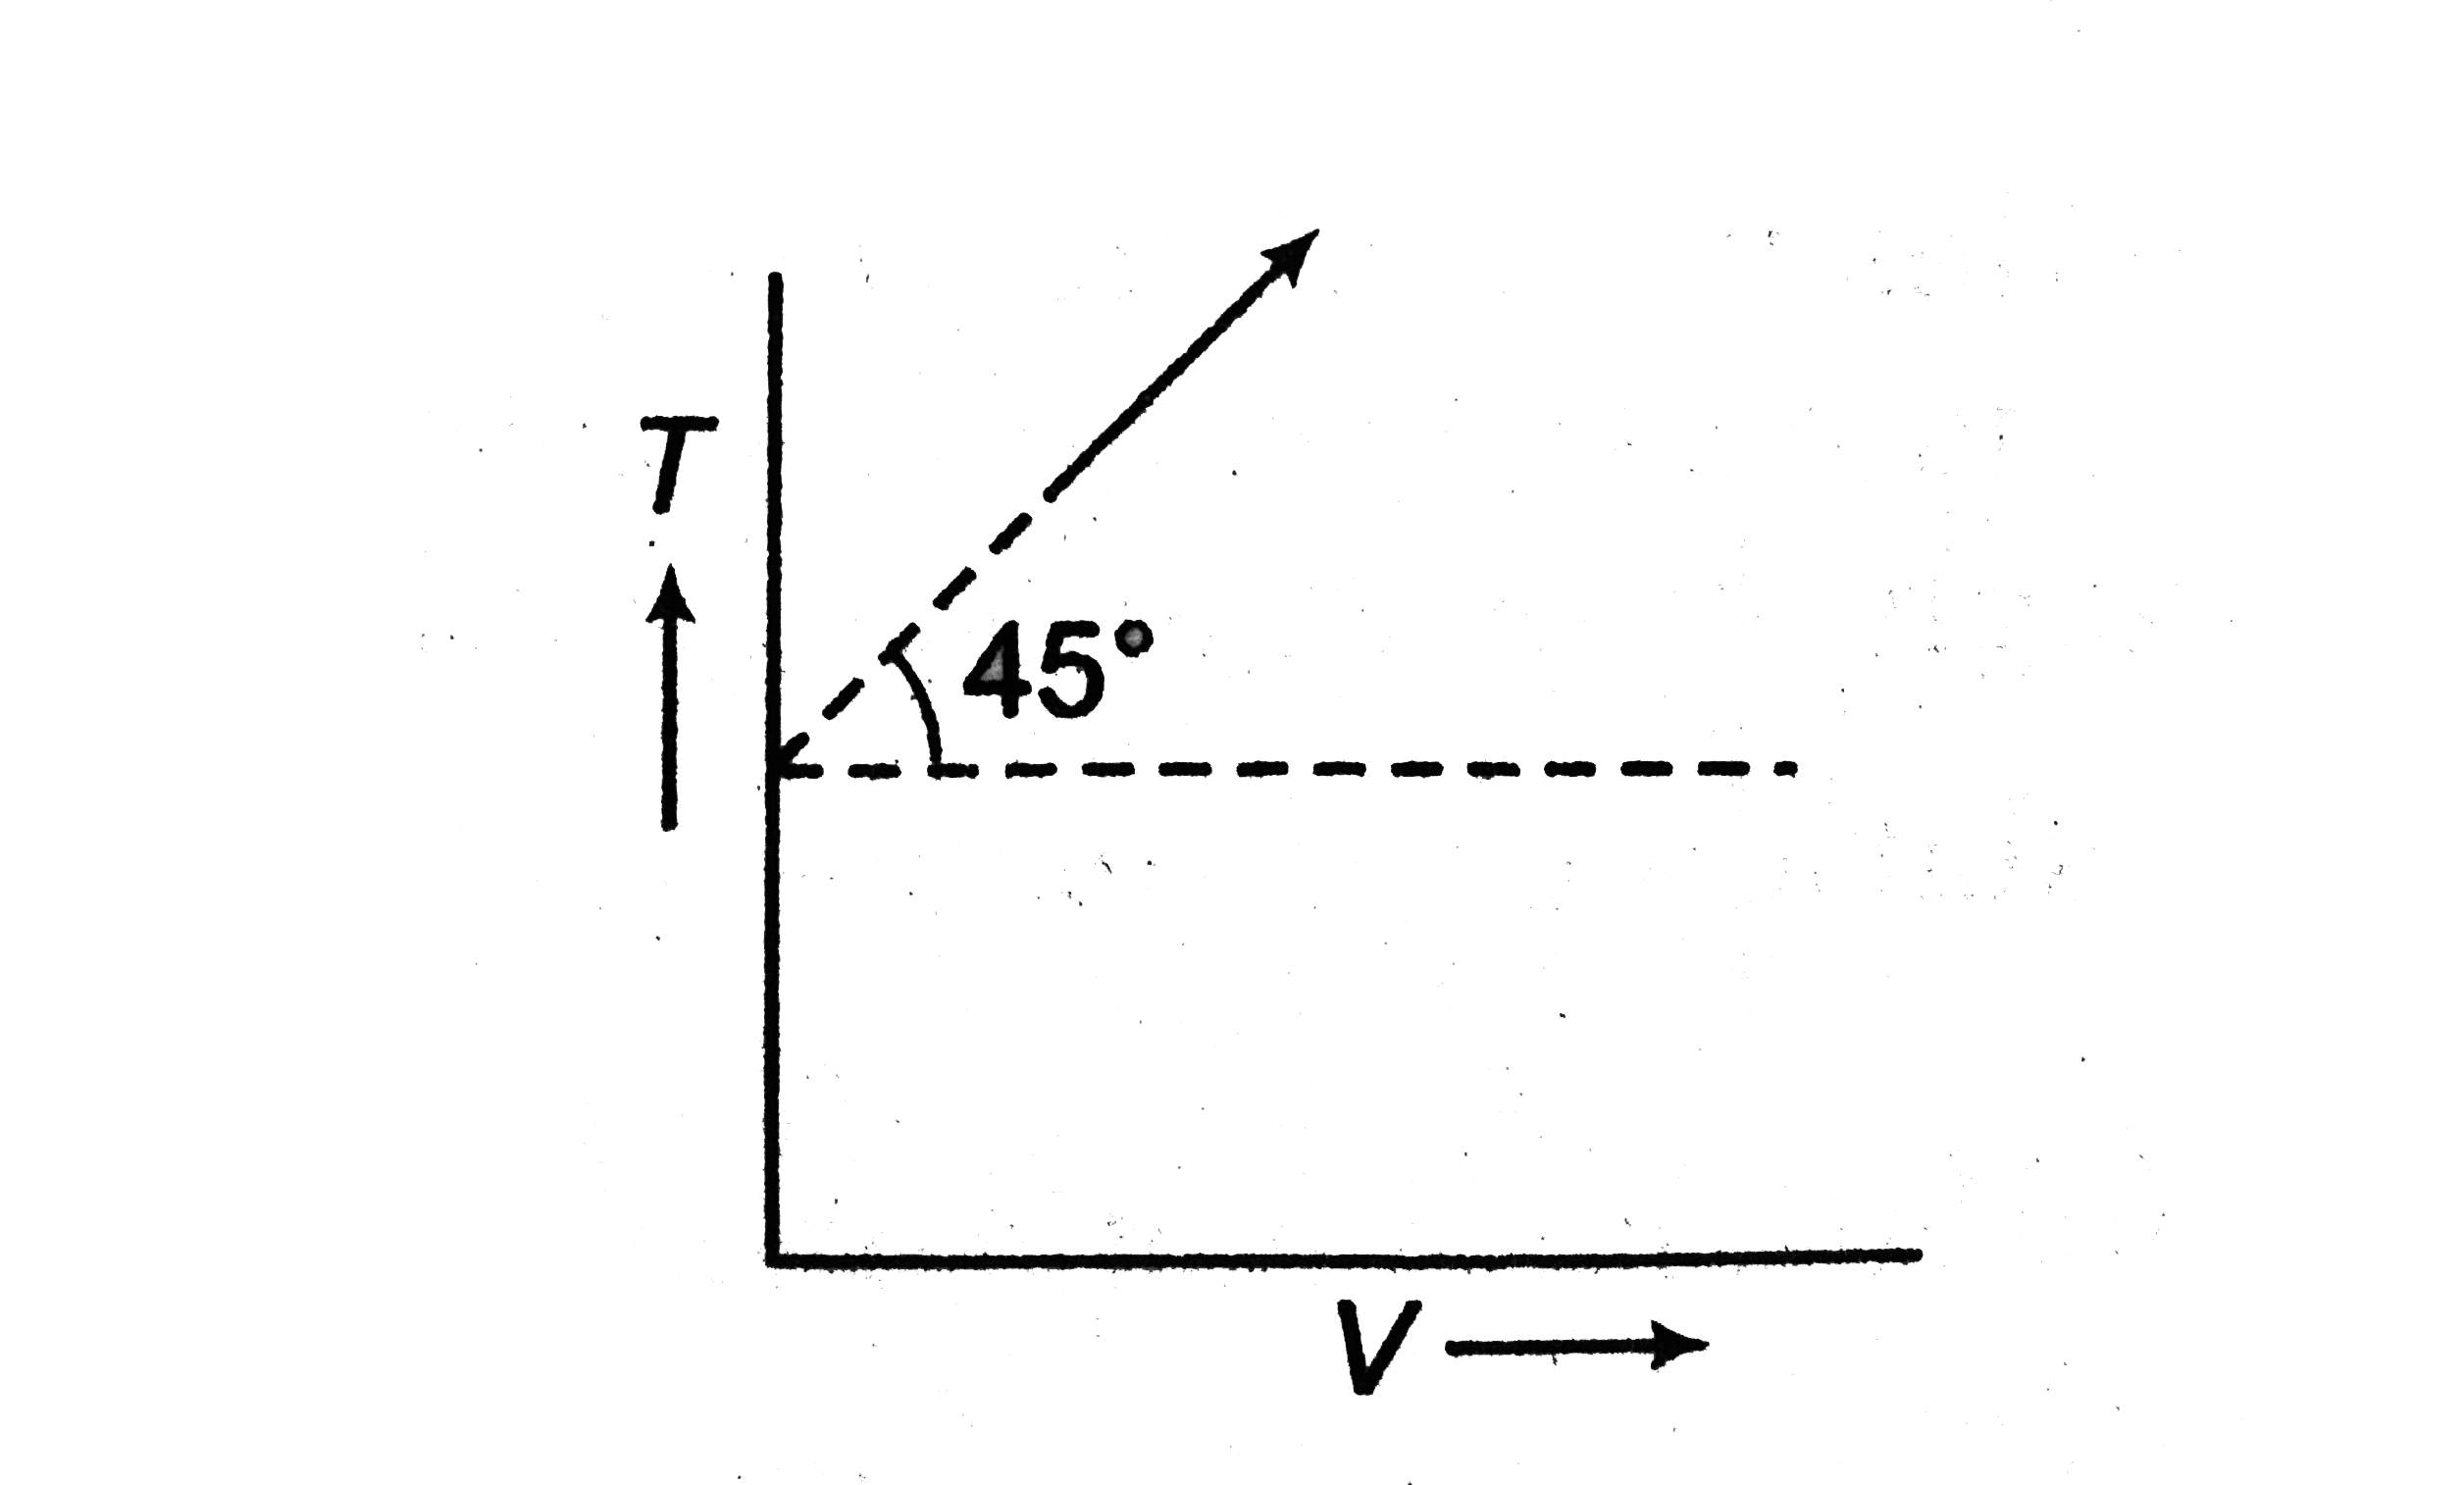
The given curve represents the variation of temperatue as a function of volume for one mole of an ideal gas. Which of the following curves best represents the variation of pressure as a function of volume ?
(##DCP_V03_C20_E01_099_Q01##).A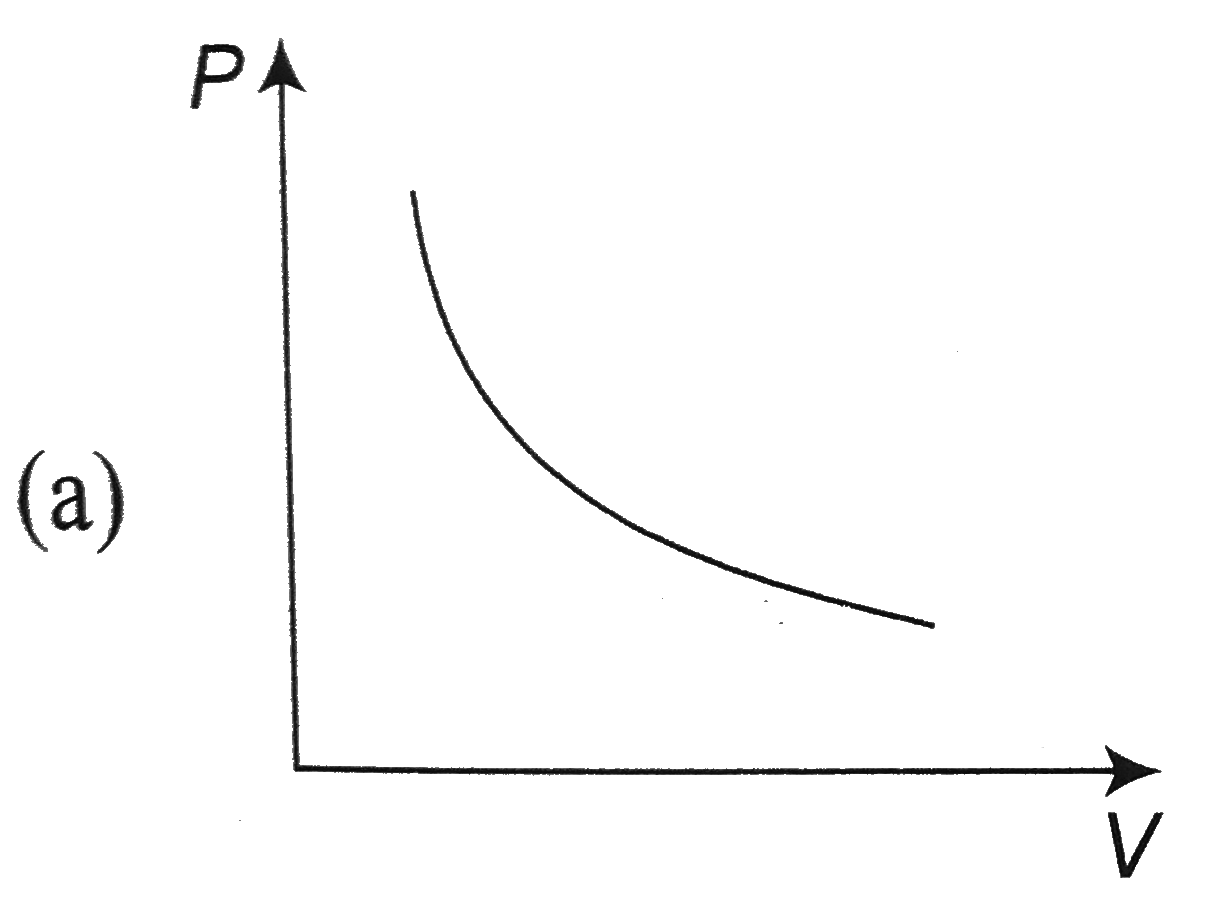 B
B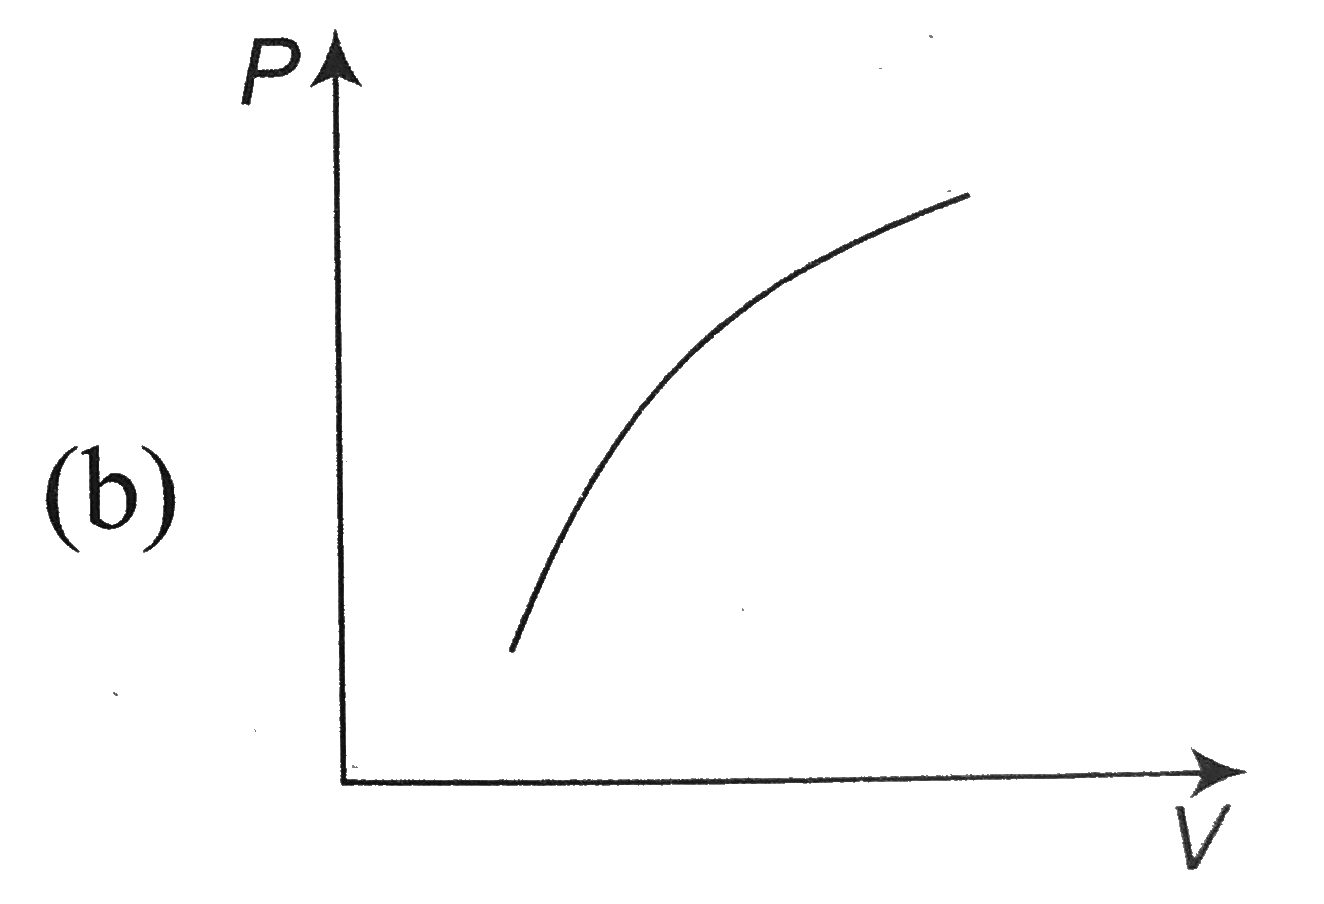 C
C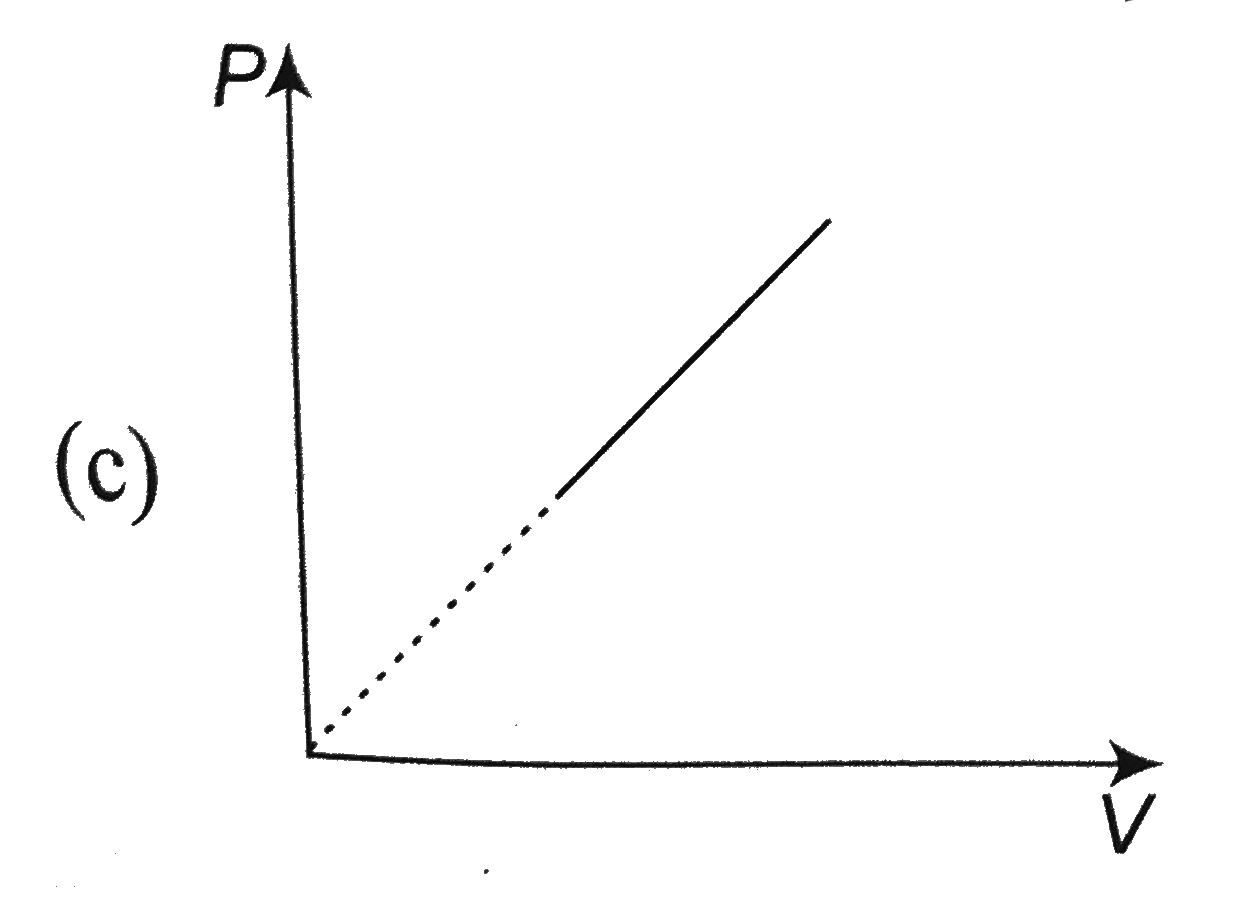 D
D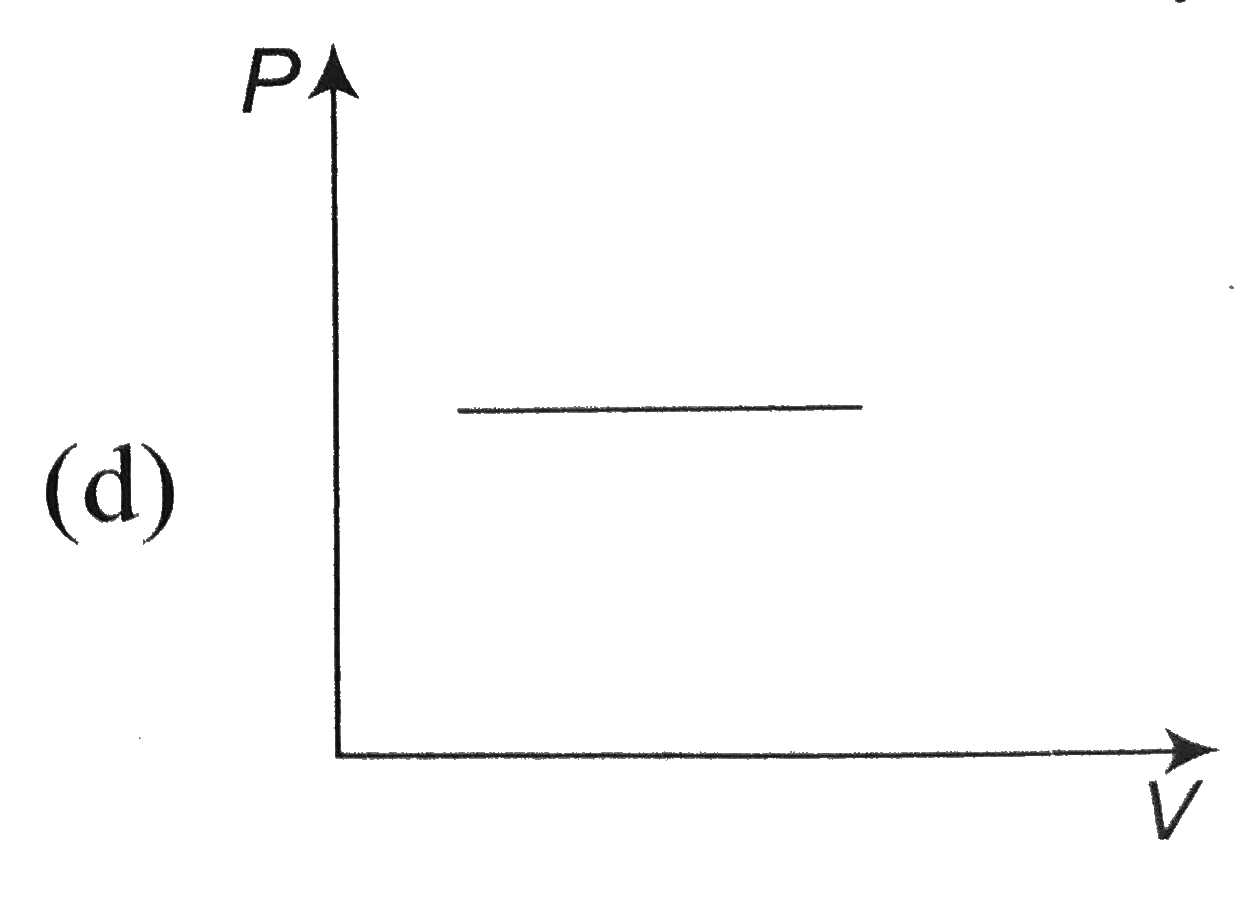
The given curve represents the variation of temperature as a function of volume for one mole of an ideal gas. Which of the following curves best represents the variation of pressure as a function of volume?
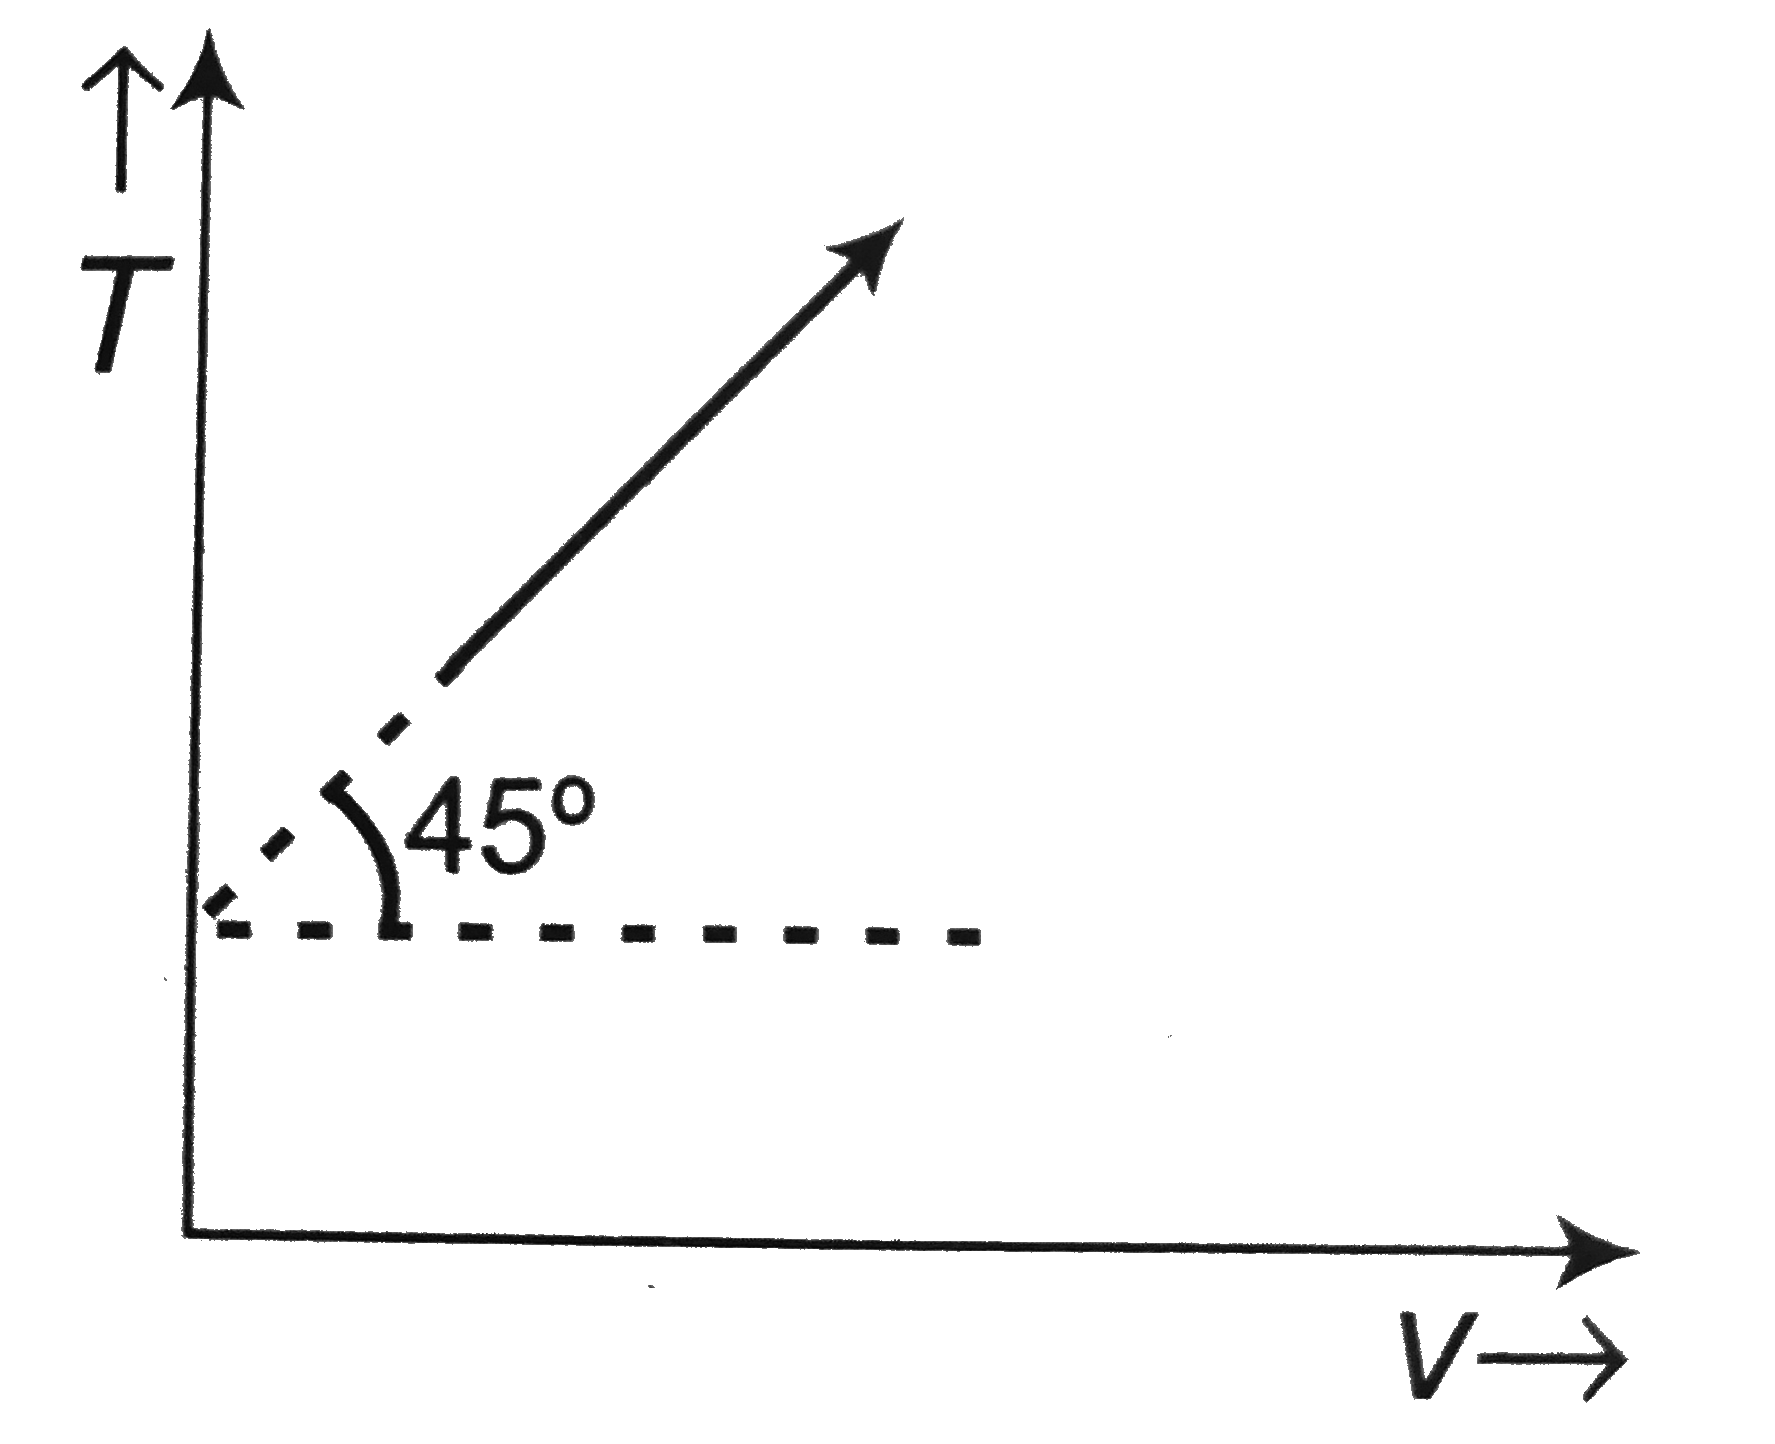
View SolutionThe given curve represents the variation of temperature as a function of volume for one mole of an ideal gas. Which of the following curves best represents the variation of pressure as a function of volume?

View SolutionThe given curve represents the variation of temperatue as a function of volume for one mole of an ideal gas. Which of the following curves best represents the variation of pressure as a function of volume ?
 .
.
View SolutionThe given curve represents the variation of temperatue as a function of volume for one mole of an ideal gas. Which of the following curves best represents the variation of pressure as a function of volume ?
 .
.
View SolutionWhich parts of the curve in the figure shown represent compression and rarefaction for a longitudianal wave?
View Solution

