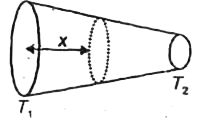
Two ends of a rod of non uniform area of cross section are maintained at temperature T1and T2 (T1>T2) as shown in the figure
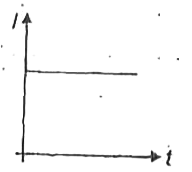
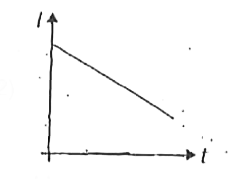
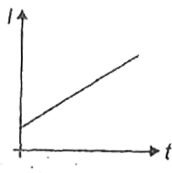
If l is heat current through the cross-section of conductor at distance x from its left face, then the variation of l with x is best represented by
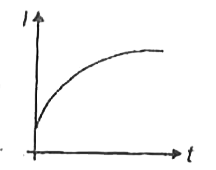
Step by step video & image solution for Two ends of a rod of non uniform area of cross section are maintained at temperature T_(1)and T_(2) (T_(1)>T_(2)) as shown in the figure If l is heat current through the cross-section of conductor at distance x from its left face, then the variation of l with x is best represented by by Physics experts to help you in doubts & scoring excellent marks in Class 12 exams.
Updated on:21/07/2023Similar Questions
If charge through a cross-section of a conductor at timetis q=2t2+3t+1. Find the current at t = 2s.
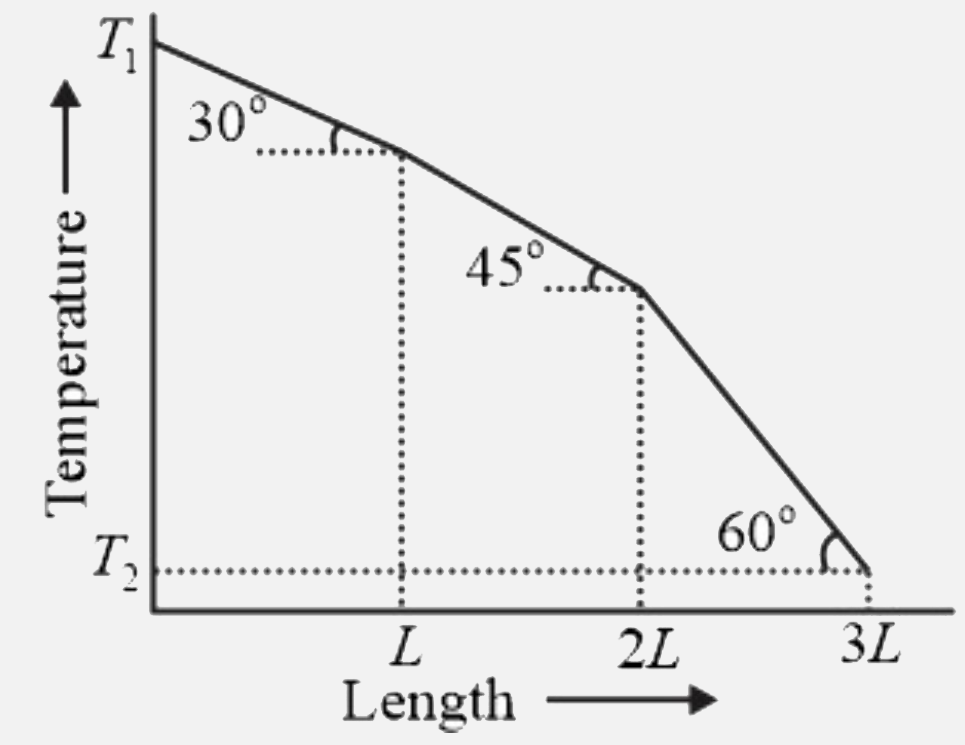
View SolutionThree rods of the same length and the same area of the cross-section are joined. The temperature of two ends one T1 and T2 as shown in the figure.
 As we move along the rod the variation of temperature are as shown in the following [Rods are insulated from the surrounding except at the faces]
View Solution
Knowledge Check
The two ends of a rod of length L and a uniform cross-sectional area A are kept at two temperature T1 and T2 (T1>T2). The rate of heat transfer. dQdt, through the rod in a steady state is given by
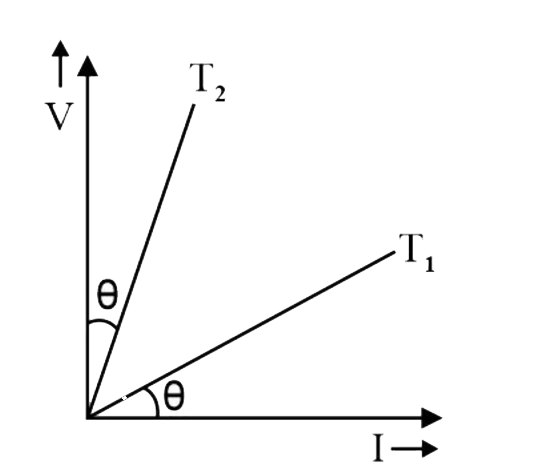
AdQdt=KL(T1−T2)ABdQdt=KL(T1−T2)LACdQdt=KLA(T1−T2)DdQdt=KA(T1−T2)LThe V - i graph for a conductor at temperature T1 and T2 are as shown in the figure. (T2−T1) is proportional to
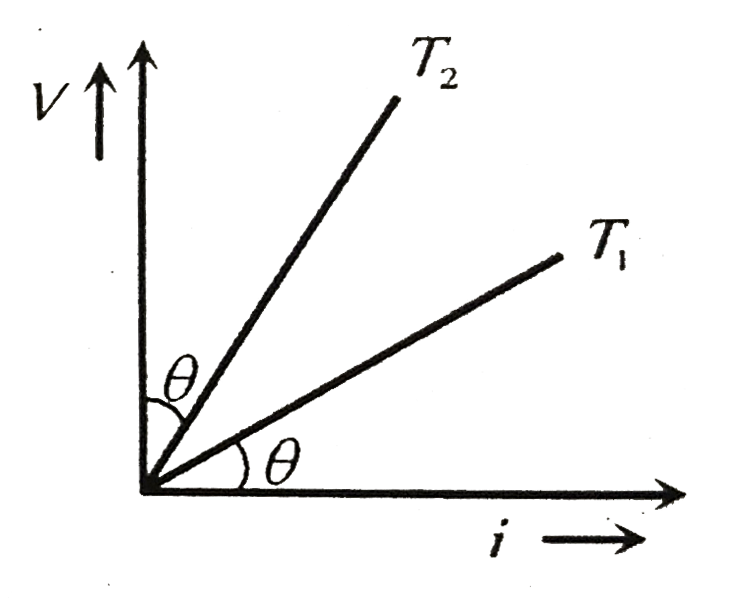 Acot2θBsinθCcot2θDtanθ
The V-l graph for a conductor at temperatures T1 and T2 are as shown in the figure. The term T2−T1 is proportional to
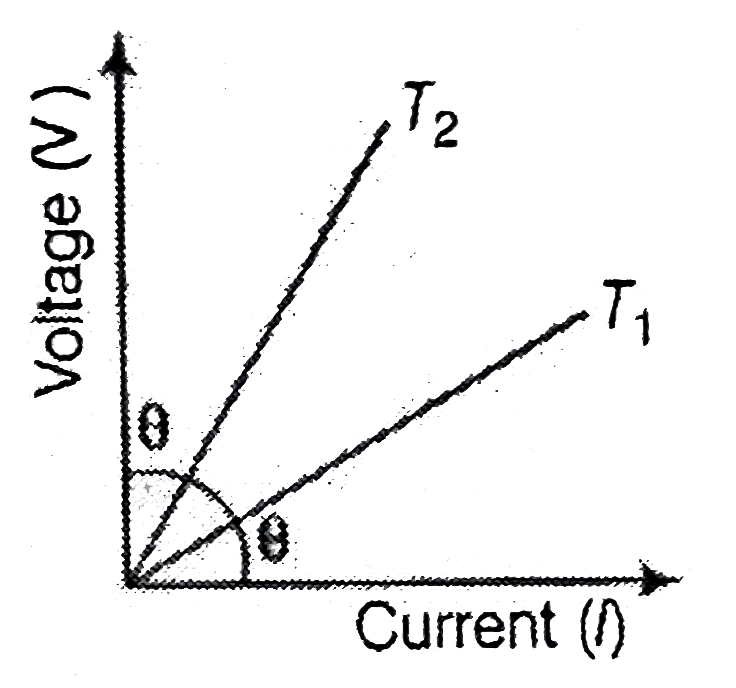 Acos2θBsin2θCcot2θDtan2θ
The V - I graphs for a conductor at temperature T1andT2 are shown in the figure (T2−T1) is proportional to
View Solution
Two ends of a rod of uniform cross sectional area are kept at temperature 3T0 and T0 as shown. Thermal conductivity of rod varies as k=αT, (where α is a constant and T is absolute temperature). In steady state, the temperature of the middle section of the rod is
View SolutionThe ends of a metal bar of constant cross-sectional area are maintained at temperatures T1andT2 which are both higher than the temperature of the surroundings. If the bar is unlagged, which one of the following sketches best represents the variation of temperature with distance along the bar ?
View SolutionCurved surface of a uniform rod is isolated from surrounding. Ends of the rod are maintained at temperatures T1 and T2(T1>T2) for a long time. At an instant, temperature T1 starts to decrease at a constant and slow rate. If thermal capacity of material of the rod is considered, then which of thefollowing statements is/are correct ?
View SolutionTwo rods A and B of same cross sectional are A and length l connected in series between a source
(T1=100∘C) and a sink (T2=0∘C) as shown in The rod is laterally insulated
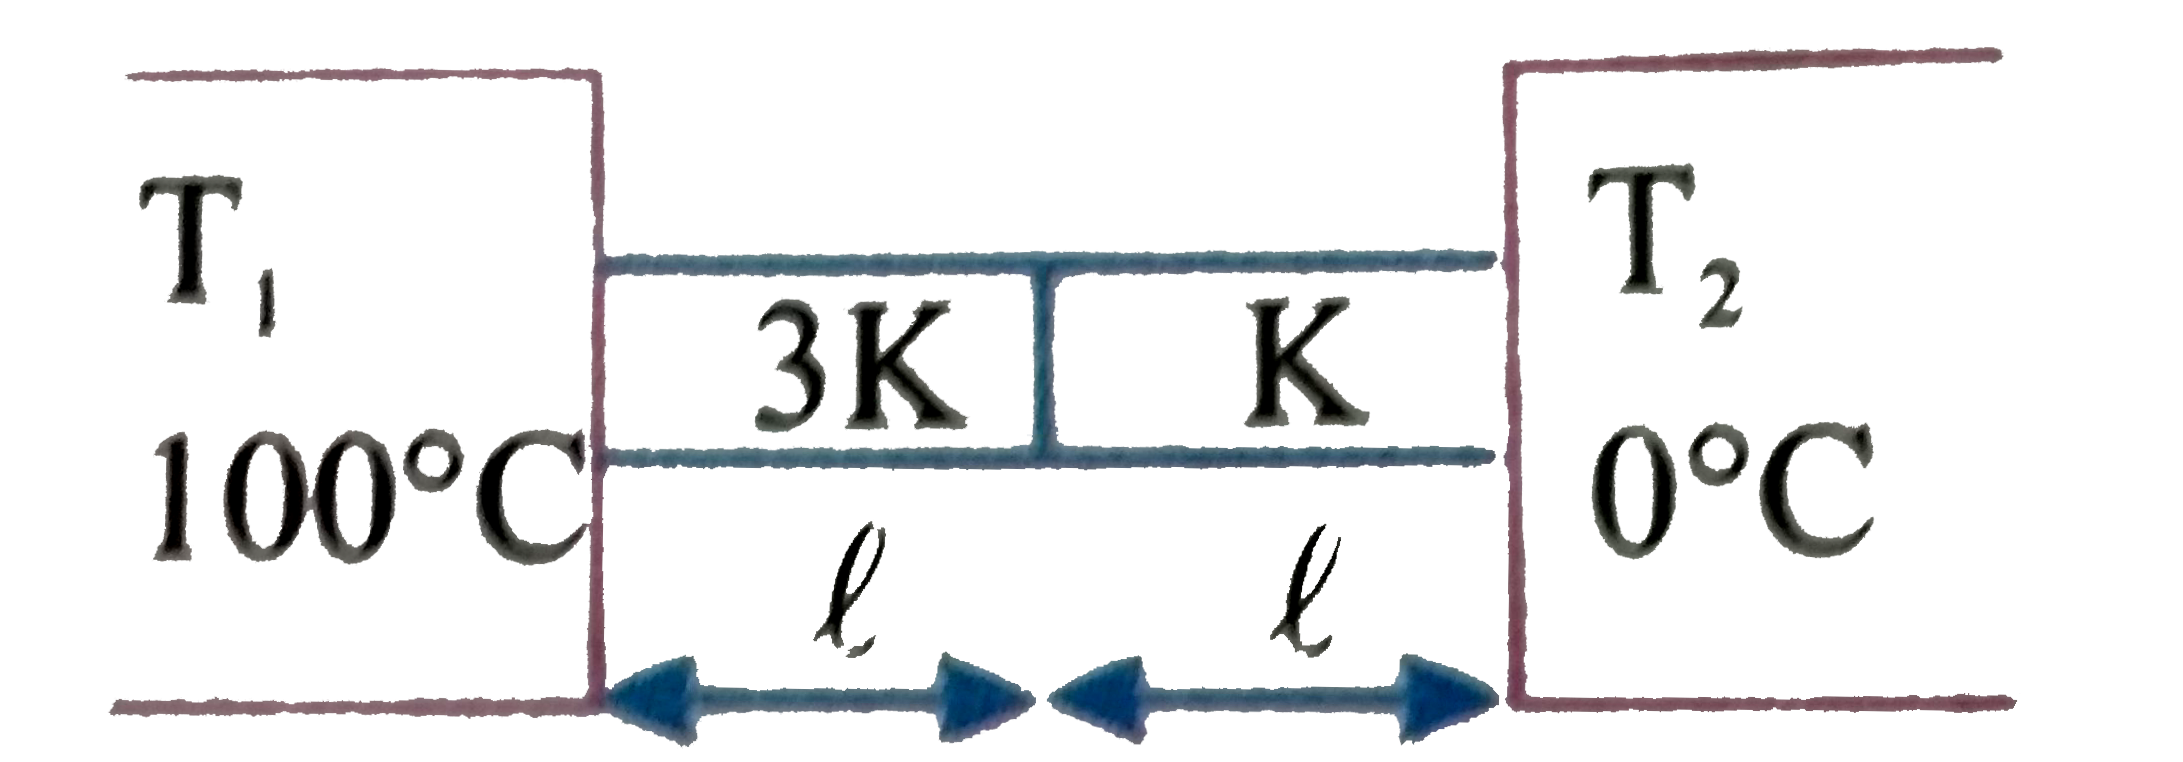
The ratio of thermal resistance of the rod is .
View Solution
