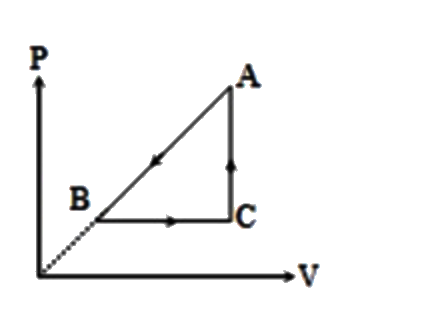
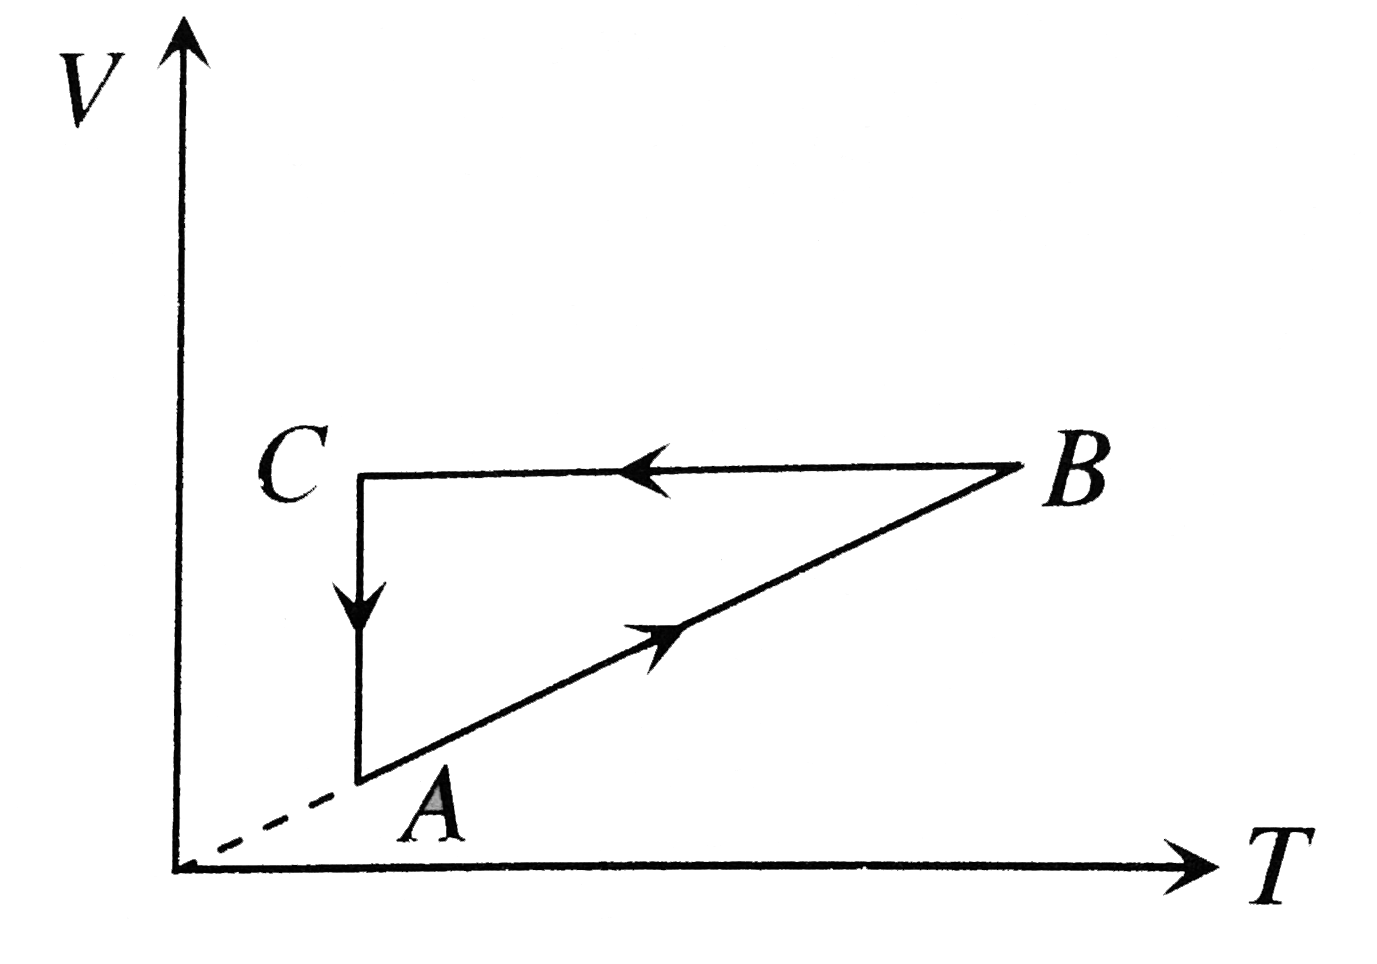
P−V diagram of a cyclic process ABCA is as shown in Fig. Choose the correct alternative
A
ΔQA→B is negative
B
ΔUB→C is positive
C
ΔUC→A is negative
D
ΔWCAB is negative
Video Solution
Text Solution
The correct Answer is:A, B, D
During process AandB , pressure and volume both are decreasing. Therefore, temperature and hence internal energy of the gas will decrease
(TαPV)orΔVA→B= negative. Further, ΔWA→B is negative.
In process B to C, pressure of the gas is constant while volume is increasing. Hence, temperature should increase or ΔUB→C positive. During C to A volume is constant while pressure is increasing.
Therefore, temperature and hence internal energy of the gas should increase off ΔUC→A positive. During process CAB , volume of the gas in decreasing. Hence, work done by the gas is negative.
|
Updated on:21/07/2023
Topper's Solved these Questions
Similar Questions
Knowledge Check
- Question 1 - Select One
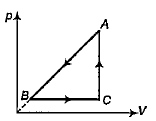
. p-V diagram of a cyclic process ABCA is as shown in figure. Choose the correct statement
 A△QA→B=constantB△UB→C=positiveC△UCAB=negativeDAll of the above
 - Question 2 - Select One
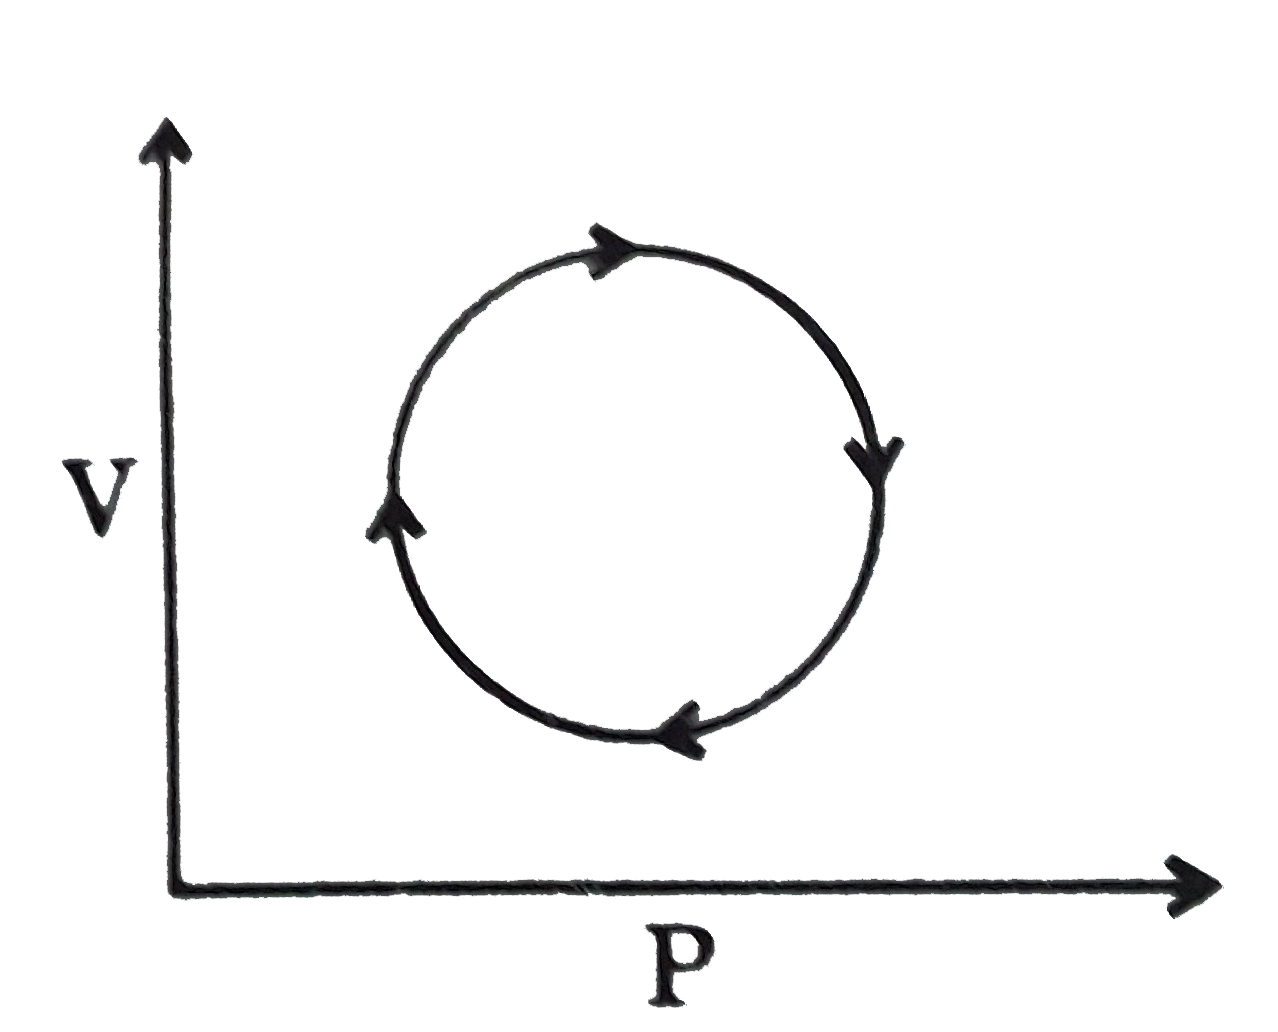
Which is correct for cyclic process as shown in figure ? Choose the correct statement.
 AWork is done by the systemBHeat is liberated by the systemCw=0DProcess is isoentropic as ΔS=0
 - Question 3 - Select One
The P−V diagram of a gas undergoing a cyclic process ABCDA is shown in (figure). Where P is in N/m2 and V is in cm3. Identify the incorrect statement
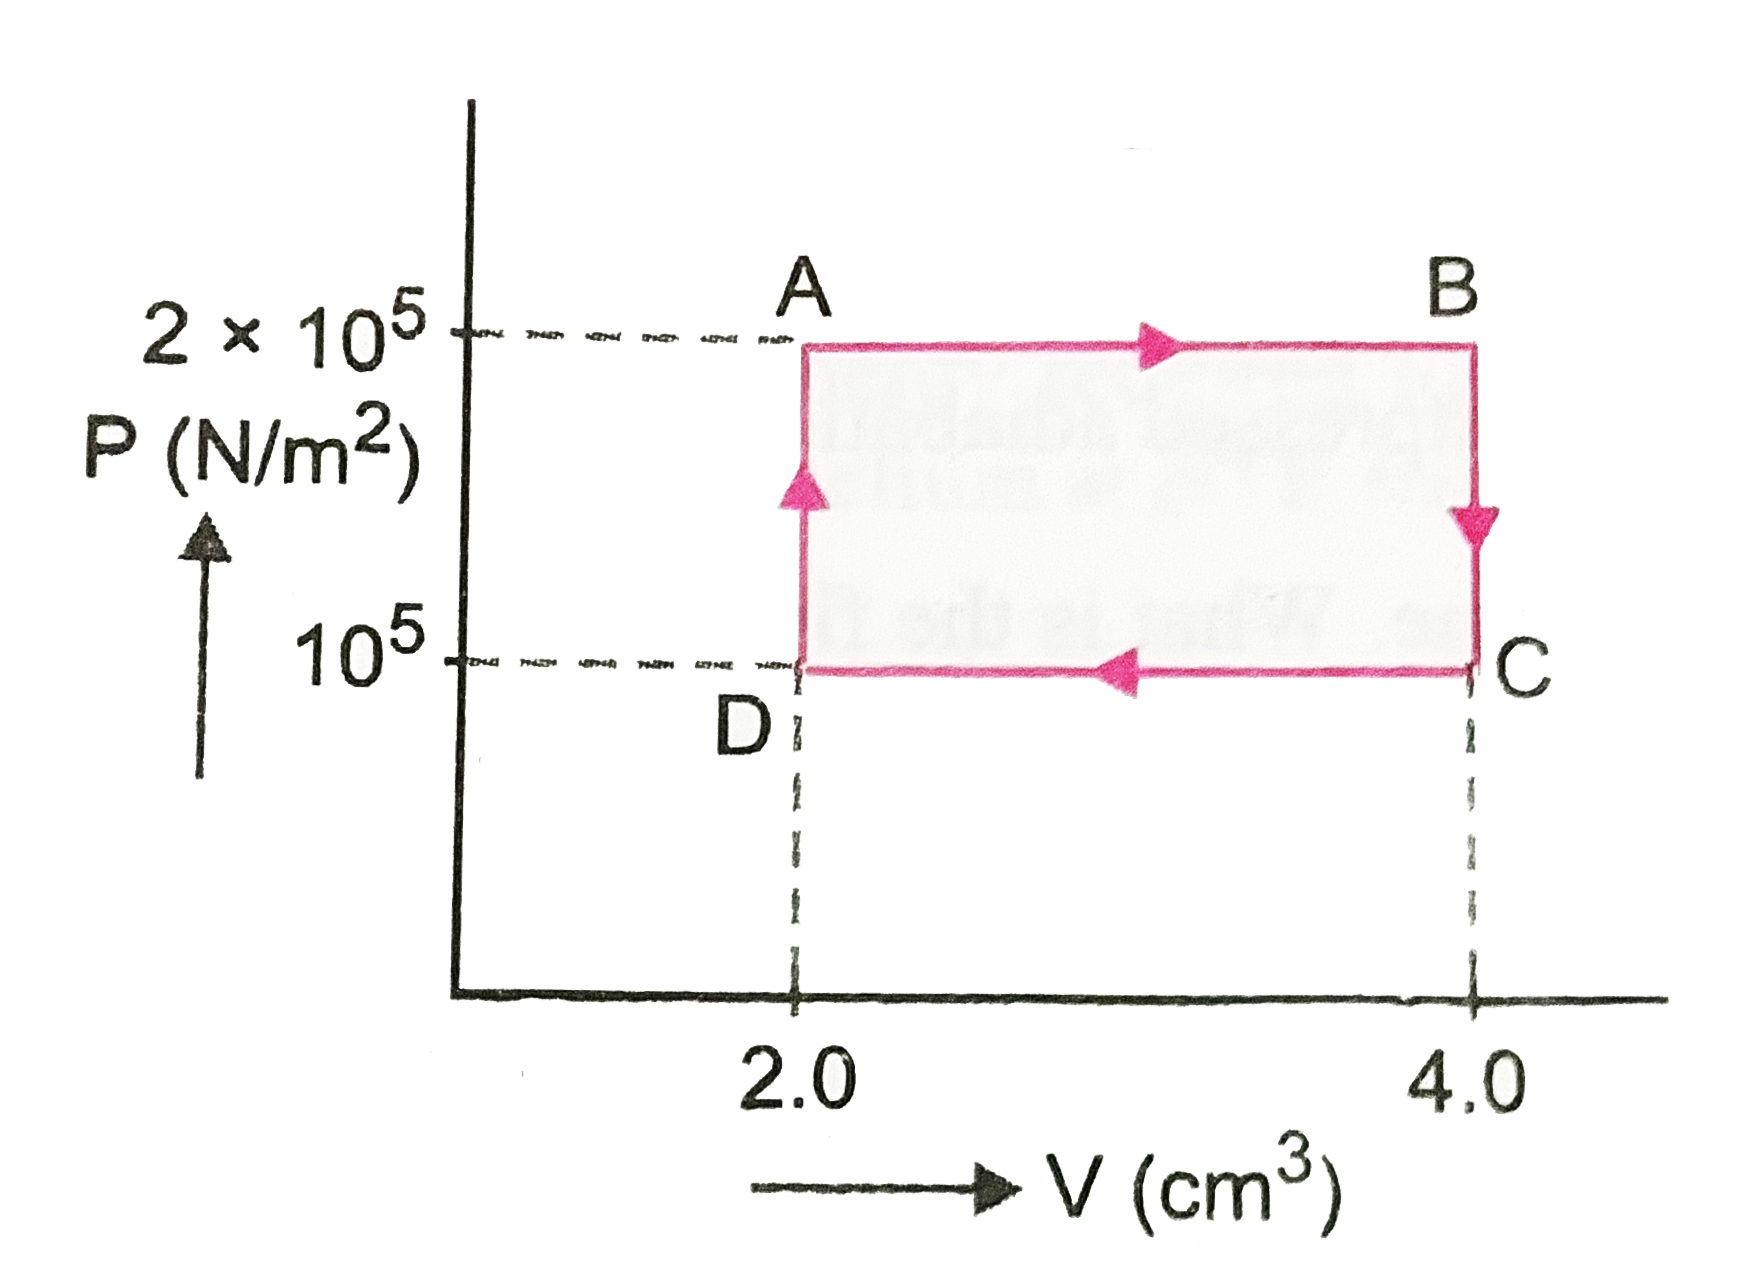 A0.4J of work is done by the gas from A to BB0.2J of work is done on the gas from C to DCNo work is done by the gas in going from B to CDWork done by the gas in going from B to C and on the gas from D to A
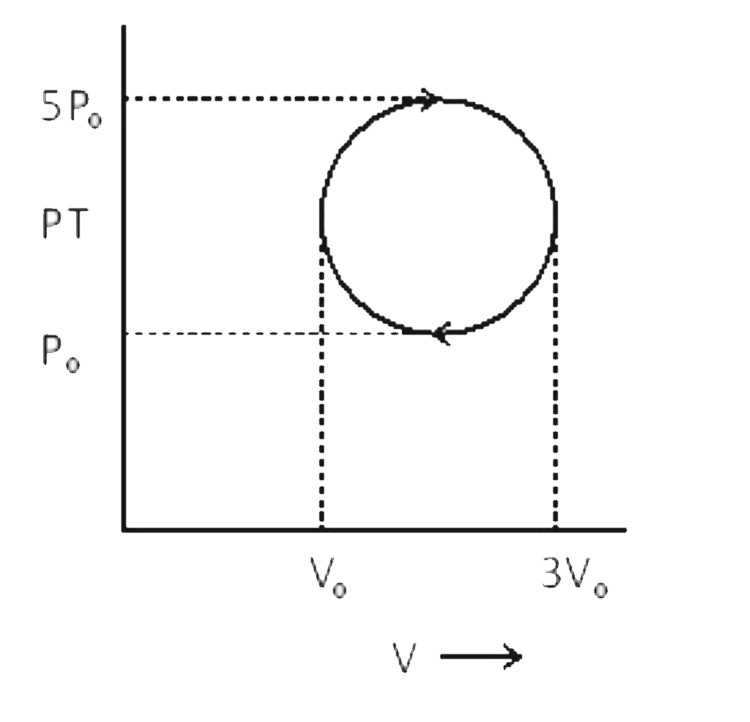
P – V graph for a cyclic process is shown in figure . Work done is given by
 View Solution
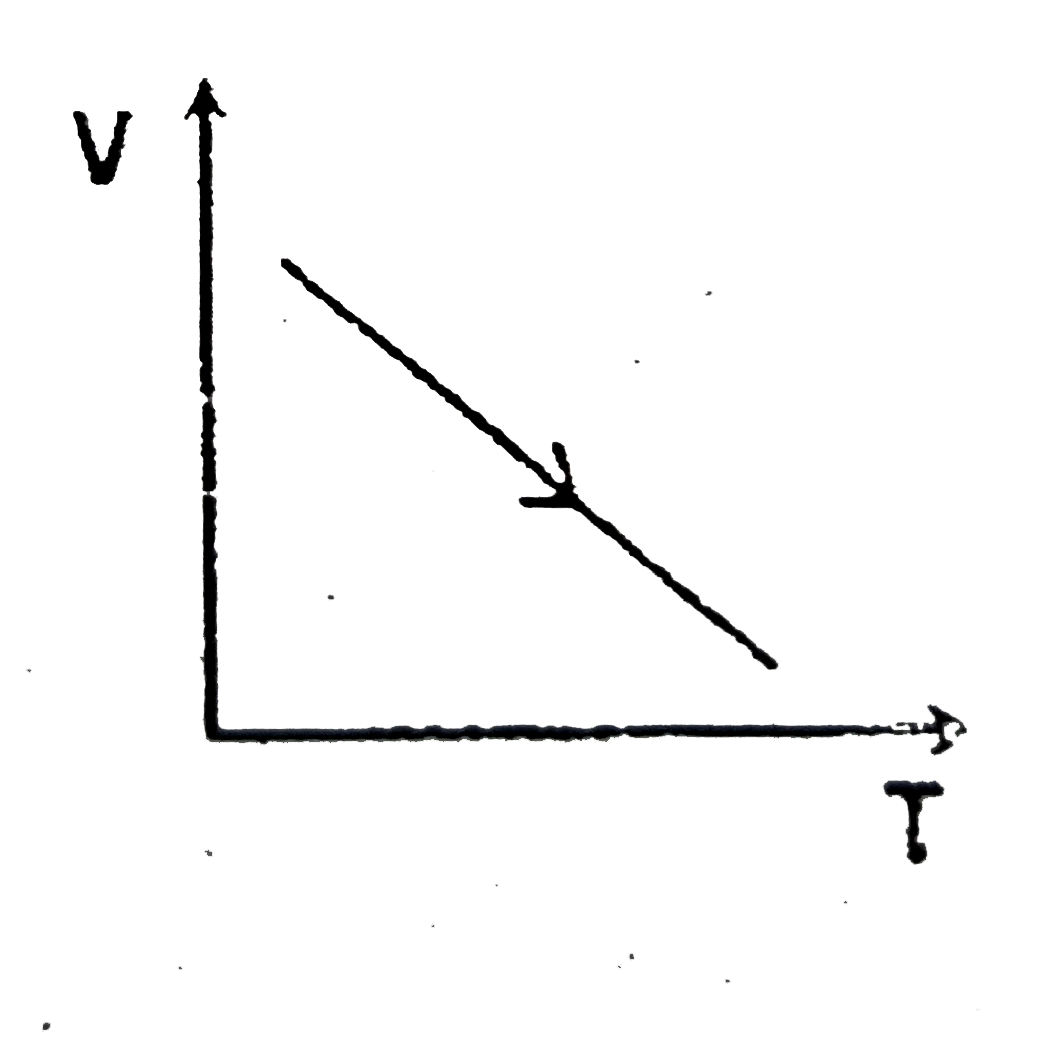
A gas perform a process as shown in V/T diagram. Choose the correct option(s).
 View Solution
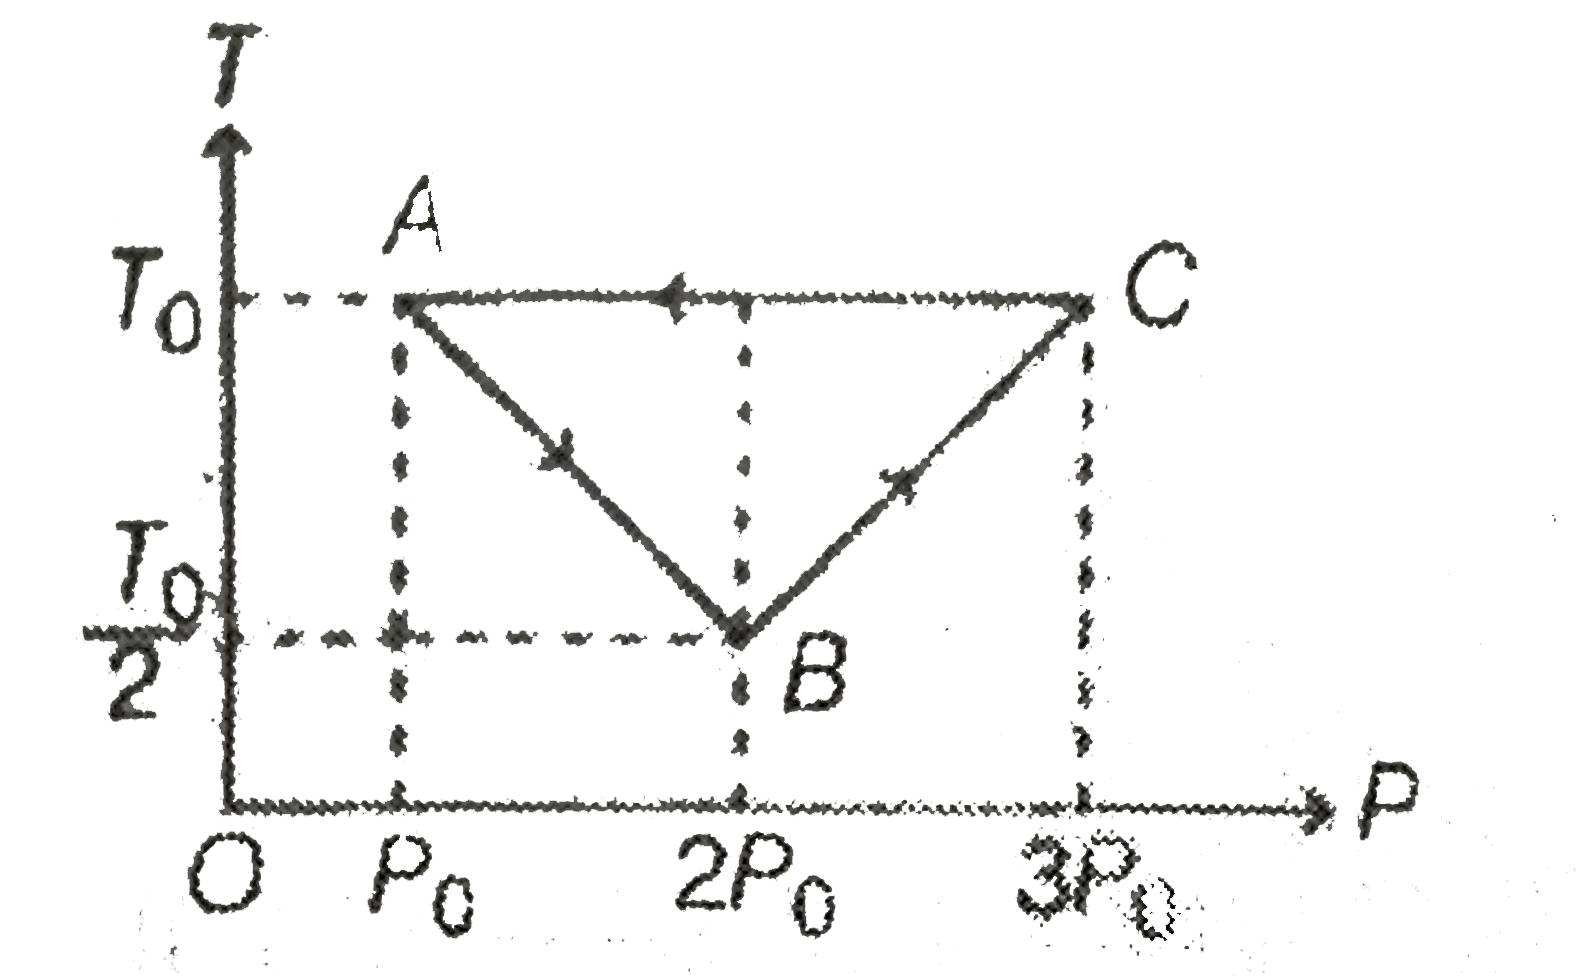
One mole of an ideal monoatomic gas is taken through a cyclic process as shown. Choose the correct option(s).
 View Solution
A cyclic process ABCA is shown in the V−T diagram process on the P−V
 View Solution
The P−V diagram of a gas undergoing a cyclic process ABCDA is shown in (figure). Where P is in N/m2 and V is in cm3. Identify the incorrect statement
 View Solution


