A gas perform a process as shown in V/T diagram. Choose the correct option(s).
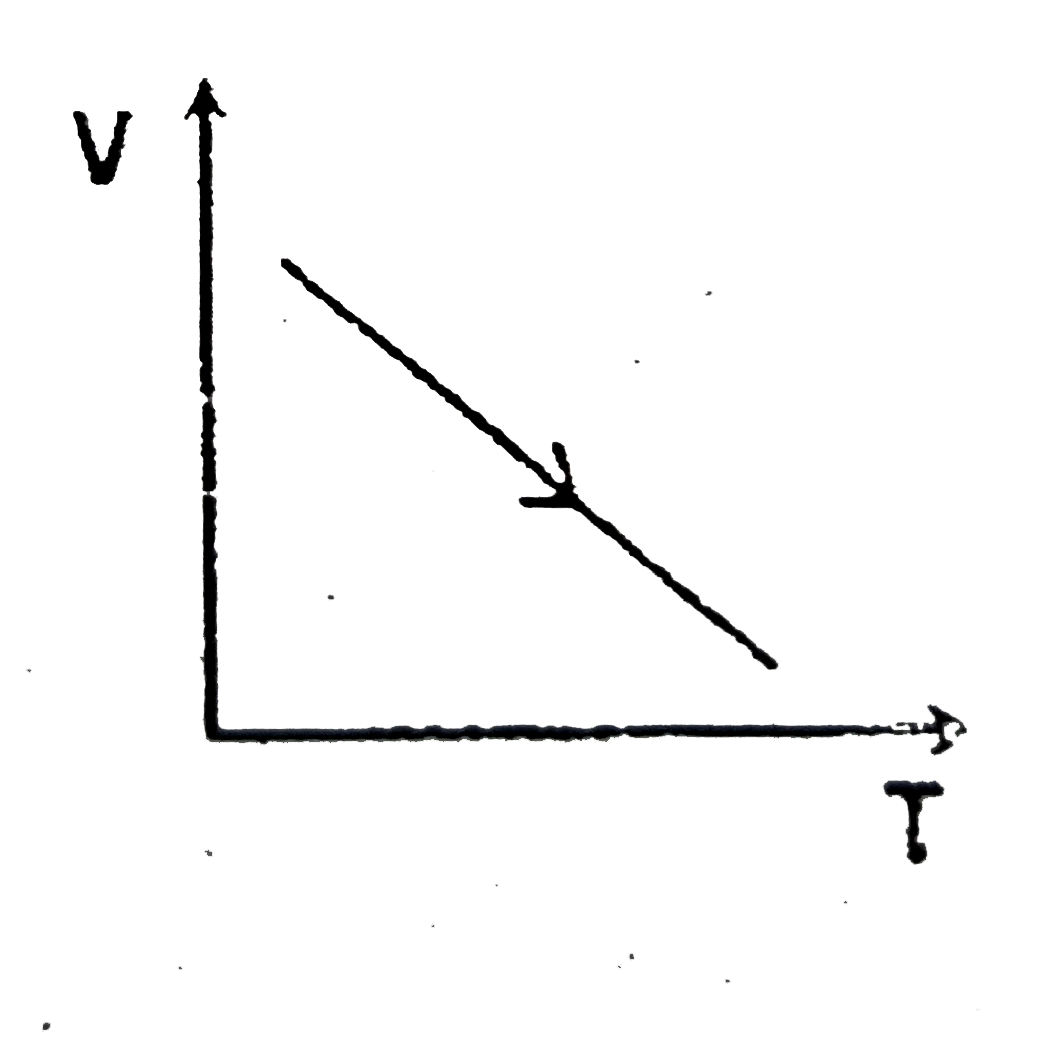
The process cannot be represented as PaVbTc=constant, where a, b,c are real numbers
specific heat capacity is dependent on temperature
Pressure of the gas monotonically decreases
pressure of the gas monotonically increases
Step by step video & image solution for A gas perform a process as shown in V//T diagram. Choose the correct option(s). by Physics experts to help you in doubts & scoring excellent marks in Class 12 exams.
Updated on:21/07/2023Topper's Solved these Questions
- GMP ASSESMENTBOOK - FIITJEECHAPTER - GMP ASSESMENTEXERCISE - Comprehension
58 Videos
- GMP ASSESMENTBOOK - FIITJEECHAPTER - GMP ASSESMENTEXERCISE - Numerical Based
61 Videos
- GMP ASSESMENTBOOK - FIITJEECHAPTER - GMP ASSESMENTEXERCISE - Assertion & Reason
15 Videos
- GENERAL PHYSICSBOOK - FIITJEECHAPTER - GENERAL PHYSICSEXERCISE - MATRIX MATCH TYPE
3 Videos
- GRAVITATIONBOOK - FIITJEECHAPTER - GRAVITATIONEXERCISE - Numerical based Question
2 Videos
Similar Questions
Knowledge Check
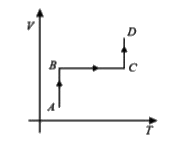
One mole of monoatomic gas undergoes a process as shown in the P-T diagram below. Choose the corresponding V – T diagram.
 A
A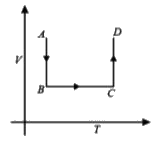 B
B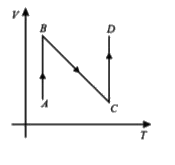 C
C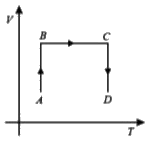 D
D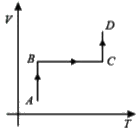
One mole of an ideal monoatomic gas is taken through a cyclic process as shown. Choose the correct option(s).
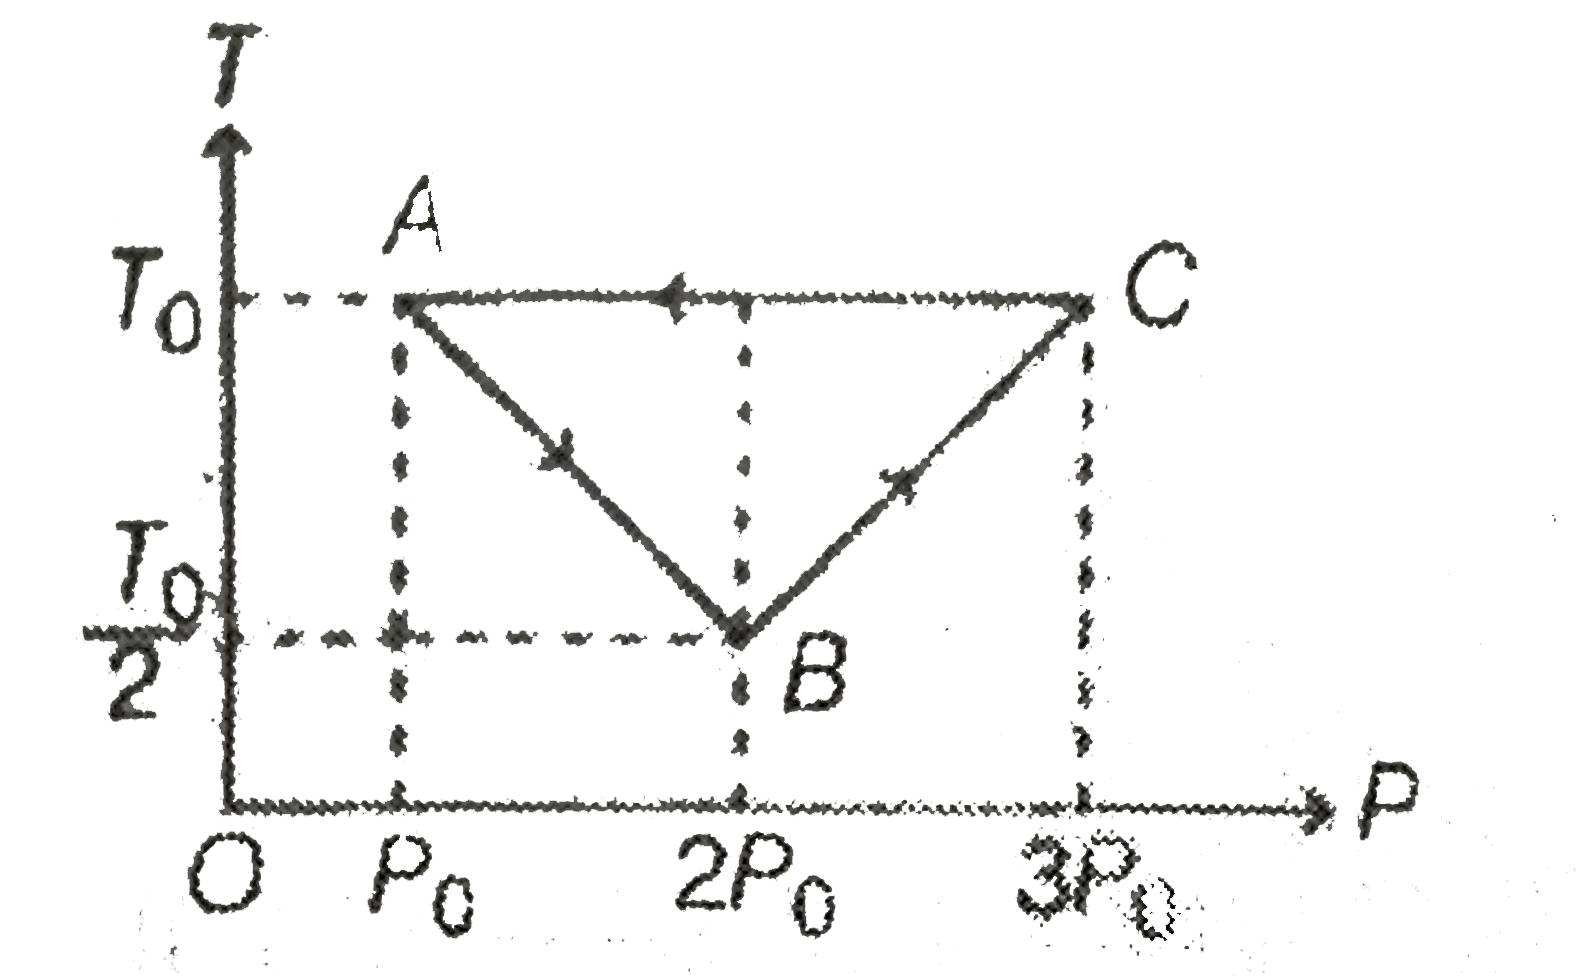 AWork done in process CA is RT0ln3.BHeat given to the gas in process CA is RT0ln3CThe magnitude of change in internal energy in process AB and BC must be sameDThe change in internal energy in process AB is negative.
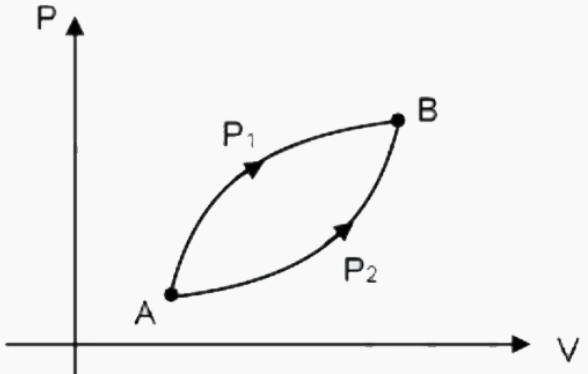
A thermodynamic system undergoes two process P1 and P2 from A→B as shown in P−V diagram, choose the correct option.A△UP1=△UP2,QP1=QP2B△Upq=△p2,QP1>Qp2C△Up1△Up2,QP1<Qp2D△Up1<△Up2,QP1=Qp2
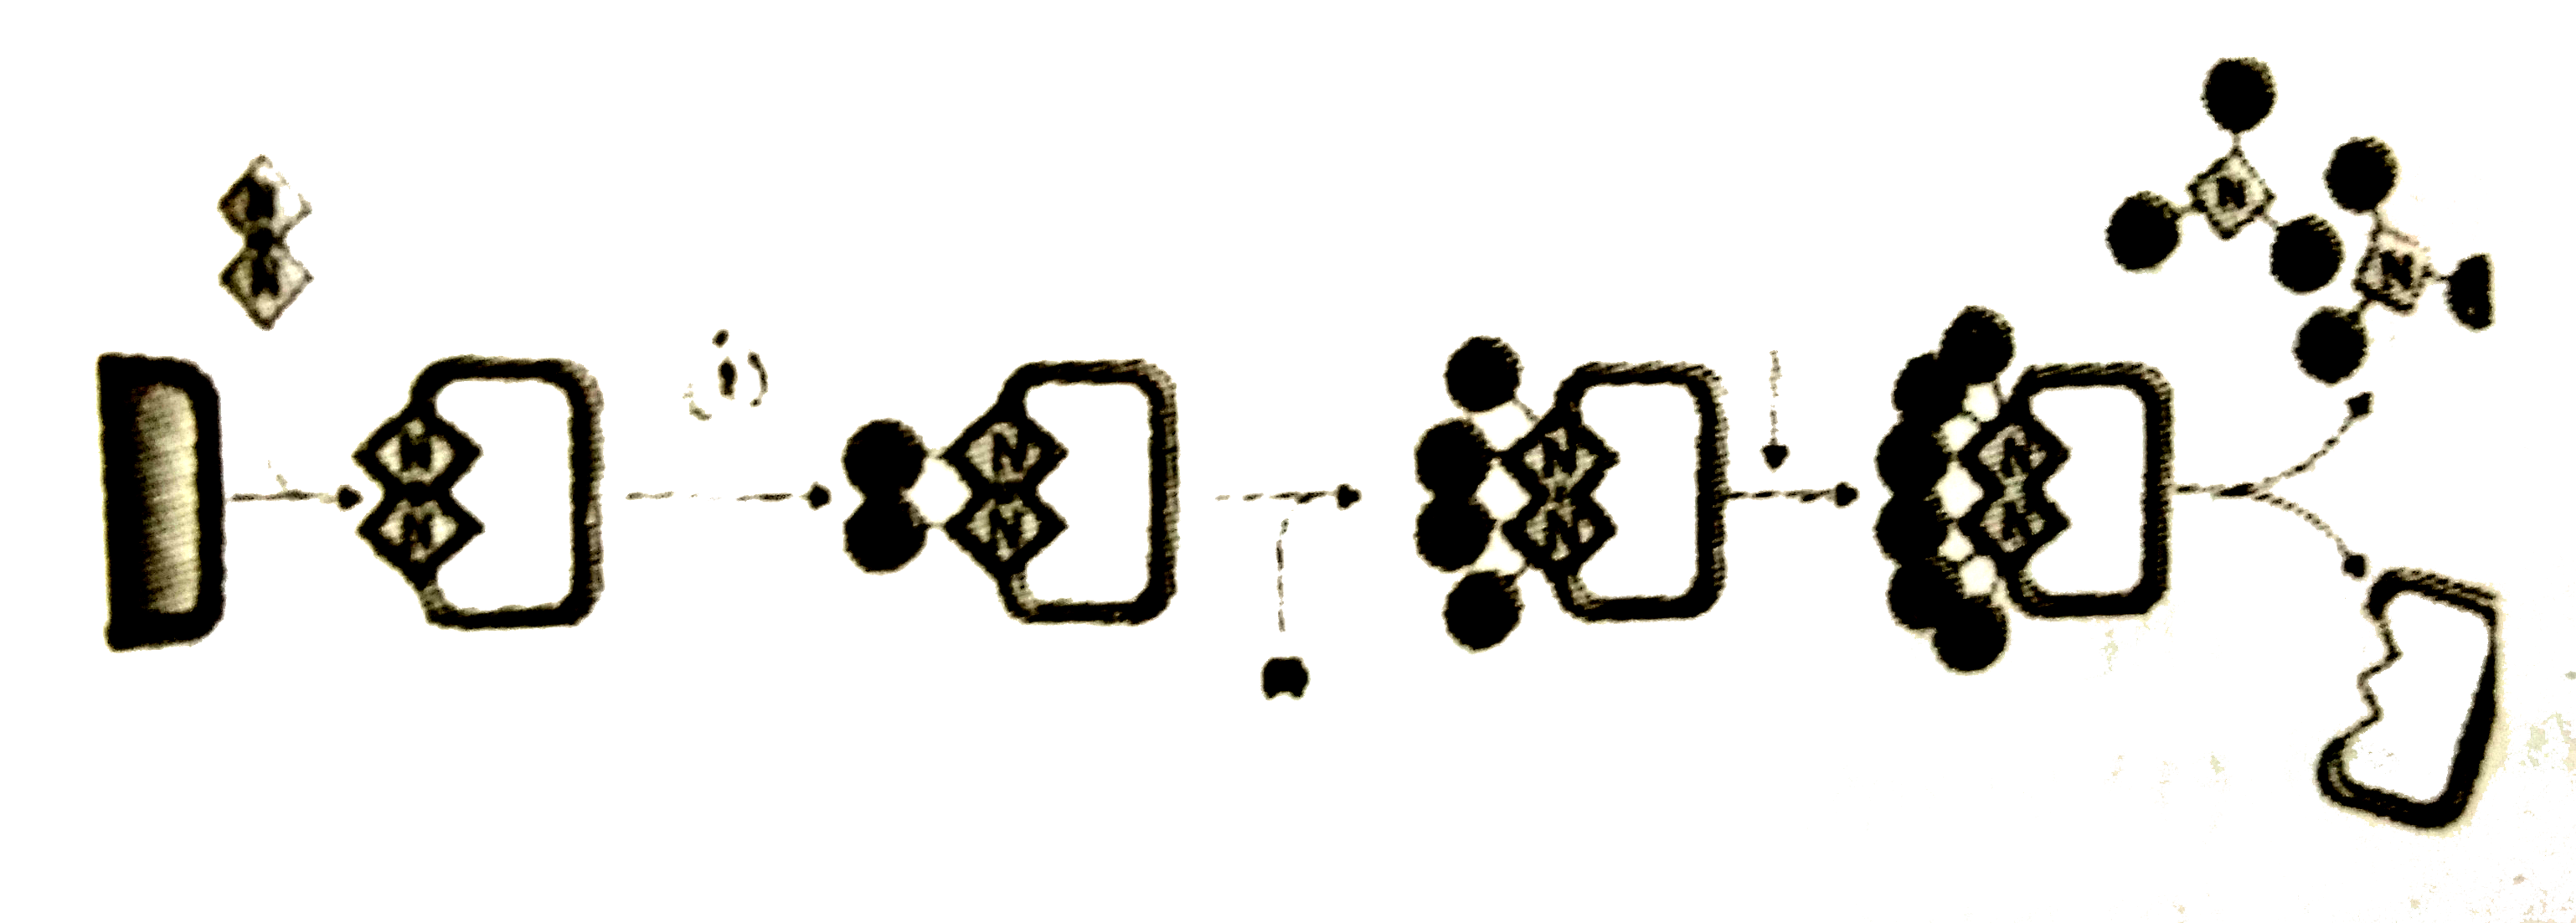
After going through the diagram choose the correct option
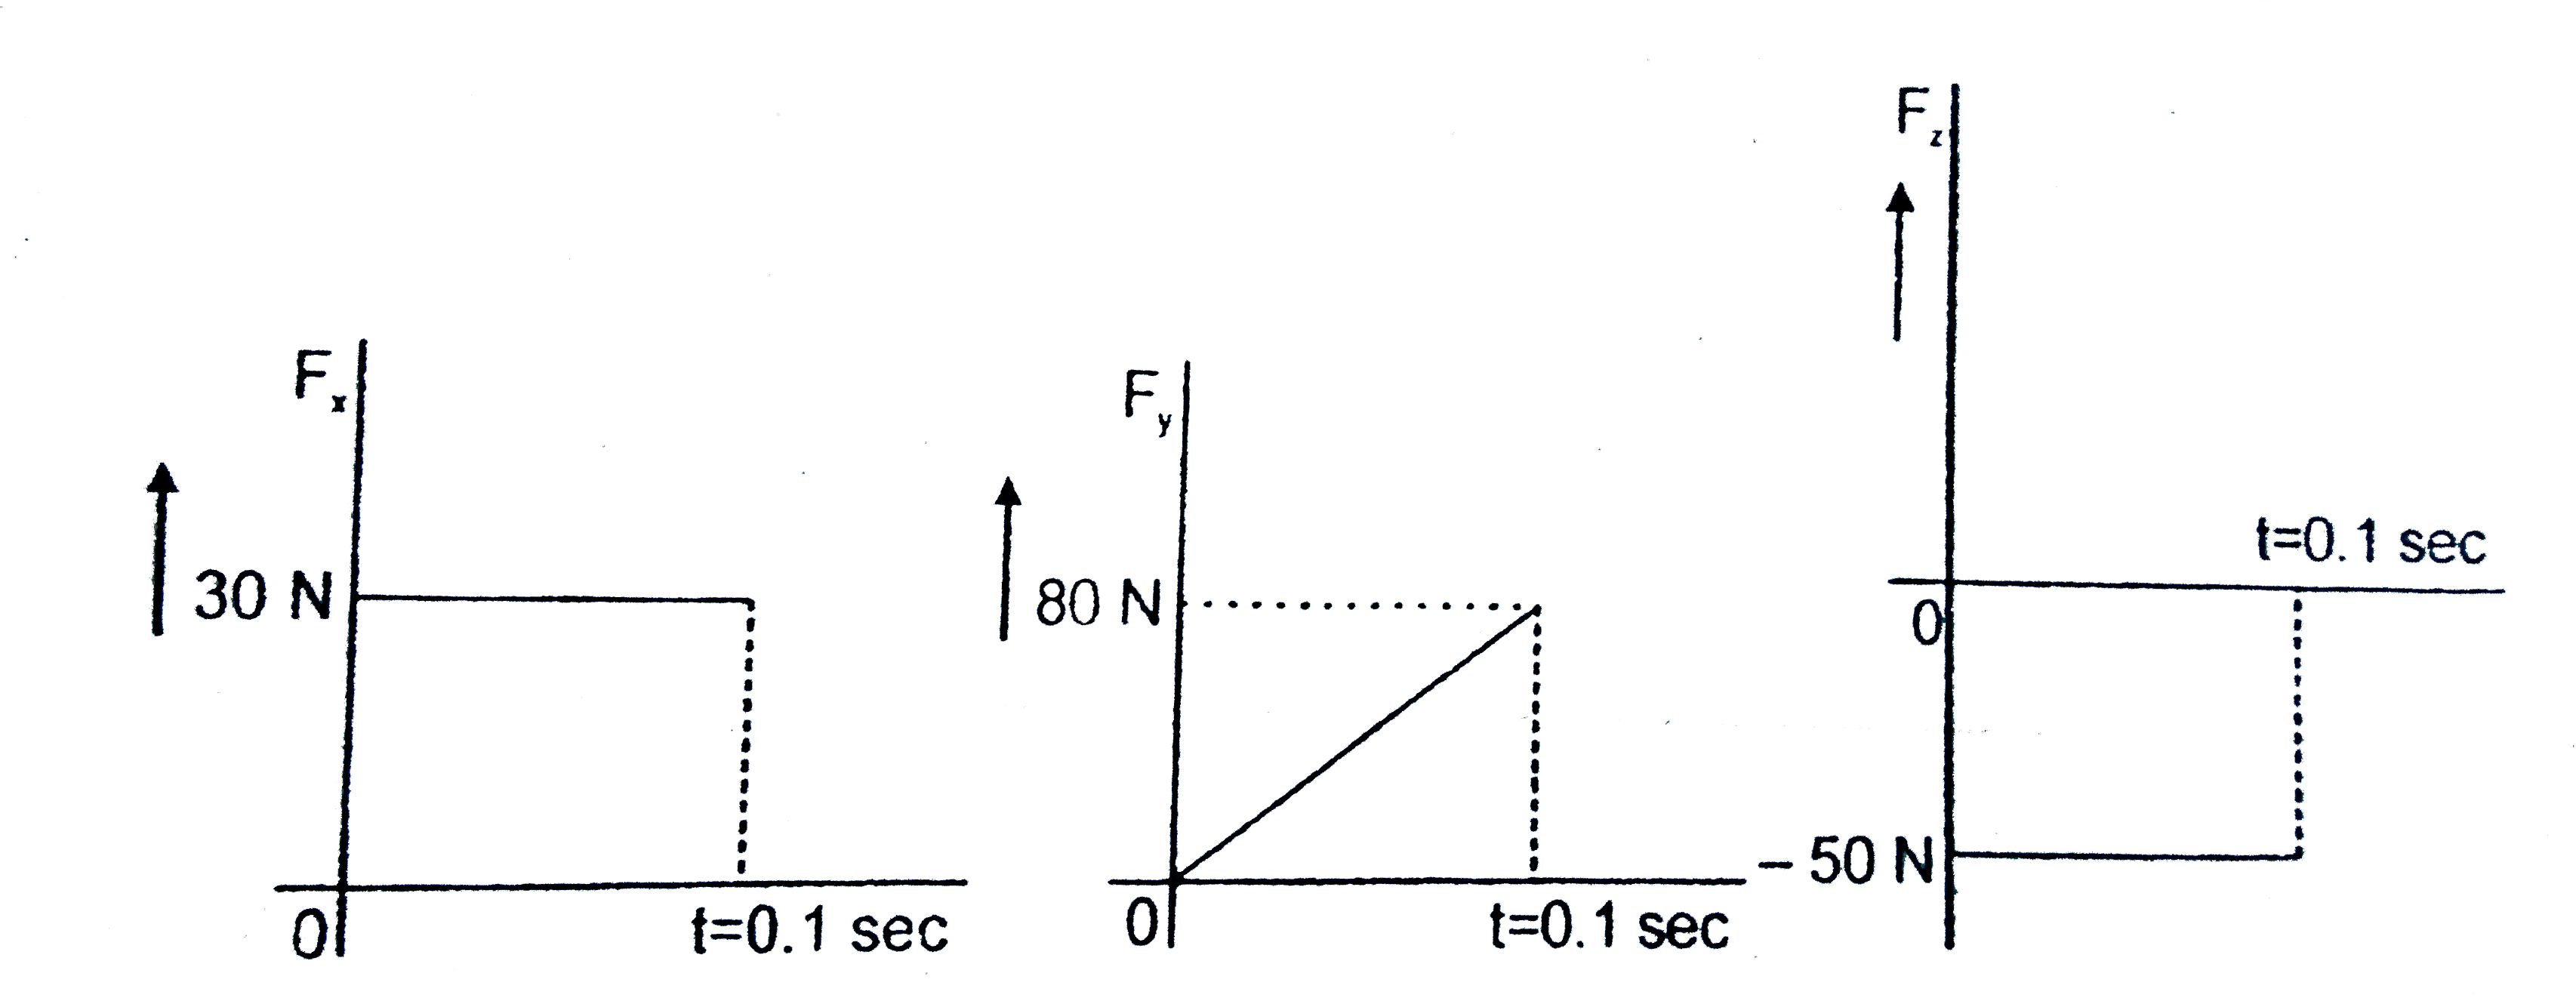
View SolutionA particle is acted upon by a force whose component's variations with time are shown in diagrams. Then choose the correct option(s)
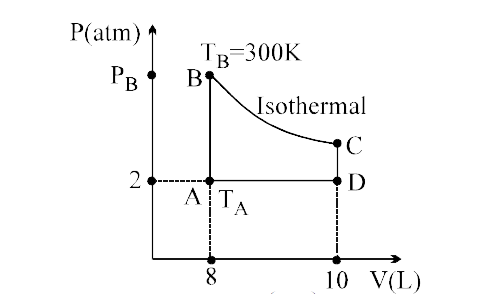
View SolutionAn ideal gas behaving 2moles ( fixed) is subjected to the changes as shown is ( P-V) diagram.Select the correct option ( s) from the following diagram.
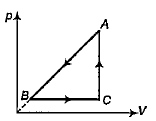
View Solution. p-V diagram of a cyclic process ABCA is as shown in figure. Choose the correct statement
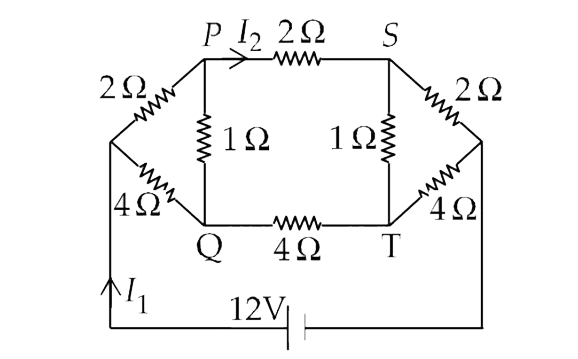
View SolutionFor the resistance network shown in the figure, choose the correct options (s)
View Solution

