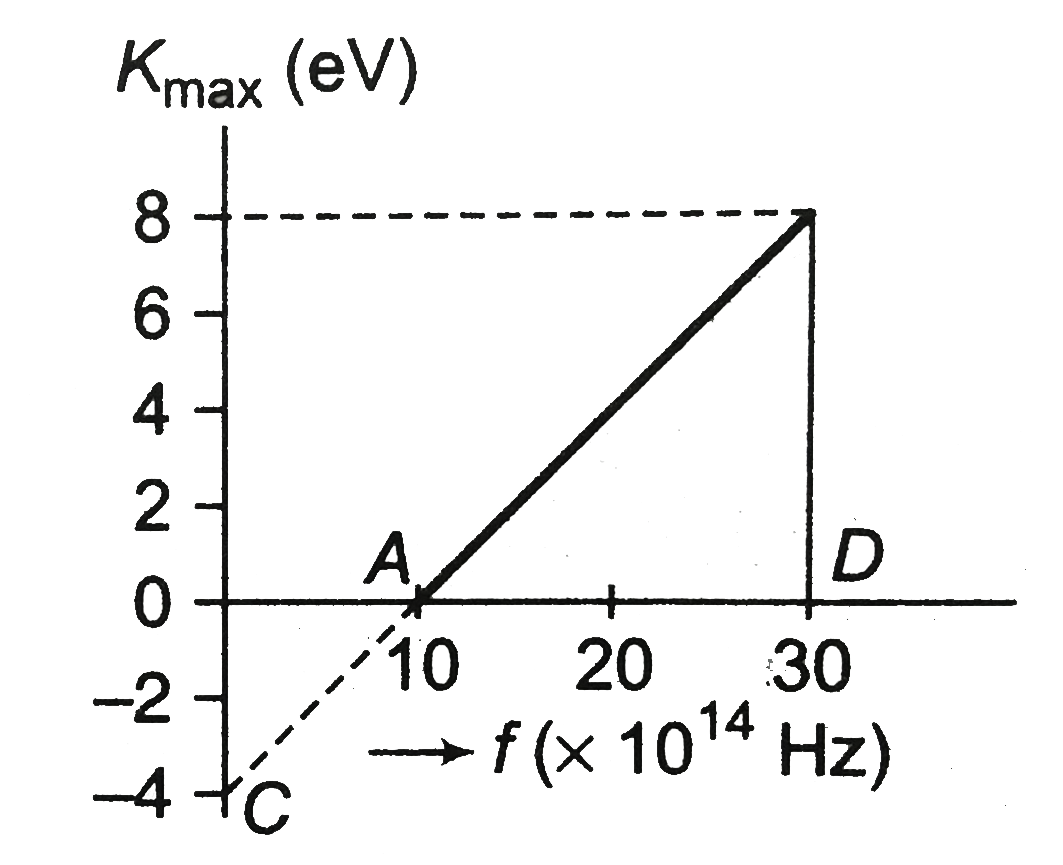
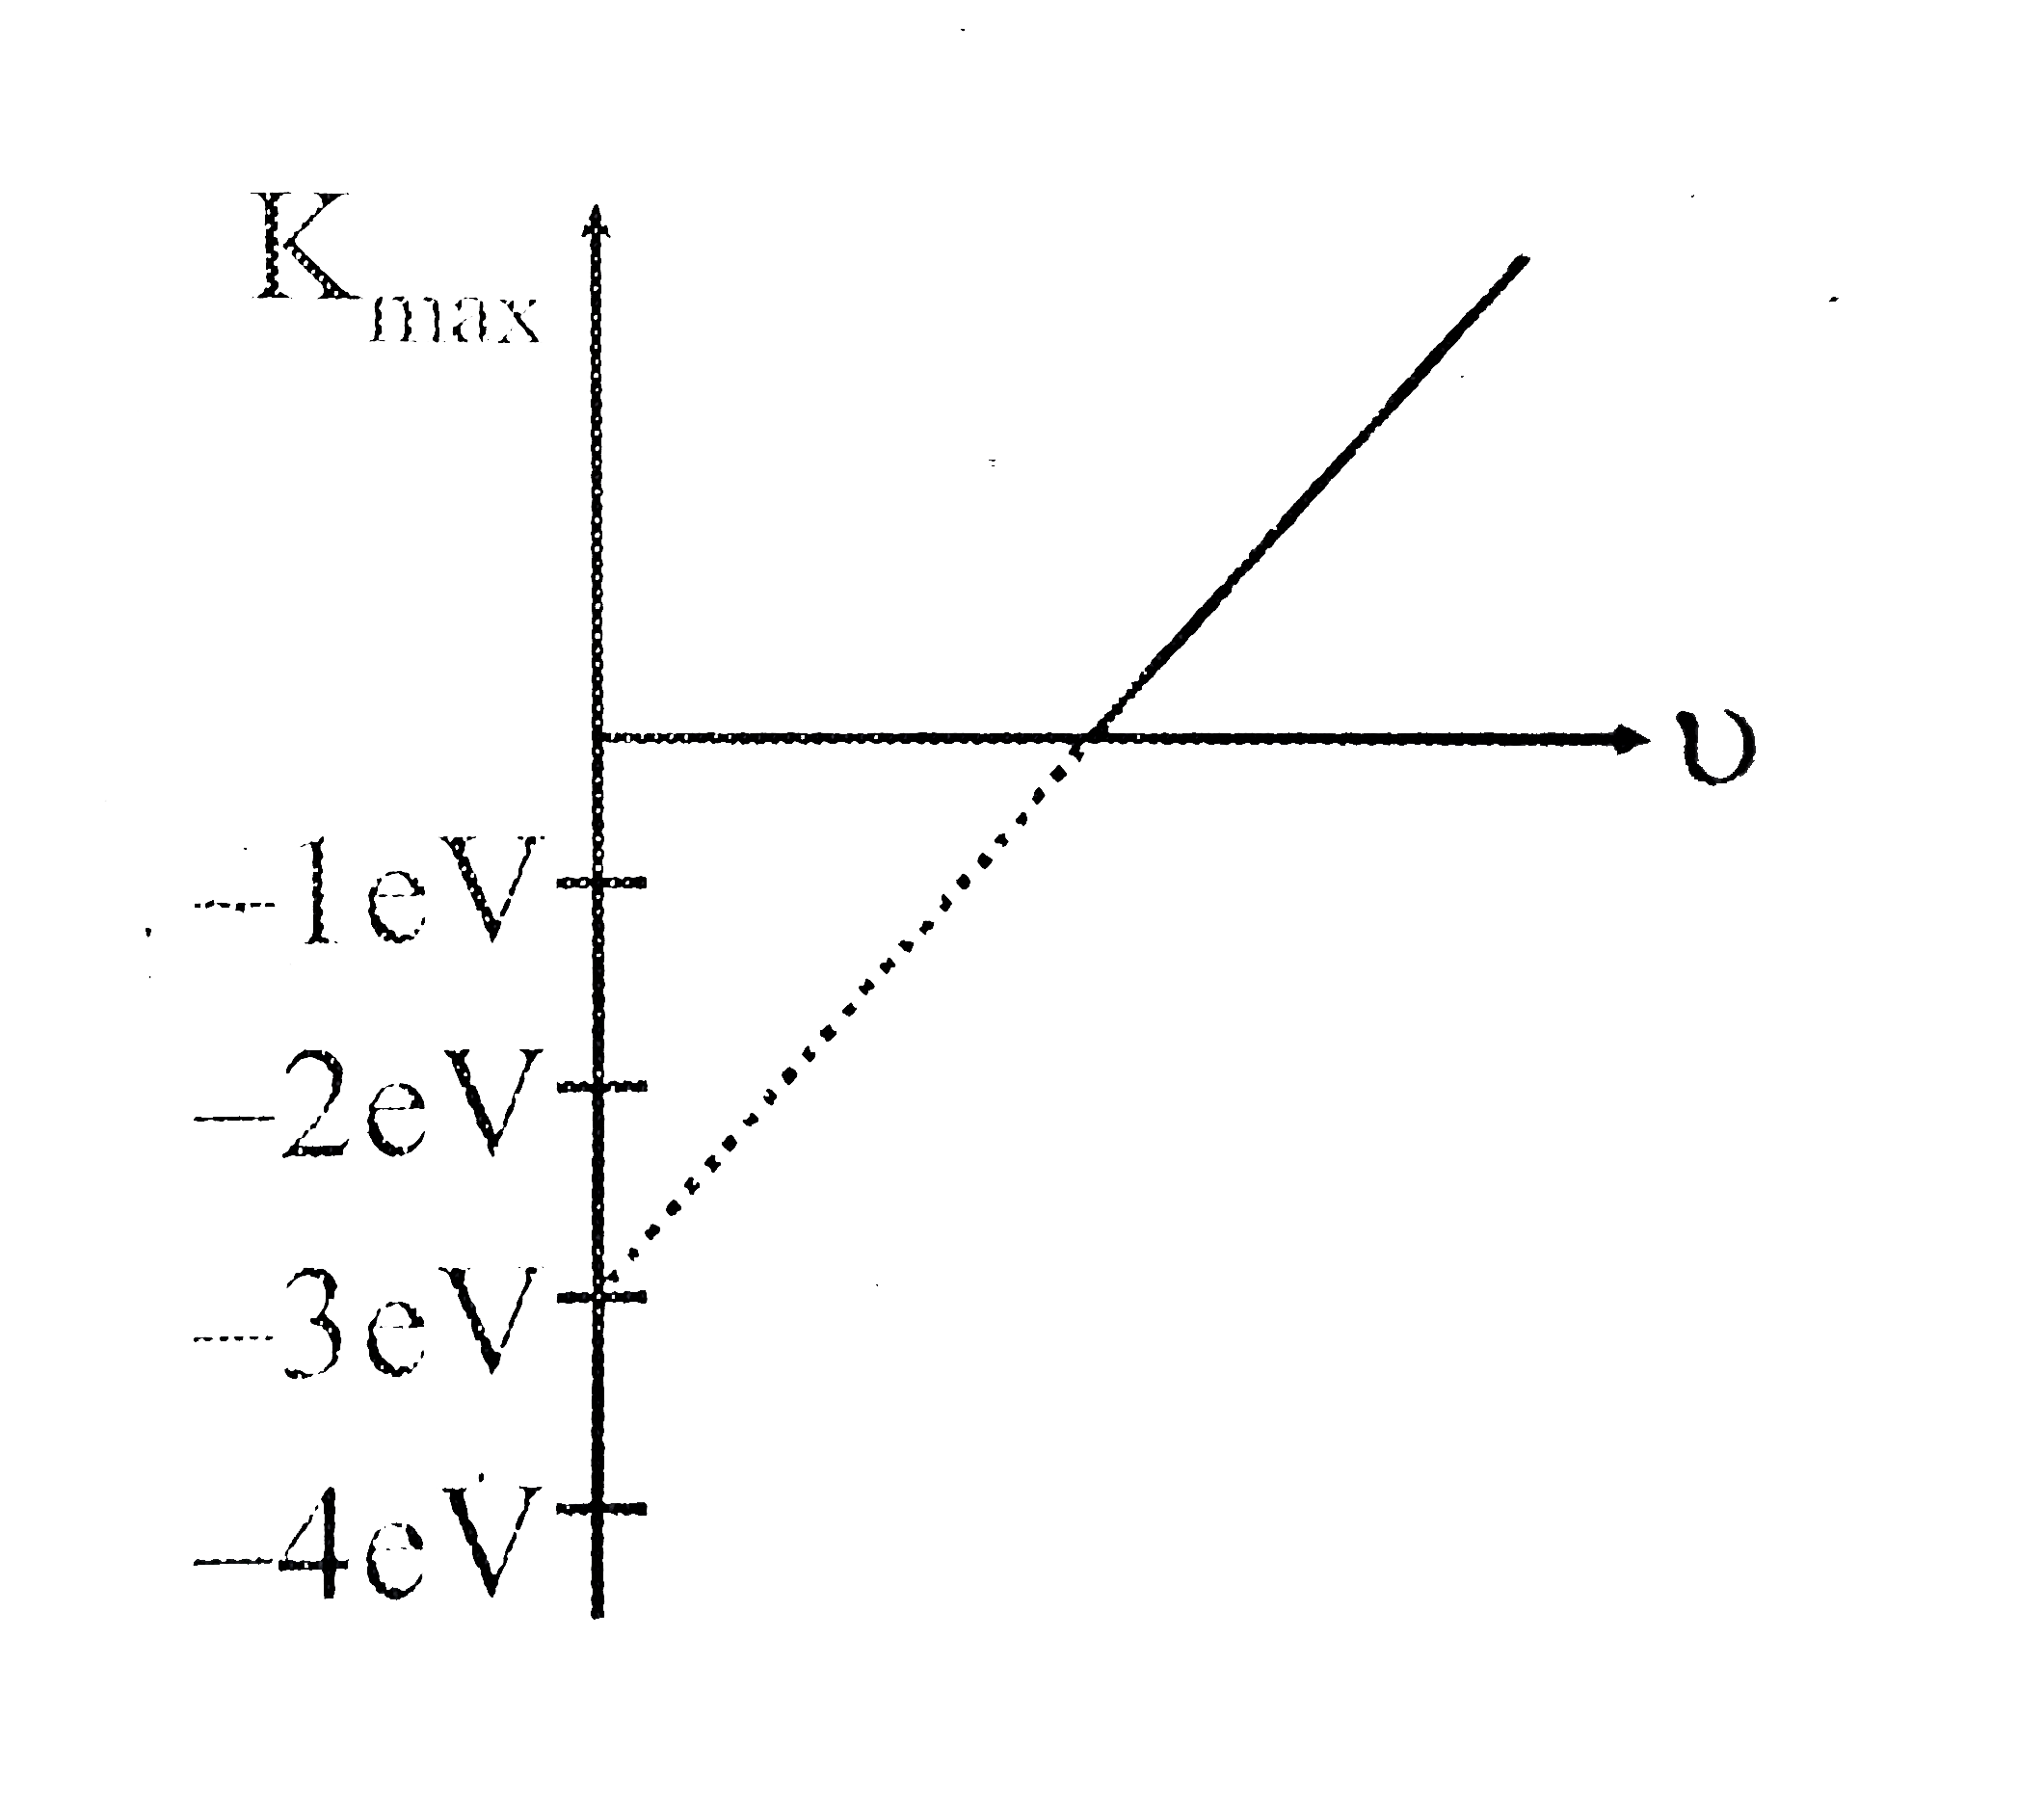
A graph regarding photoelectric effect is shown between the maximum kinetic energy of electrons and the frequency of the incident light. On the basis of data as shown in the graph, calculate (a) threshold frequency , (b) work- function, (c ) planck's constant
2eV
4eV
4.2eV
2.5eV
The correct Answer is:B
From the graph threshold frequency (f0)=10×10−14Hz
h=8×1.6×10−1920×1014=6.4×10⁻³⁴J
work function =hf0=4eV
Topper's Solved these Questions
- DUAL NATUREBOOK - NARAYNACHAPTER - DUAL NATUREEXERCISE - NCERT BASED QUES.
26 Videos
- DUAL NATUREBOOK - NARAYNACHAPTER - DUAL NATUREEXERCISE - LEVEL-V
31 Videos
- DUAL NATUREBOOK - NARAYNACHAPTER - DUAL NATUREEXERCISE - LEVEL-II (C.W)
20 Videos
- DUAL NATURE OF RADIATION AND MATTERBOOK - NARAYNACHAPTER - DUAL NATURE OF RADIATION AND MATTEREXERCISE - ASSERTION AND REASON
15 Videos
- ELECTRIC CHARGES AND FIELDSBOOK - NARAYNACHAPTER - ELECTRIC CHARGES AND FIELDSEXERCISE - EXERCISE -4
43 Videos
Similar Questions
A graph regarding photoelectric effect is shown between the maximum kinetic energy of electrons and the frequency of the incident light. On the basis of data as shown in the graph, calculate (a) threshold frequency , (b) work- function, (c ) planck constant

View SolutionAccording to Einstein's photoelectric equation, the graph between kinetic energy of photoelectrons ejected and the frequency of the incident radiation is :
View Solution
Knowledge Check
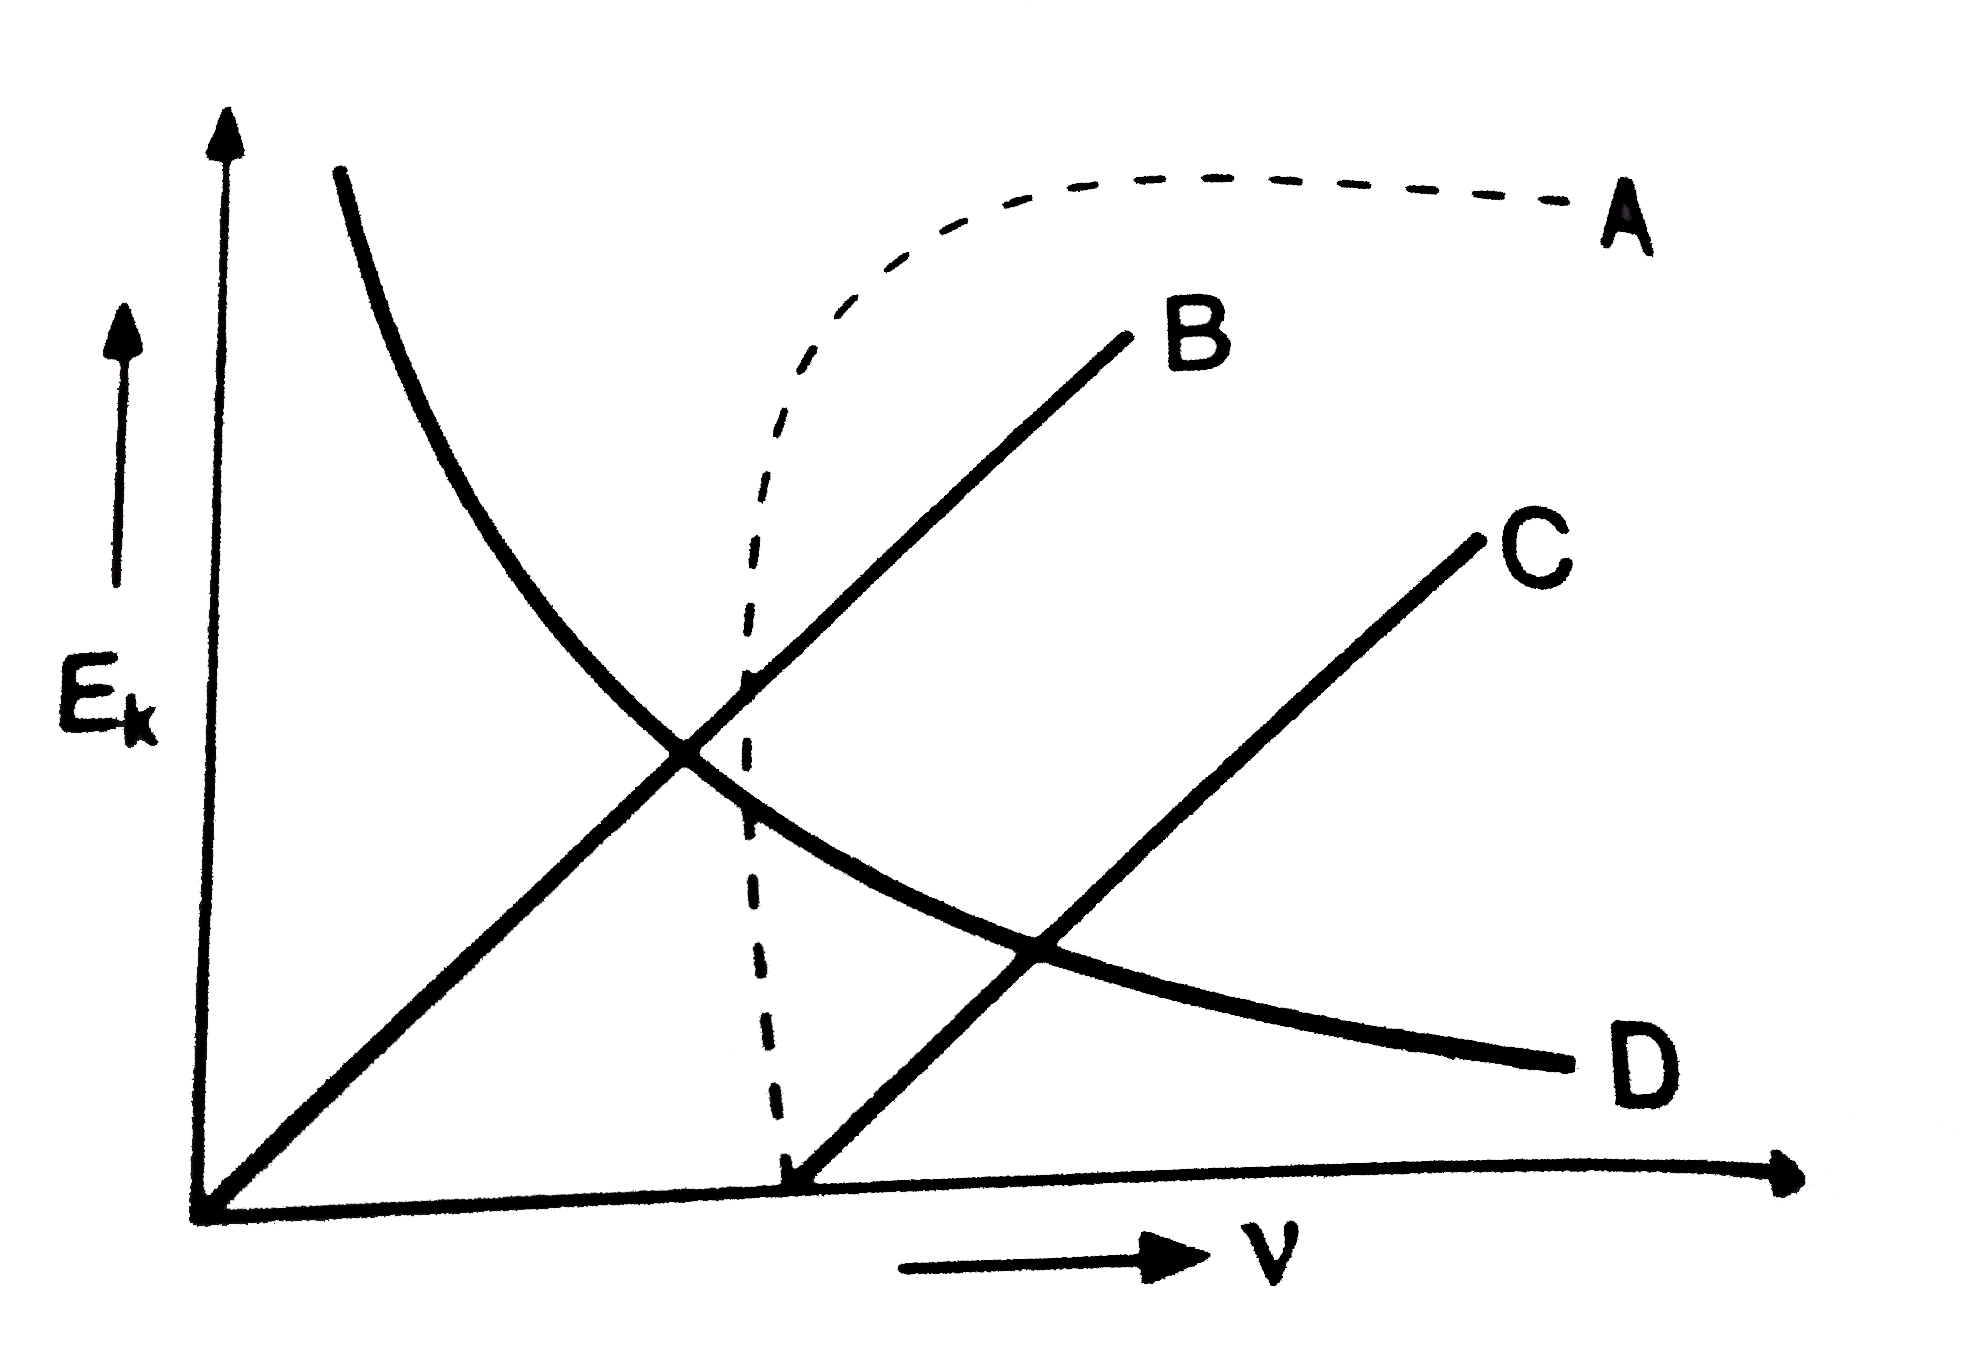
The maximu kinetic energy (Ek) of the photoelectron varies with frequency (v) of the incident light as shown by the curve:
 AABBCCDD
According to Einstein's photoelectric equation, the graph between the kinetic energy of photoelectrons ejected and the frequency of incident radiation is
A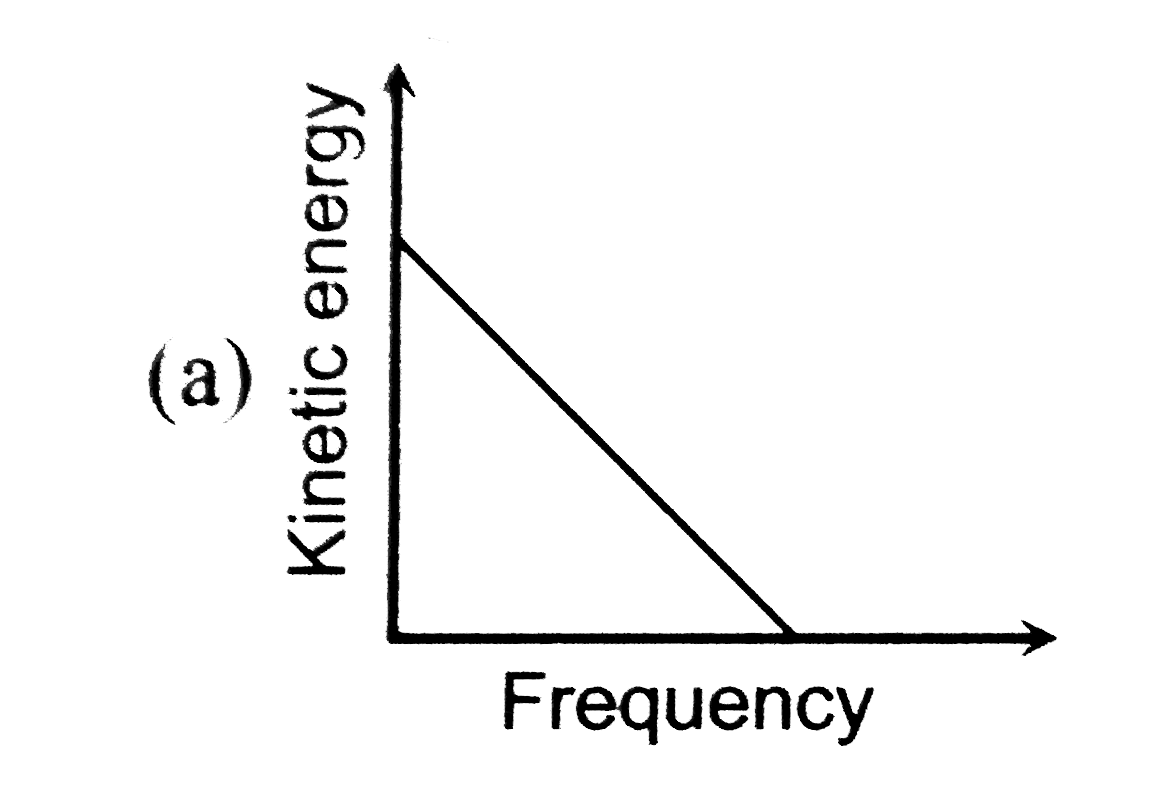 B
B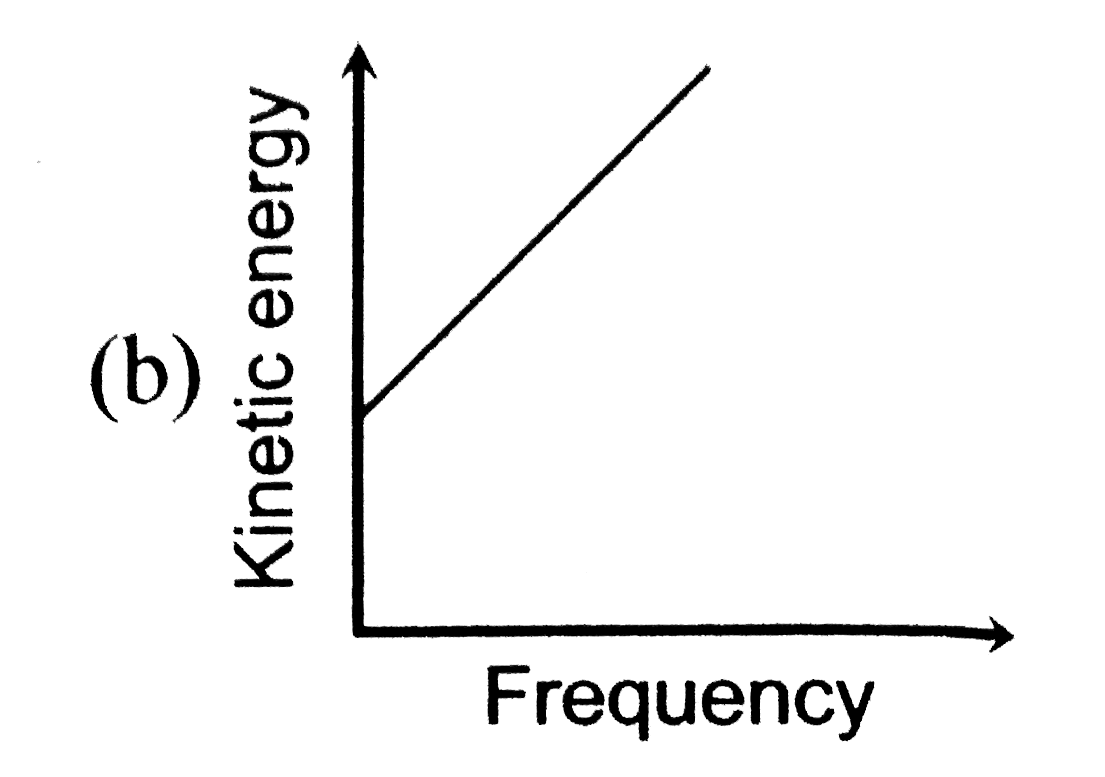 C
C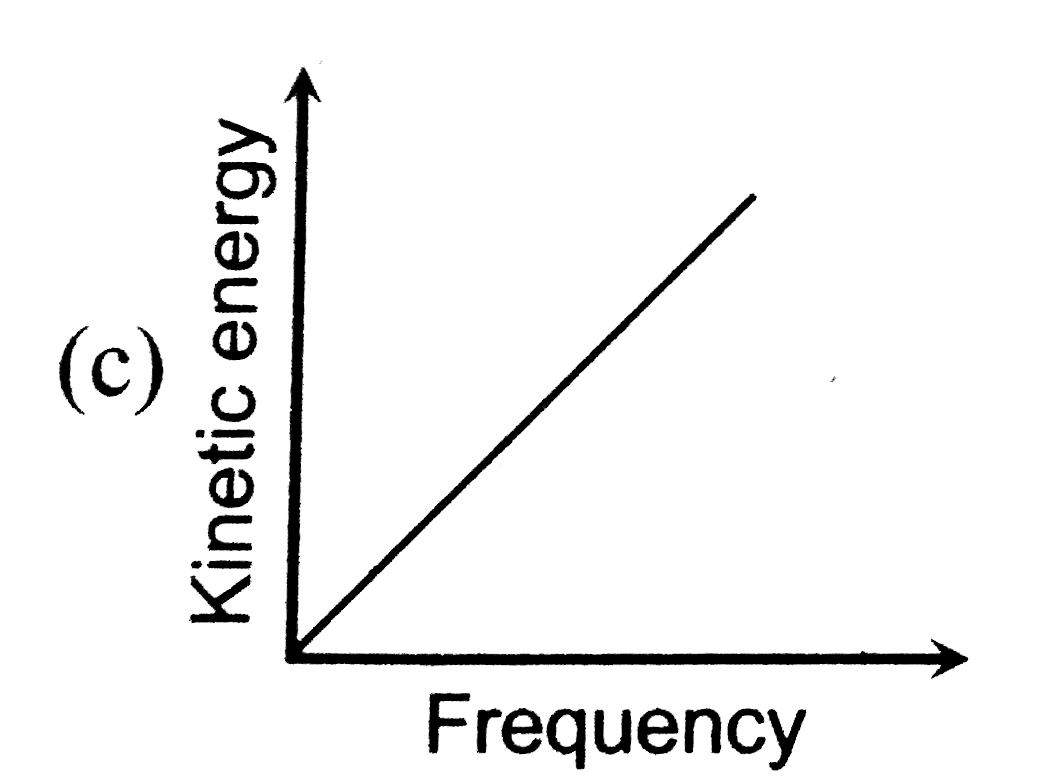 D
D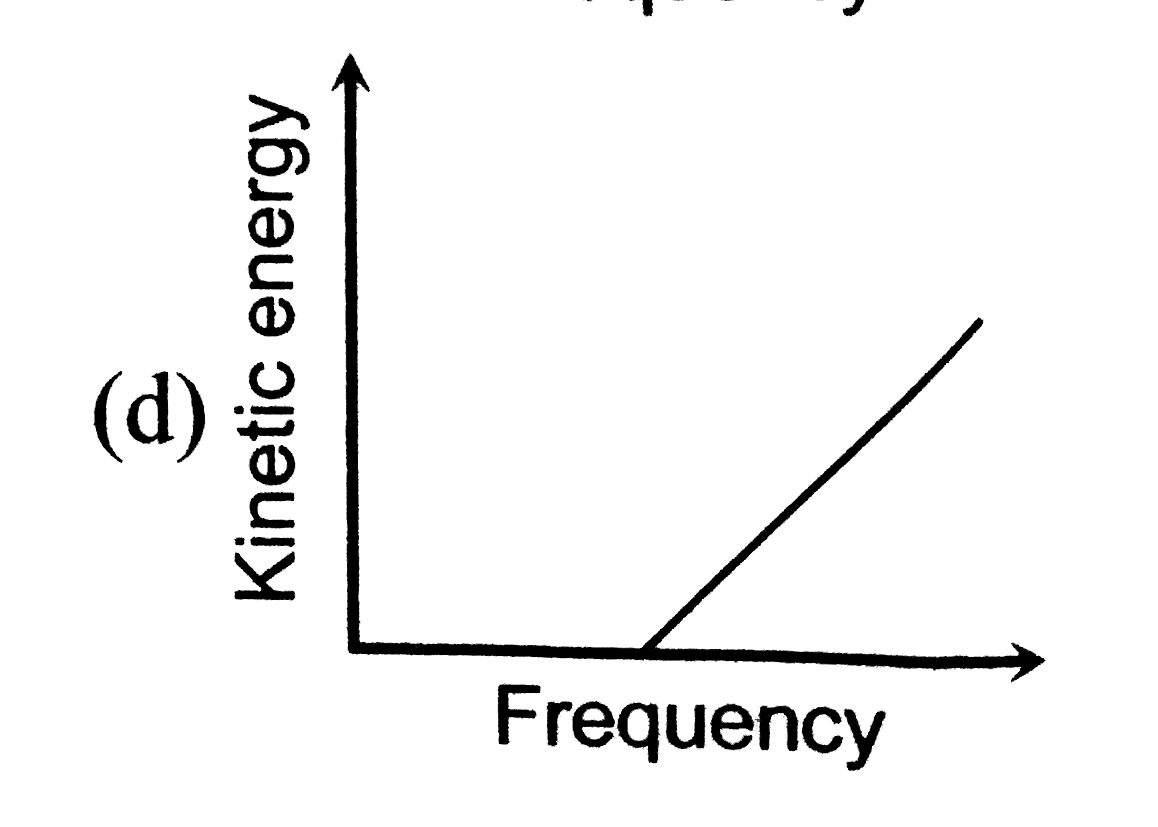
For the photoelectric effect, the maximum kinetic energy Ek of the emitted photoelectrons is plotted against the frequency ν of the incident photons as shown in the figure. The slope of the curve gives
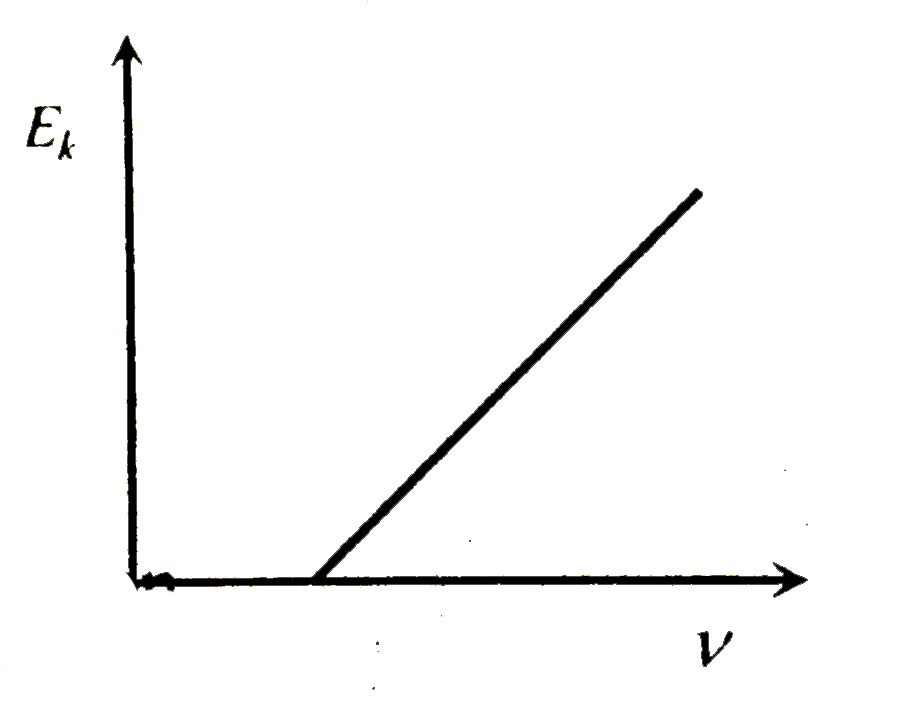 ACharge of the electronBWork function of the metalCPlanck's constantDRatio of the Planck’s constant to electronic charge
In an experiment on photoelectic effect, the graph between maximum kinetic energy (Kmax) and frequency of emitted photoelectron from metal surface is found to be a straight line as shown in fig. Calculate
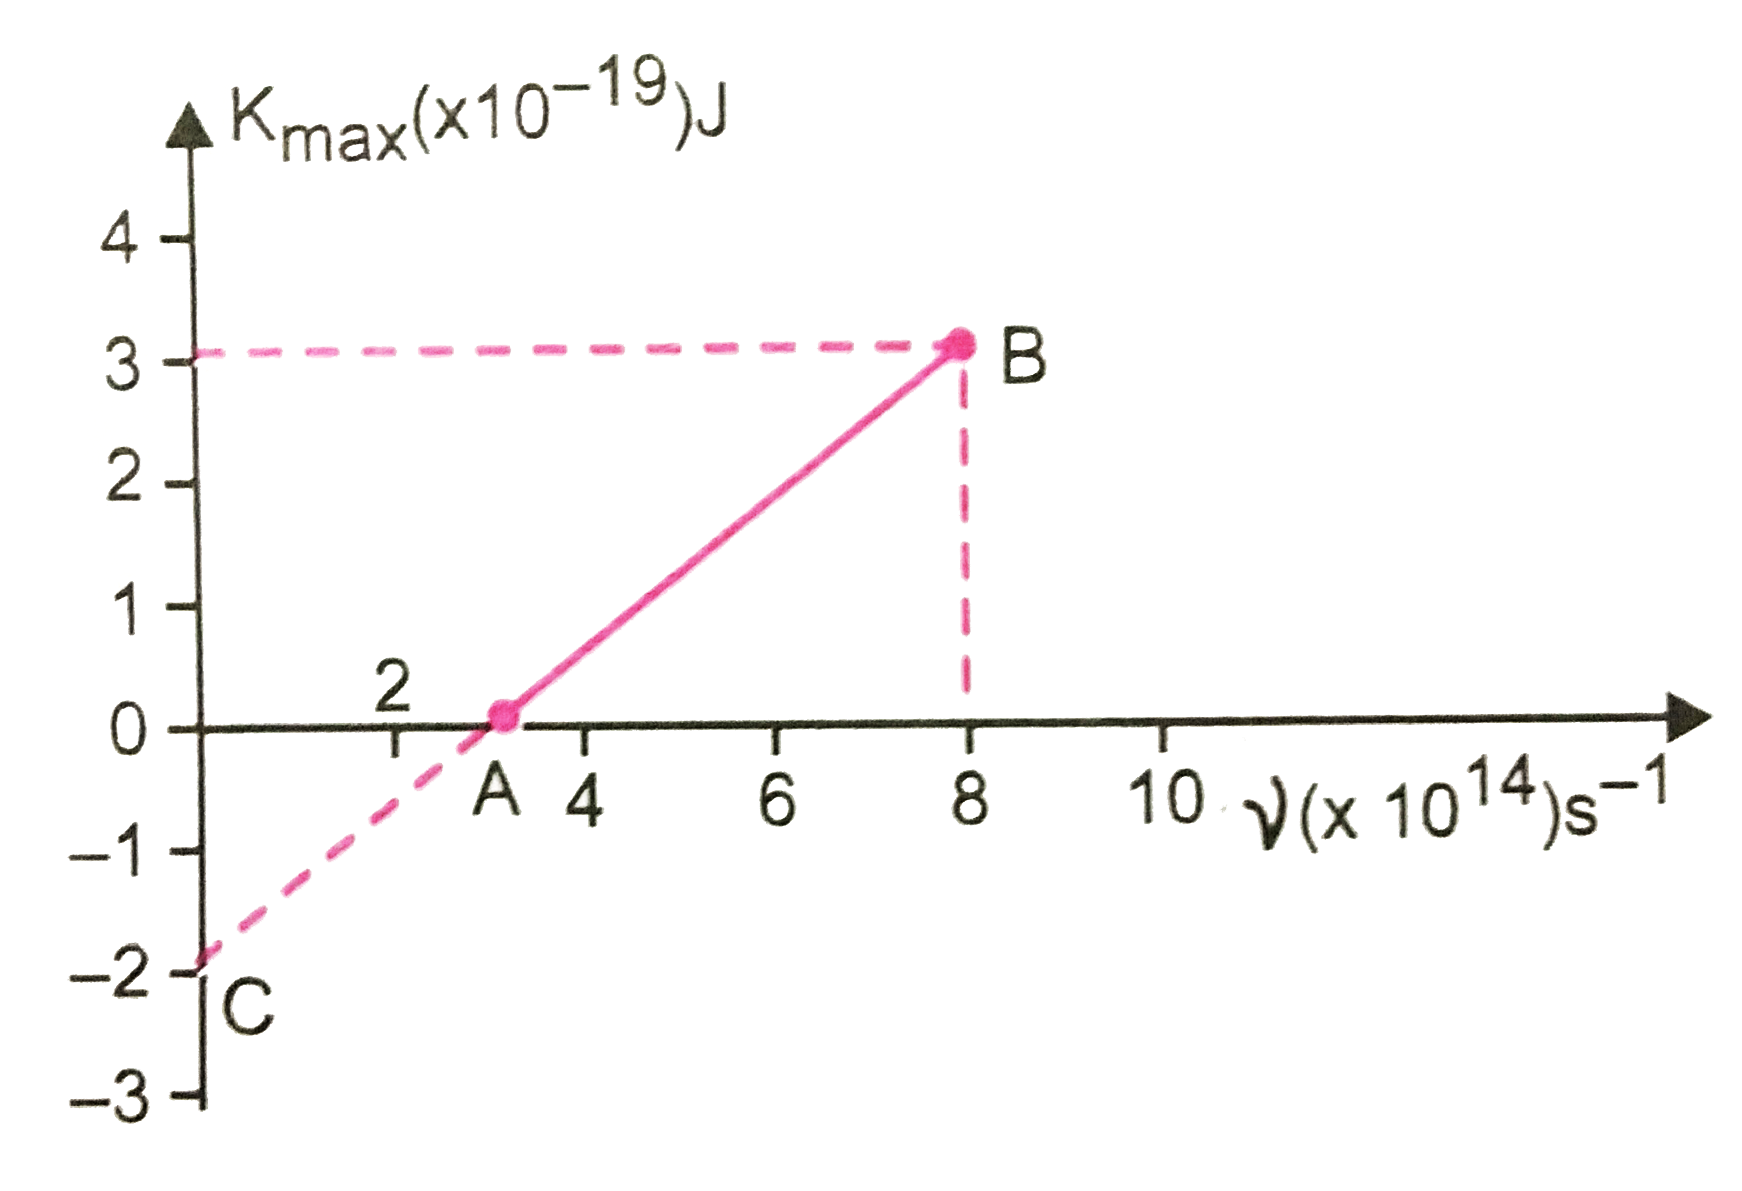
(a) thereshold frequency.
(b) work function of metal in electron volt.
(c) Planck's constant and
maximum kinetic energy of the emitted electron by light of frequency v=8×10¹⁴s−1.
View SolutionFor a photoelectric experiment graph between kinetic energy of fastest electron and frequency of light is plotted find threshold wavelength of metal.
View SolutionThe correct graph respectivley the relation between energy (E) of photoelectrons and frequency v of incident light is
View SolutionFor the photoelectric effect, the maximum kinetic energy Ek of the emitted photoelectrons is plotted against the frequency of the incident photons as shown in the figure. The slope of the curve gives

View SolutionIn photo electric effect, the slope of the straight line graph between stopping potential and frequency of the incident light gives the ratio of Planck's constant to
View Solution
