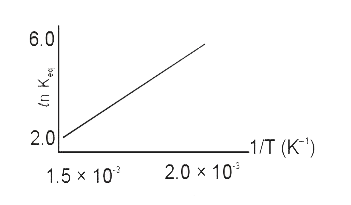
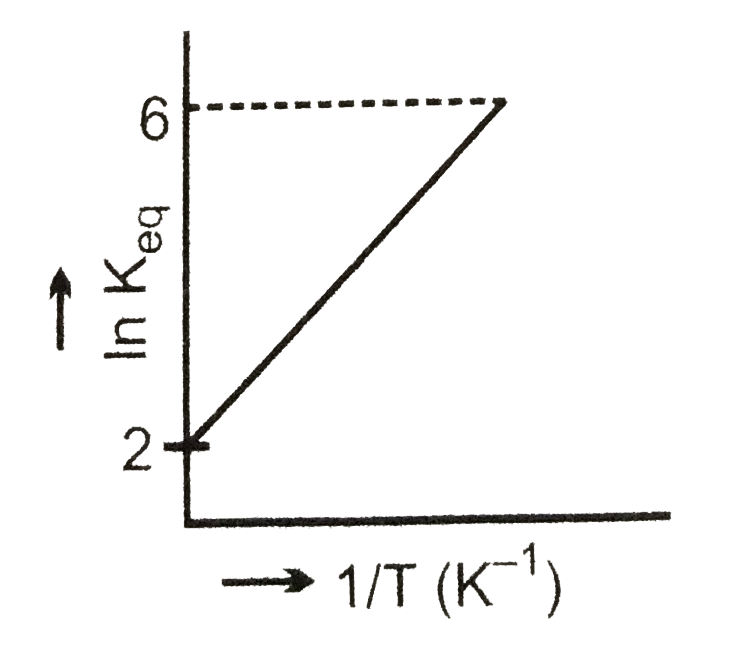
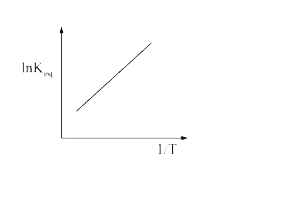
A schematic plot of InKeq versus inverse of temperature for a reaction is shown below

The reaction must be
A
highly spontaneous at ordinaty temperature
B
one with nigligible enthalpy change
C
endothermic
D
exothermic
Text Solution
The correct Answer is:D
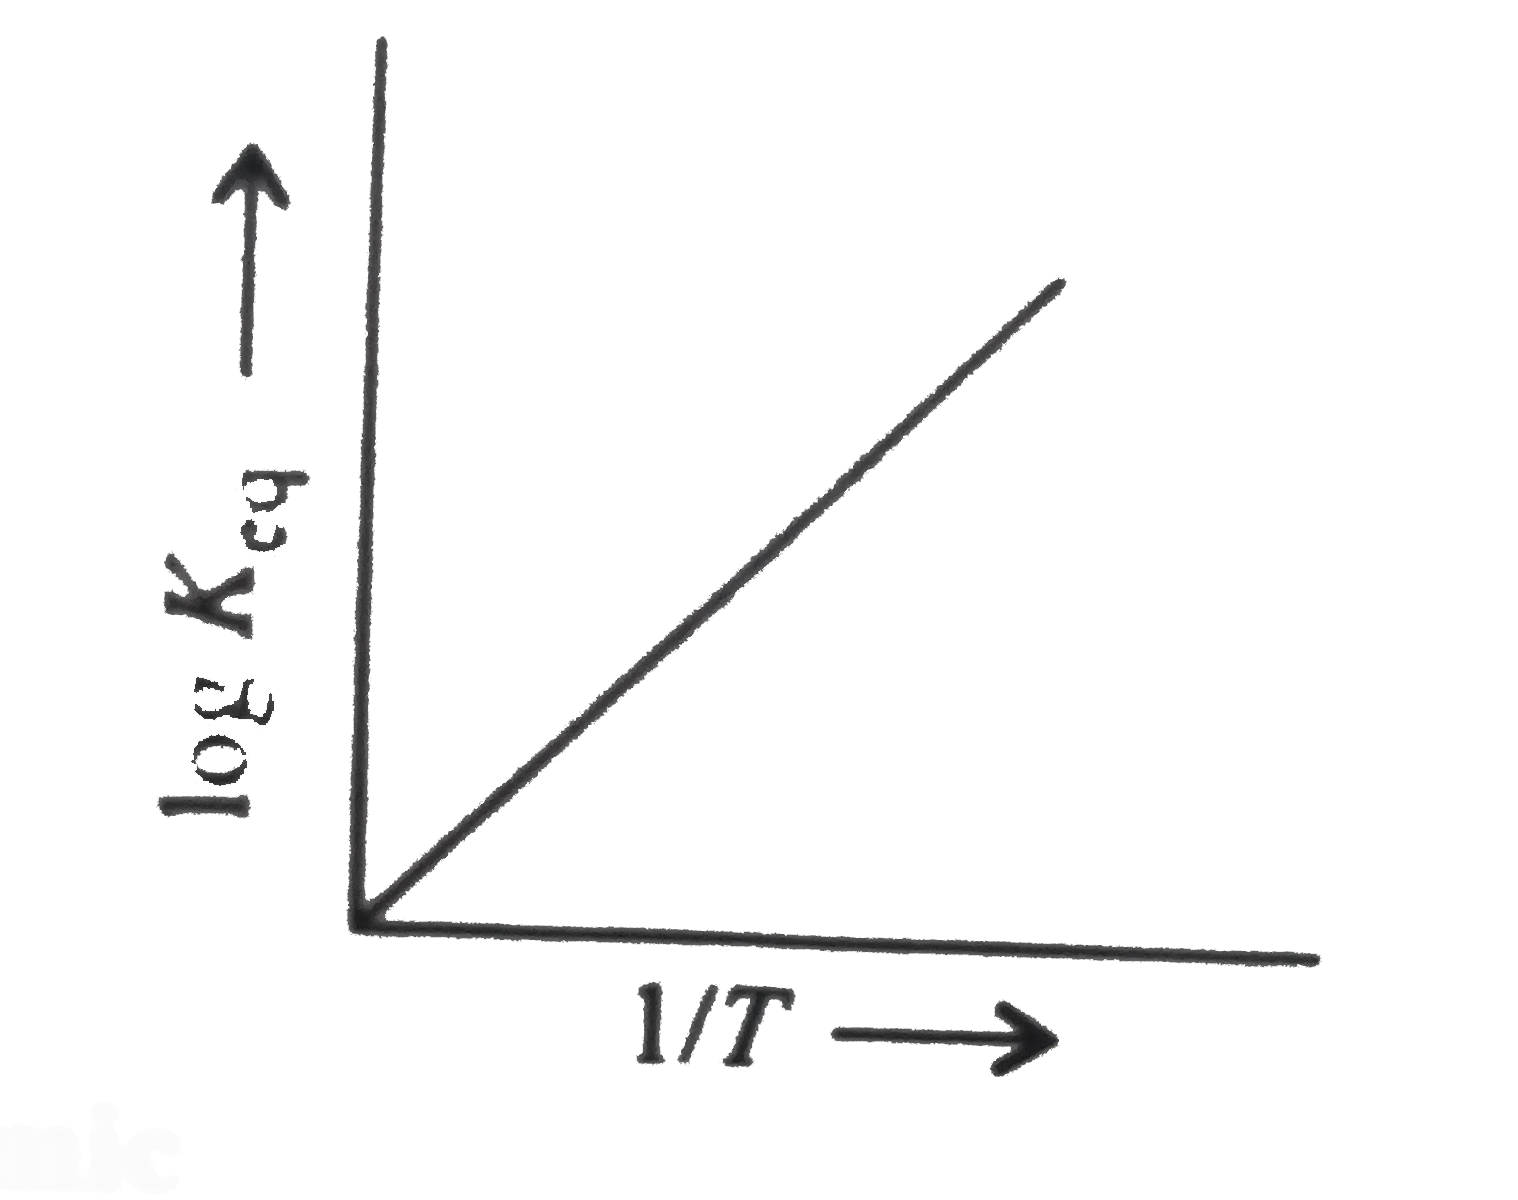
The graph show that reactionn is exothermic
logk=−ΔHRT+1
For exothermic reaction ΔH<0
∴logkVs1T would be negative lin with positive slope.
|
Topper's Solved these Questions
Similar Questions
Knowledge Check
A schematic plot of ln Keq versus inverse of temperature for a reaction is shown below

The reaction must beAendothermicBexothermicChighly spontaneous at ordinary temperatureDone with negligible enthalpy changeA schematic plot of In Keq versus inverse o ftemperature for a reaction is shown below

the reaction must be:AExothermicBEndothermicCOne with negligible enthalpy changeDHighly spontanceous at ordinary temperatureA schematic plot of log Keq vs inverse of temperature for a reaction is shown in the figure. The reaction must be:
 AExothermicBEndothermicCOne with negligible enthalpy changeDHighly spontaneous at ordinary temperature
A schematic plot of In Keq versus inverse o ftemperature for a reaction is shown below

the reaction must be:
View SolutionA schematic plot of log Keq vs inverse of temperature for a reaction is shown in the figure. The reaction must be:

View SolutionThe plot of ΔG versus temperature for the formation of oxides of elements is called
View SolutionAssertion: The plot of volume (V) versus pressure (P) at constant temperature is a hyperbola in the first quadrant.
Reason: V∝1/P at constant temperature.
View SolutionThe plot of ΔG versus temperature for the formation of oxides of elements is called
View Solution

