The slope of T−P graph for a given mass of a gas increases, the volumn of the gas
increases
decreases
does not change
May increase or decreases.
The correct Answer is:B
Step by step video, text & image solution for The slope of T-P graph for a given mass of a gas increases, the volumn of the gas by Physics experts to help you in doubts & scoring excellent marks in Class 11 exams.
Topper's Solved these Questions
- BOOK - NARAYNACHAPTER - THERMAL PROPERTIES OF MATTEREXERCISE - LEVEL - I (C.W.)24videos
THERMAL PROPERTIES OF MATTER
- BOOK - NARAYNACHAPTER - THERMAL PROPERTIES OF MATTEREXERCISE - LEVEL - II (C.W.)20videos
THERMAL PROPERTIES OF MATTER
- BOOK - NARAYNACHAPTER - SYSTEM OF PARTICLES AND ROTATIONAL MOTION EXERCISE - EXERCISE - IV39videos
SYSTEM OF PARTICLES AND ROTATIONAL MOTION
- BOOK - NARAYNACHAPTER - THERMODYNAMICSEXERCISE - Exercise187videos
THERMODYNAMICS
Similar Questions
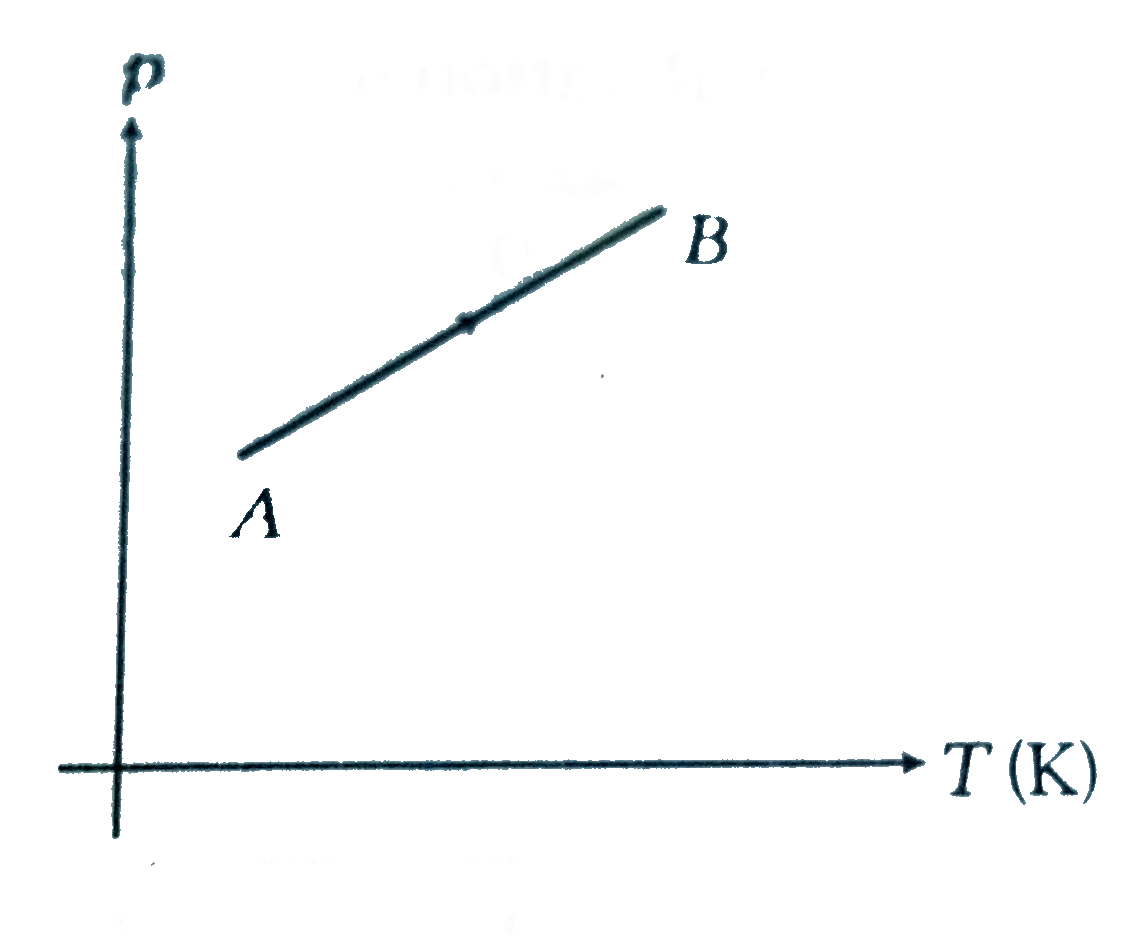
The p−T graph for the given mass of an ideal gas is shown in figure. What inference can be drawn regarding the change in Volume (whtherit is constant, increasing or decreasing) ?
 View Solution
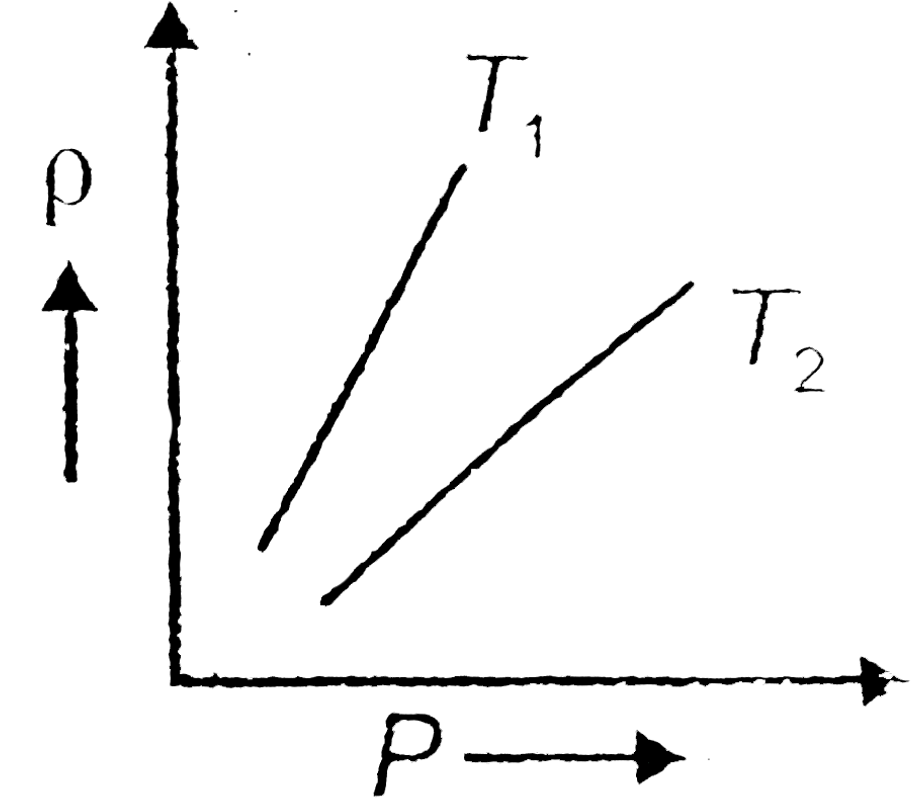
The density (ρ) versus pressure (P) graphs of a given mass of an ideal gas is shown at two temperatures T1andT2. Then relation between T1andT2 may be
 View Solution
Knowledge Check
- Question 1 - Select One
The P−T graph for the given mass of an ideal gas is shown in figure. Then the volume
_E01_022_Q01.png) AincreasesBdecreasesCremains constantDdata insuficient
AincreasesBdecreasesCremains constantDdata insuficient - Question 2 - Select One
For a given mass of gas isobar is the graph drawn between
AP and volume at constant TBT and P at constant VCT and V at constant PDP and 1V at constant T - Question 3 - Select One
The temperature of a given mass of a gas is increased from 19∘C to 20∘C at constant pressure. The volume V of the gas is
Ato V(2019).Bby 1273.15 of its volume at 0∘C.Cby 1273.15 of its volume at 0K.Dby a factor of 1273.15 of its volume at 19∘C.
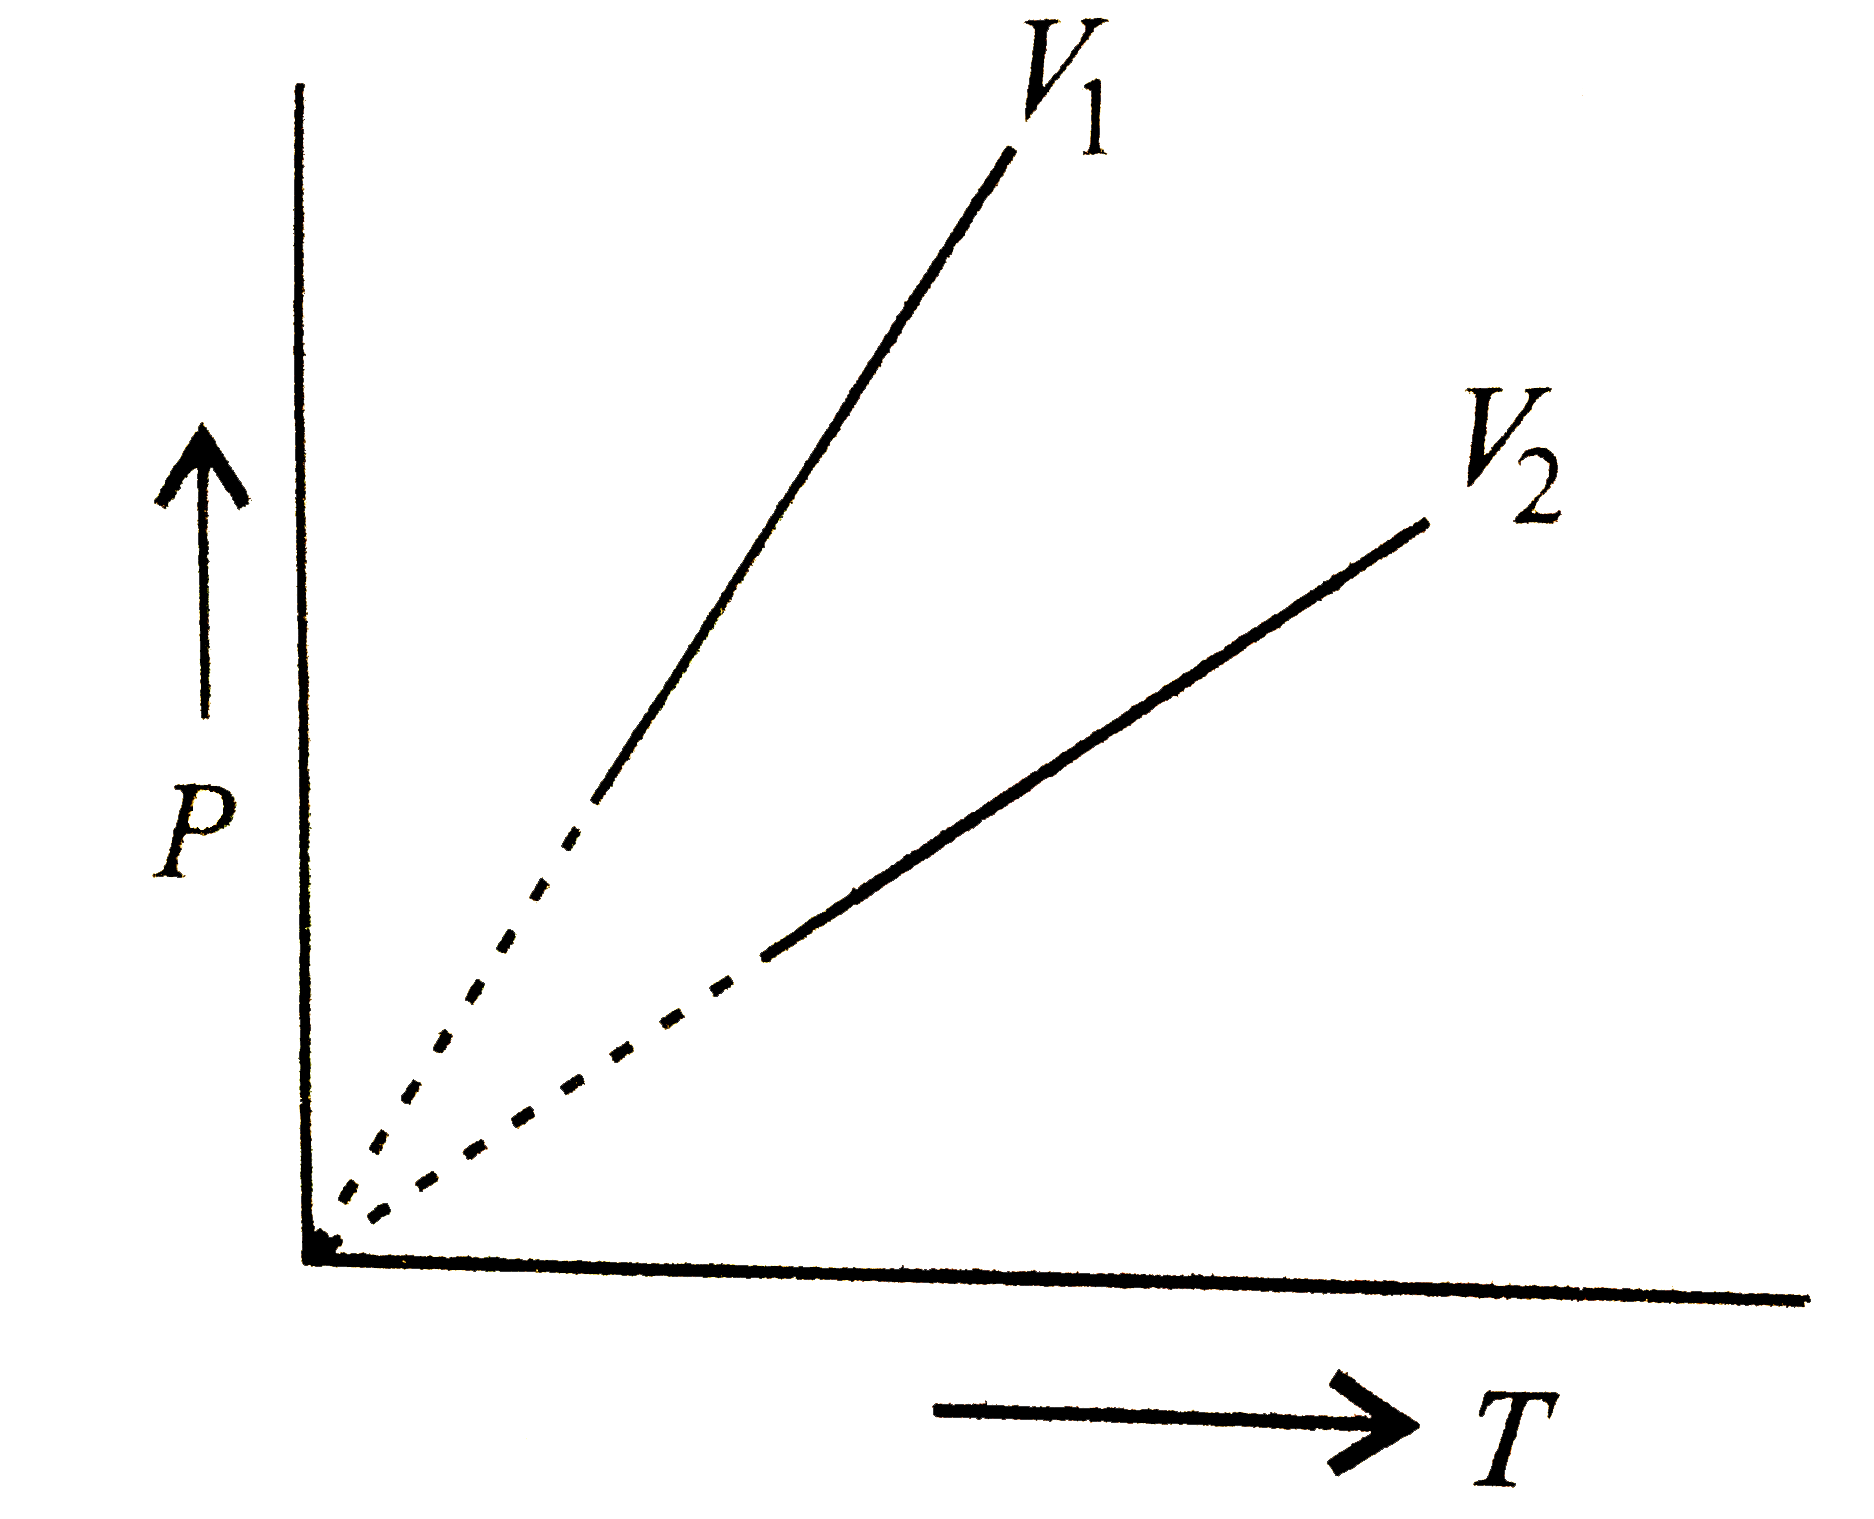
A plot of P vs T for a given mass of gas at constant volume is a straight line . P vs T at constant volumes V1 and V2 for an ideal gas are shown below :
Which of the following is correct ?
 View Solution
What is the nature of graph of PV versus P for a given mass of a gas at constant temperature?
View SolutionWhat is the nature of graph of P versus (1/V) for a given mass of gas at constant temperature ?
View SolutionThe graph between pressure P and volume V for a given mass of a gas a fixed temperature T is a ________ .
View Solution
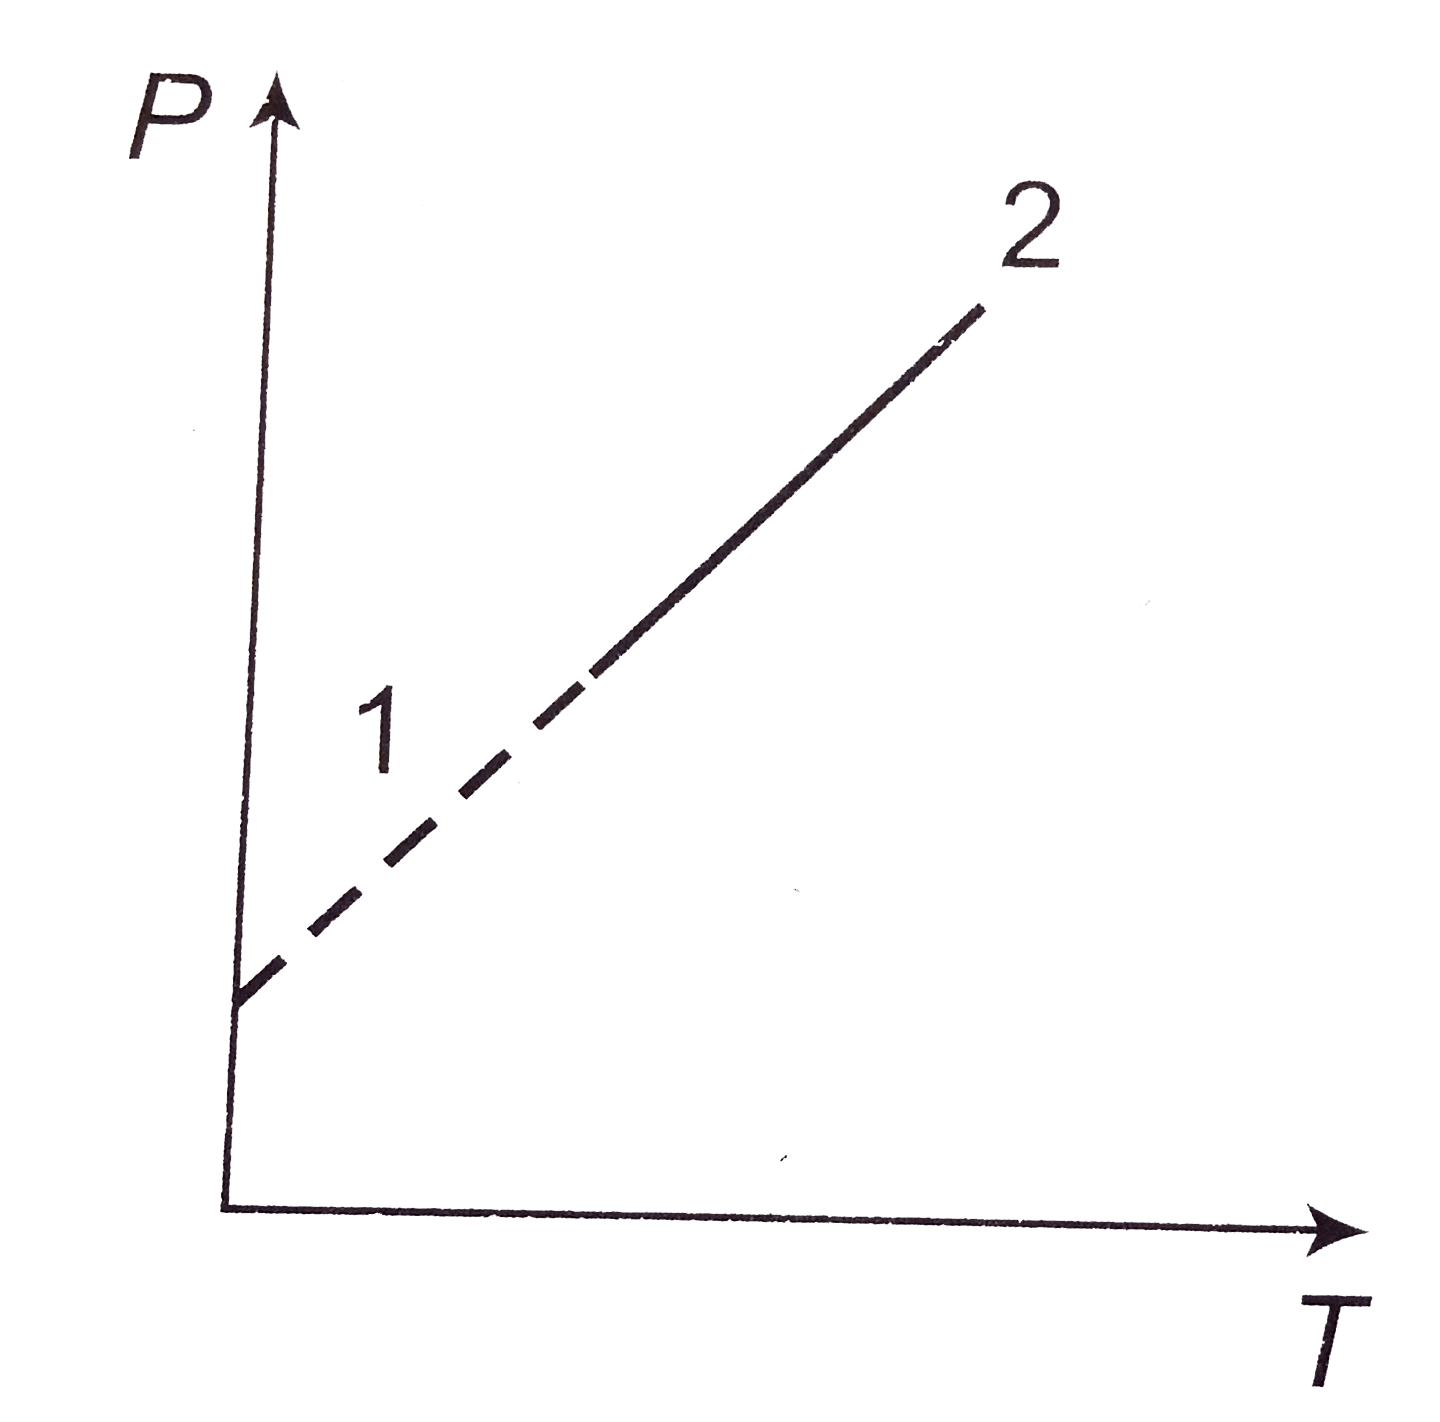
A pressure P, absolute temperature T, graph was obtained whe a given mass of a gas heated. During the heating process from the state 1 to the state 2, the volumeView Solution

