Which one of the given graphs shows the effect of temperature on the velocity of a typical enzymatic reaction ?
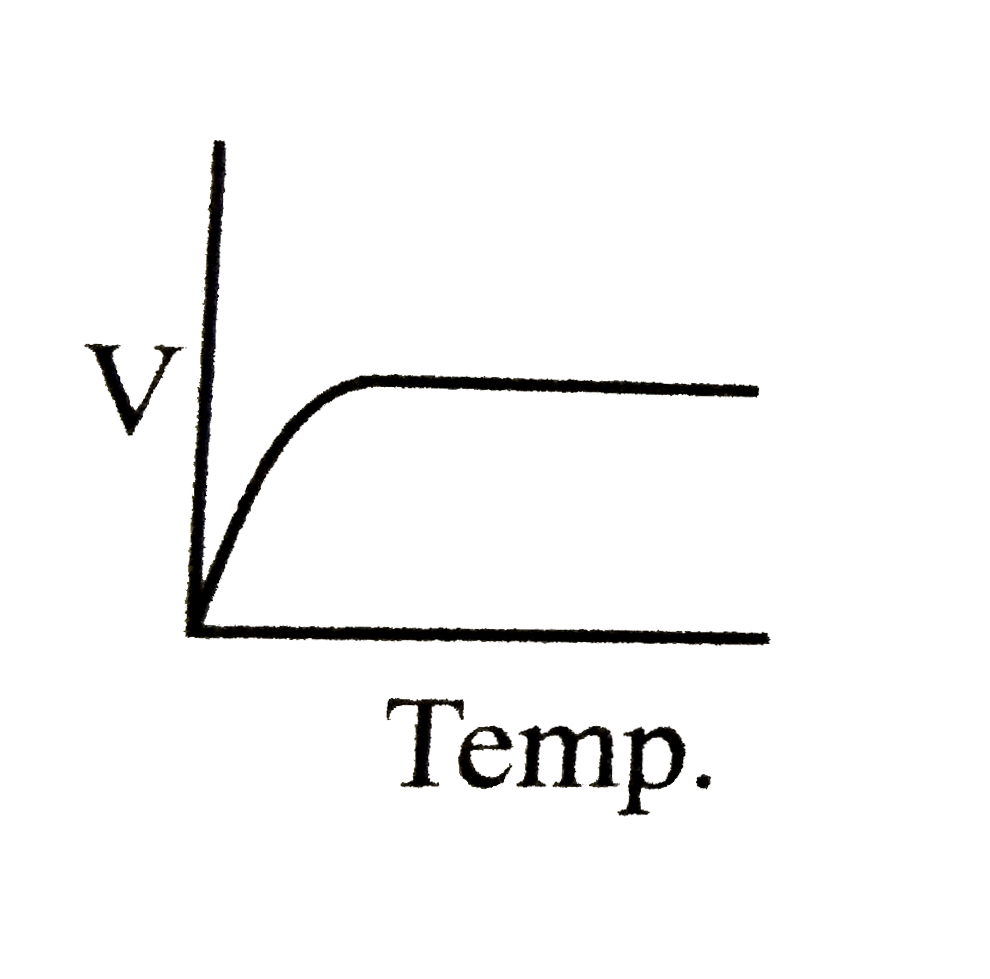
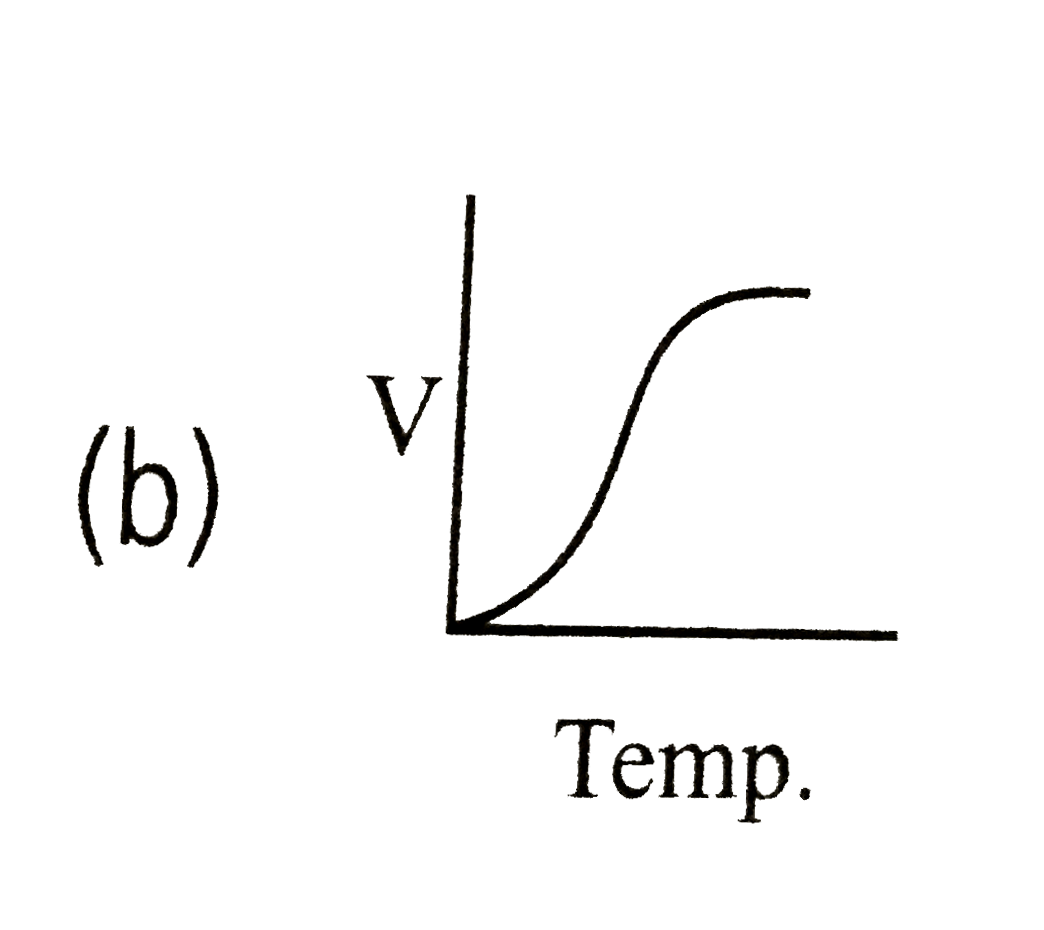
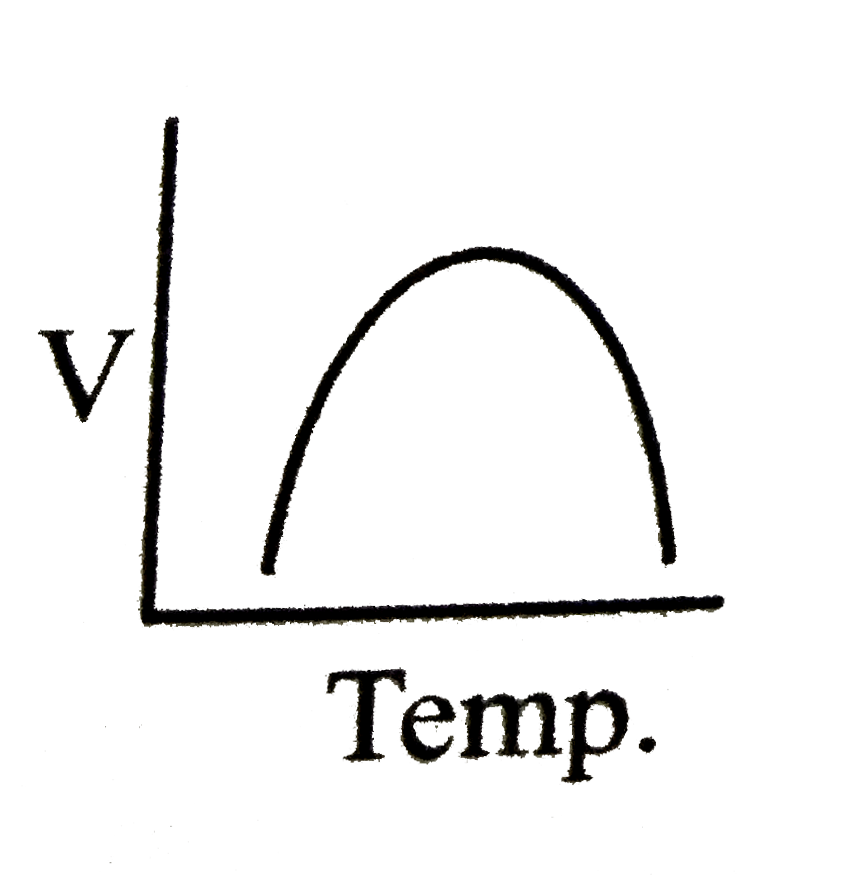
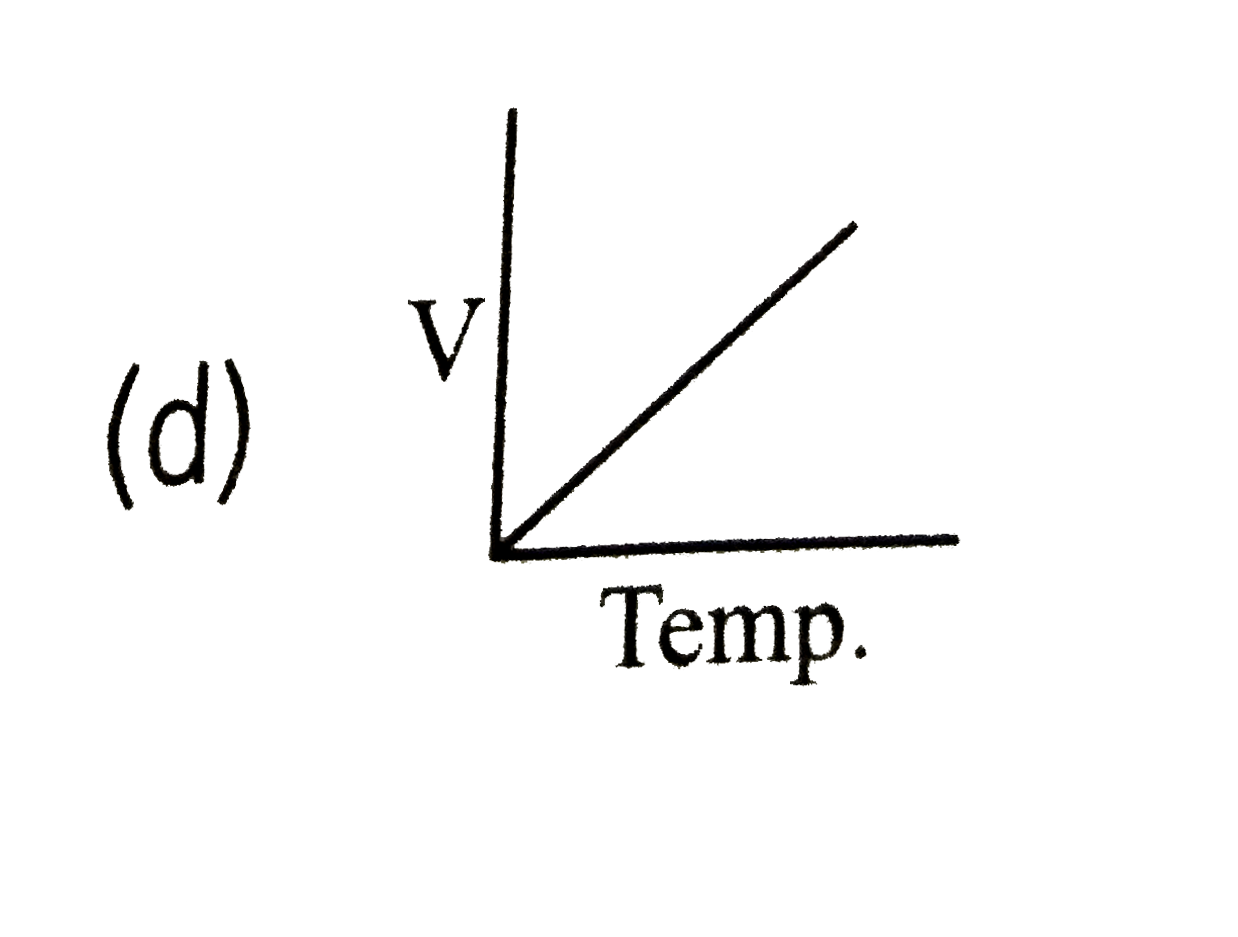
The correct Answer is:C
To determine which graph correctly represents the effect of temperature on the velocity of a typical enzymatic reaction, we can follow these steps:
1. Understanding Enzyme Activity: Enzymes are biological catalysts that speed up reactions. Their activity is influenced by various factors, including temperature.
2. Effect of Low Temperature: At low temperatures, enzyme activity is reduced. This is because the molecular motion is slower, leading to fewer collisions between enzymes and substrates. Therefore, the velocity of the reaction is low.
3. Optimum Temperature: As the temperature increases, the enzyme activity also increases up to a certain point known as the optimum temperature. At this temperature, the velocity of the enzymatic reaction reaches its maximum.
4. Effect of High Temperature: Beyond the optimum temperature, the enzyme begins to denature. Denaturation is a process where the enzyme's structure is altered, leading to a loss of function. As a result, the velocity of the reaction decreases.
5. Graph Representation: The graph that represents this relationship typically has a bell-shaped curve. It starts low at low temperatures, rises to a peak at the optimum temperature, and then falls again at high temperatures.
6. Conclusion: The correct graph will illustrate this bell-shaped curve, indicating that enzyme activity increases with temperature until it reaches a maximum at the optimum temperature, after which it declines due to denaturation.
Topper's Solved these Questions
Similar Questions
Knowledge Check
Which one of the graphs show the effect of temperature on the velocity of a typical enzymatic reaction?
A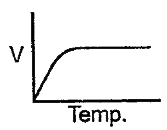 B
B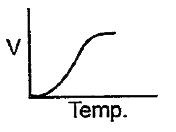 C
C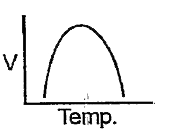 D
D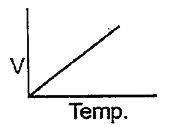
Which graph represents the effect of pHk/temp on the velocity of a typical enzymatic reaction (V)
A B
B C
C D
D
The effect of temperature on reaction rate is given by
AClausius Clapeyron equationBArrhenius equationCGibb's Helmholtz equationDKirchoff's equation
Which one of the graphs shows the effect of pH on the velocity of a typical enzymatic reaction (V)?
View SolutionWhat is the effect of temperature on reaction rate?
View SolutionWhat is the effect of temperature on the rate of a reaction.
View SolutionDiscuss the effect of temperature and density on the velocity of sound in air.
View SolutionThe effect of temperature on the rate constant of a reaction is given by
View Solution
