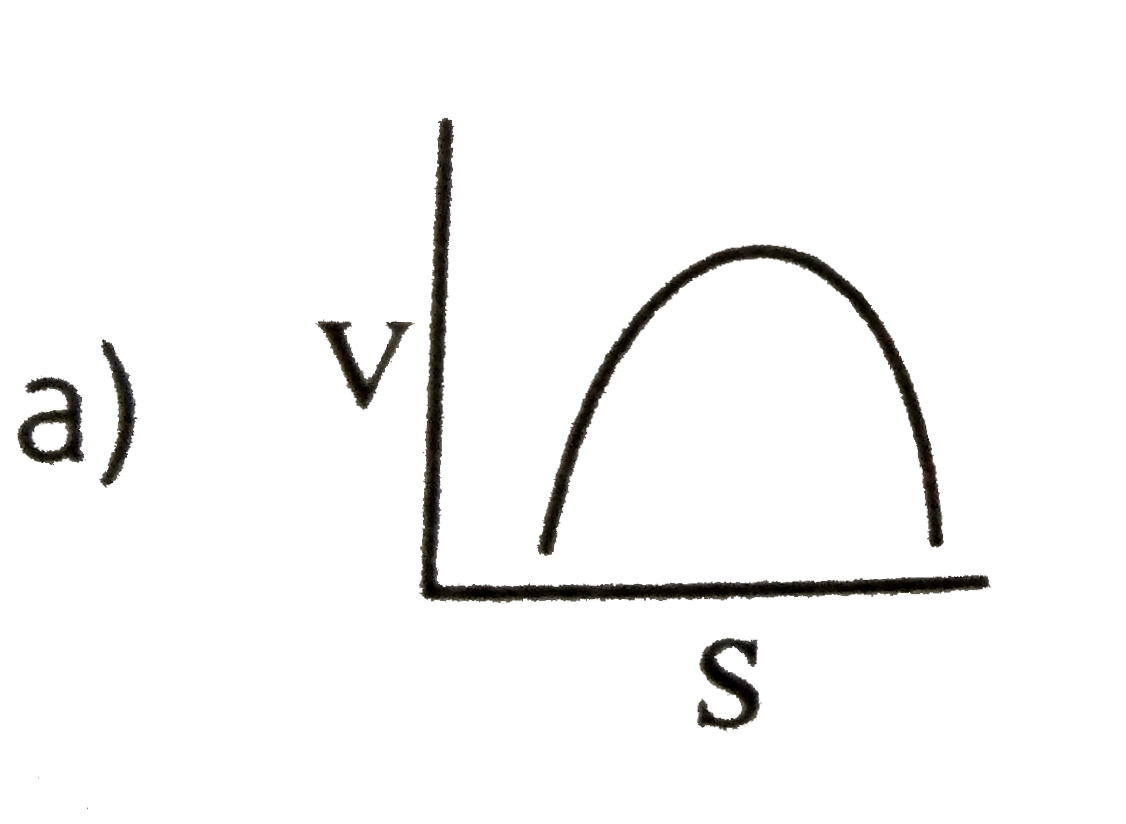
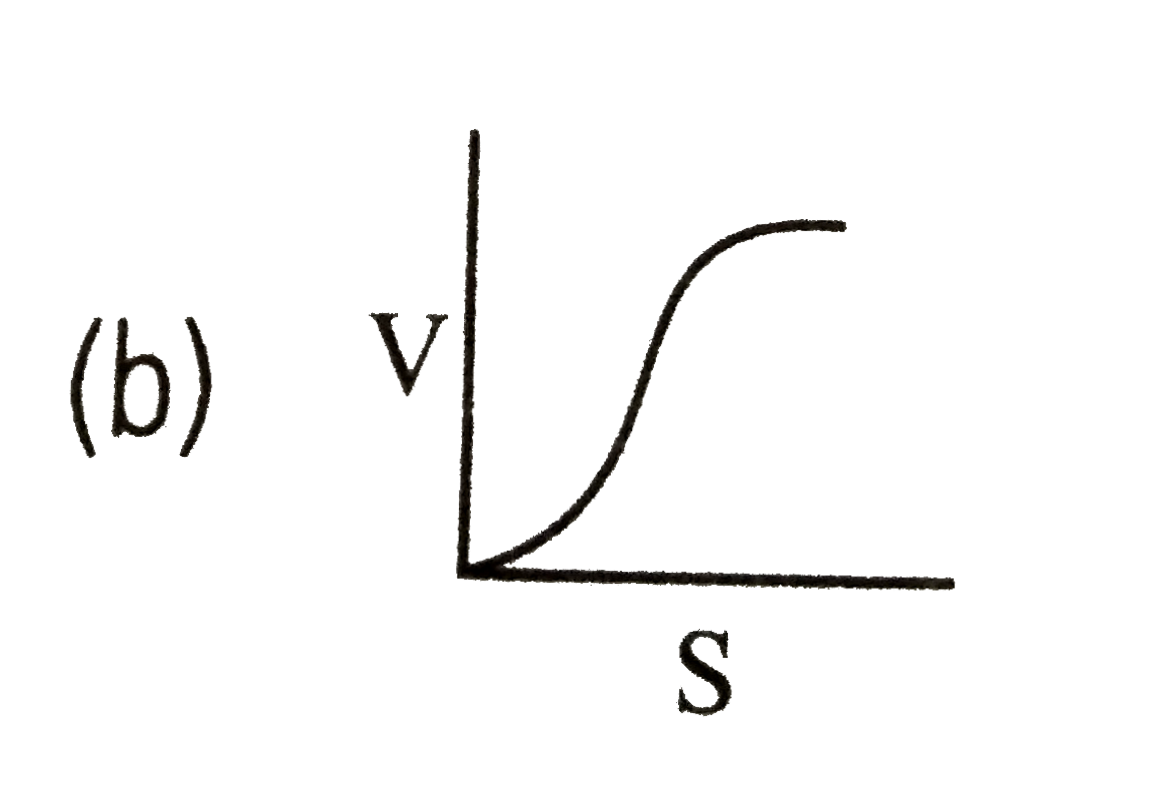
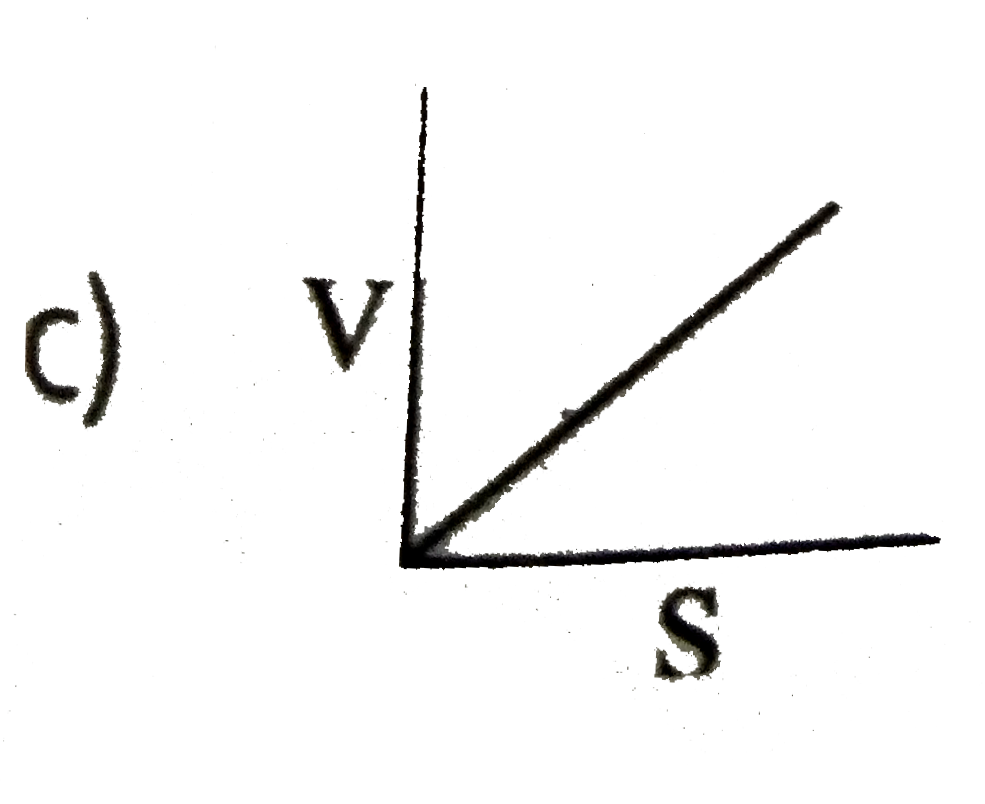
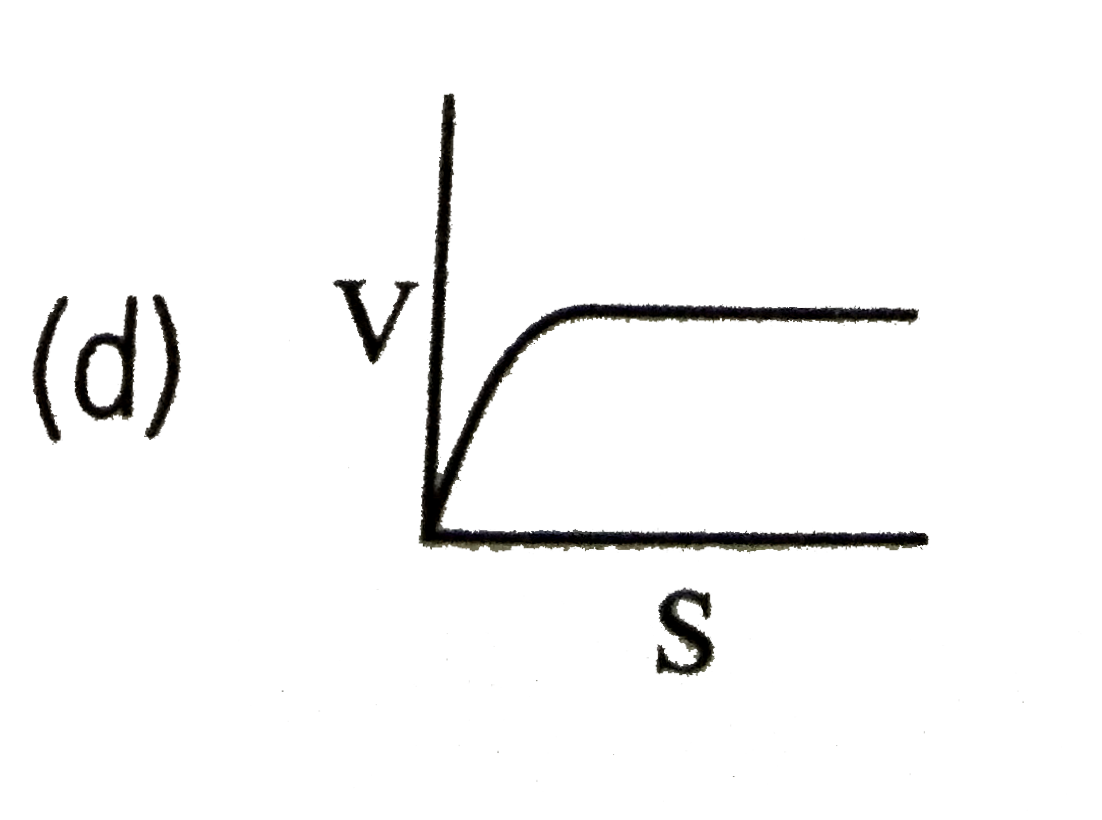
Which of the following graphs shows the relationship between the rate of an enzymatic activity and substrate concentration (S) ?
A
B
C
D
Video Solution
Text Solution
The correct Answer is:D
Increase in substrate concentration increases the rate of reaction due to two factors: (i) occupation of more and more active sites by the substrate molecules, (ii) higher number of collisions between substrate molecules. The rise in velocity is quite high in the beginning but it decreases progressively with the increase in substate concentration. If a graph is plotted for substrate concentration versus reaction velocity, it appears as a hyperbolic curve. A stage is reached where velocity is maximum. It does not increase further by increasing the substrate concentration. At this stage the anzyme molecule becomes fully saturated and no active site is left free to bind additional substrate molecules.
|
Topper's Solved these Questions
Similar Questions
Knowledge Check
Which of the following graphs shows the relationship between the rate of an enzymatic activity and substrate concentration (S) ?
A B
B C
C D
D
Which one of the following graphs show the relationship between the rate of an enzymatic activity and substrate conc(S) -
A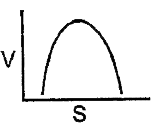 B
B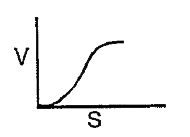 C
C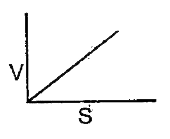 D
D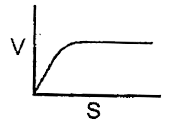
Which of the following shows diagonal relationship ?
ABoron and siliconBBoron and aluminiumCBoron and galliumDBoron and carbon
Which of the following pairs show diagonal relationship?
View SolutionWhich of the following graphs shows the correct description of effect of pH on enzyme activity?
View SolutionWhich of the following graphs shows variation between density of water and temperature?
View SolutionWhich of the following pairs shows prey-predator relationship?
View SolutionWhich of the following pairs shows prey-predator relationship?
View Solution
