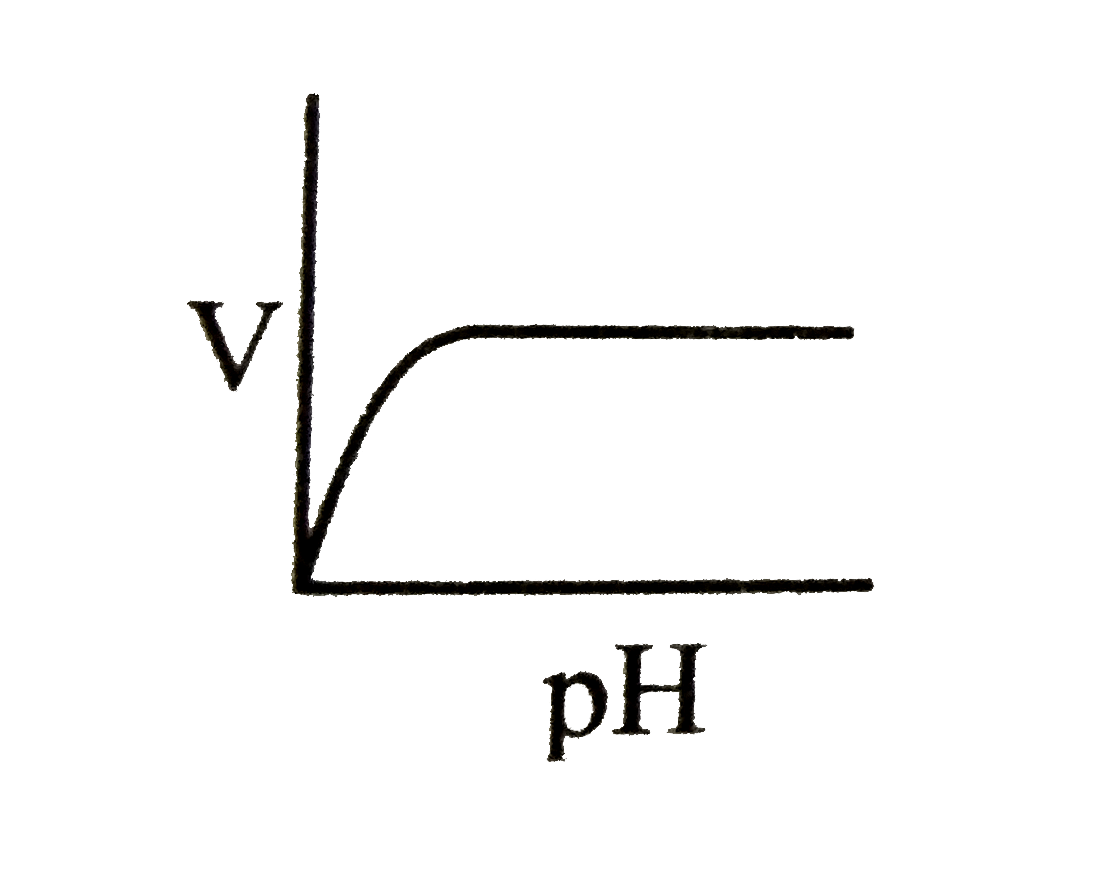
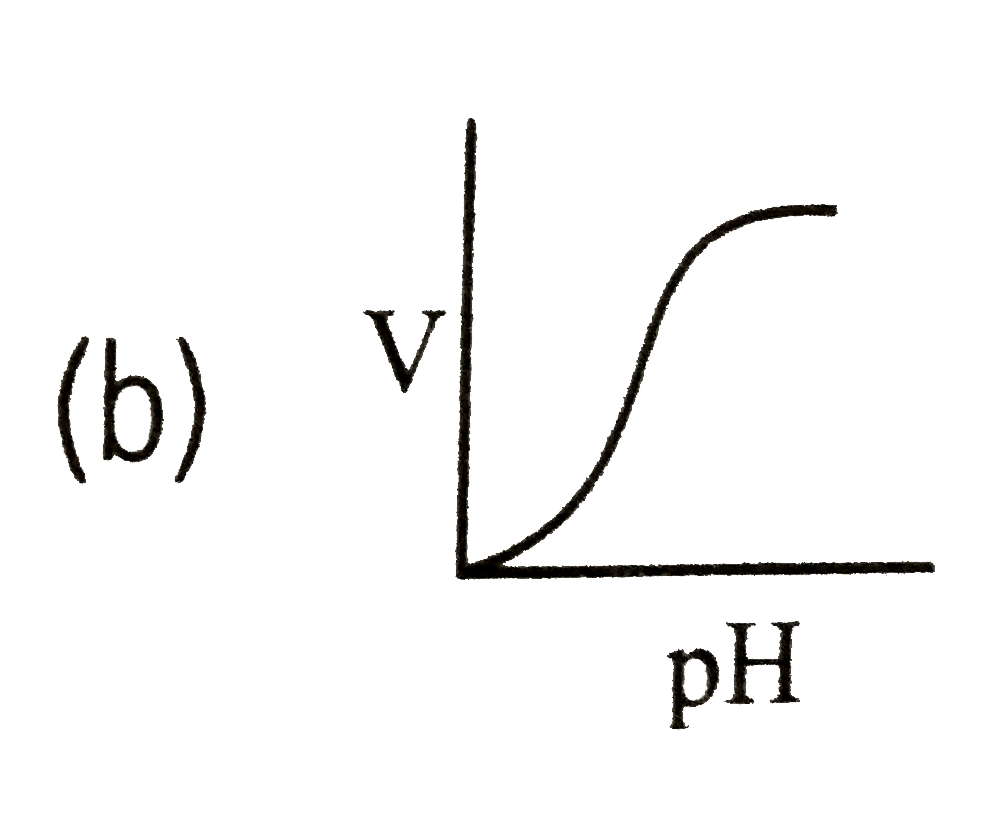
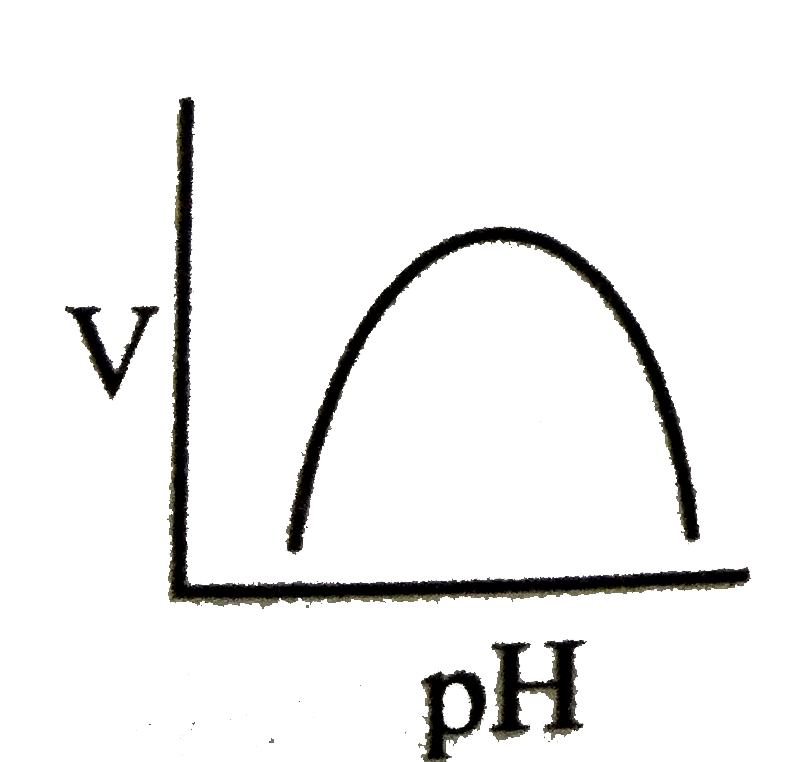
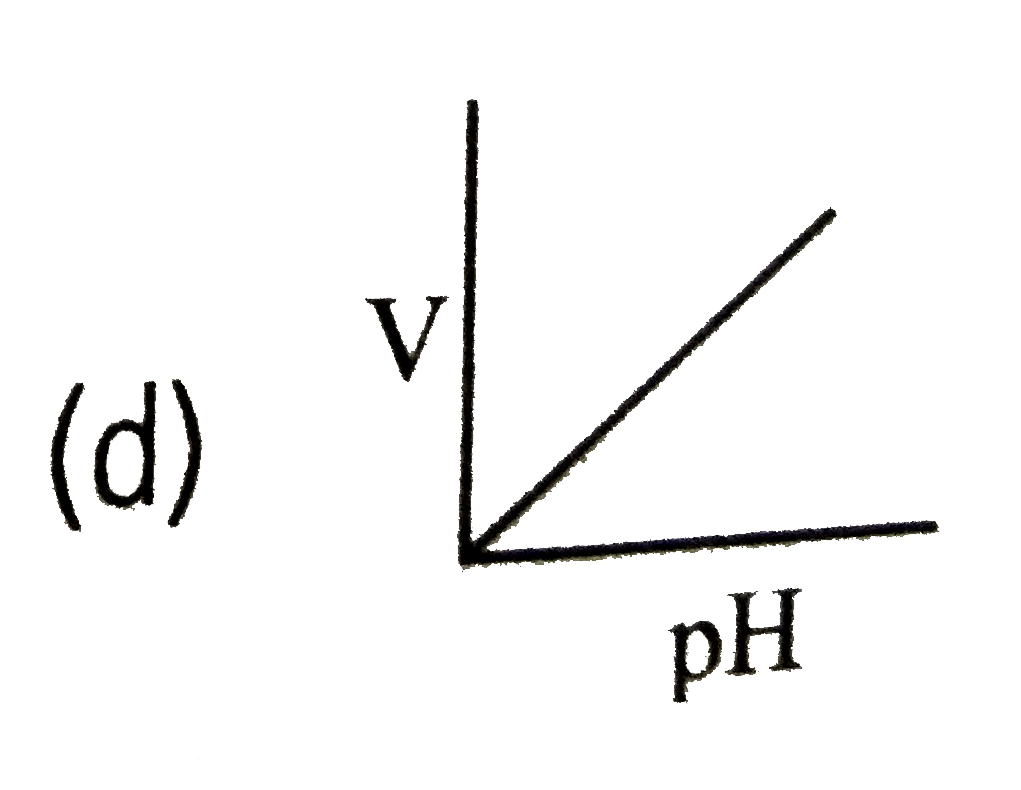
Which one of the given graphs shows the effect of pH on the velocity of a typical enzymatic reaction (V) ?
A
B
C
D
Video Solution
Text Solution
The correct Answer is:C
|
Answer
Step by step video, text & image solution for Which one of the given graphs shows the effect of pH on the velocity of a typical enzymatic reaction (V) ? by Biology experts to help you in doubts & scoring excellent marks in Class 11 exams.
Updated on:21/07/2023
Topper's Solved these Questions
Similar Questions
Knowledge Check
- Question 1 - Select One
Which one of the graphs show the effect of temperature on the velocity of a typical enzymatic reaction?
A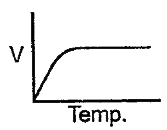 B
B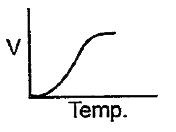 C
C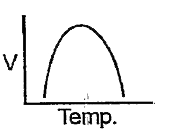 D
D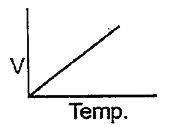
- Question 2 - Select One
Which graph represents the effect of pHk/temp on the velocity of a typical enzymatic reaction (V)
A B
B C
C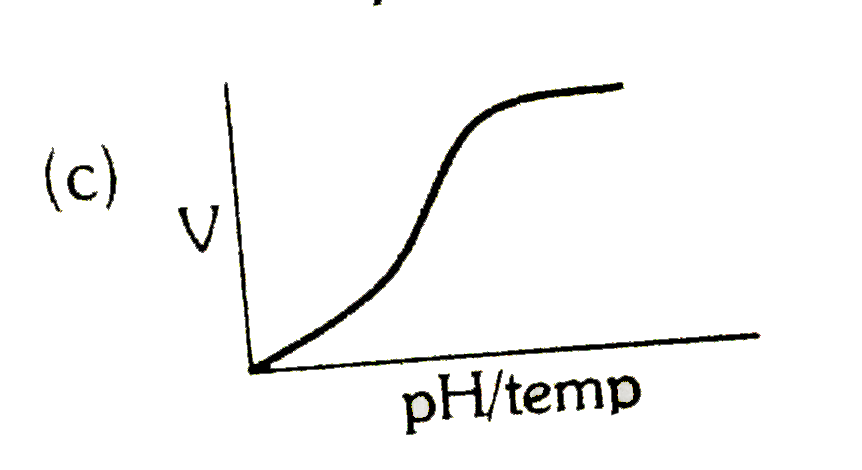 D
D
- Question 3 - Select One
Which of the following graphs shows the relationship between the rate of an enzymatic activity and substrate concentration (S) ?
A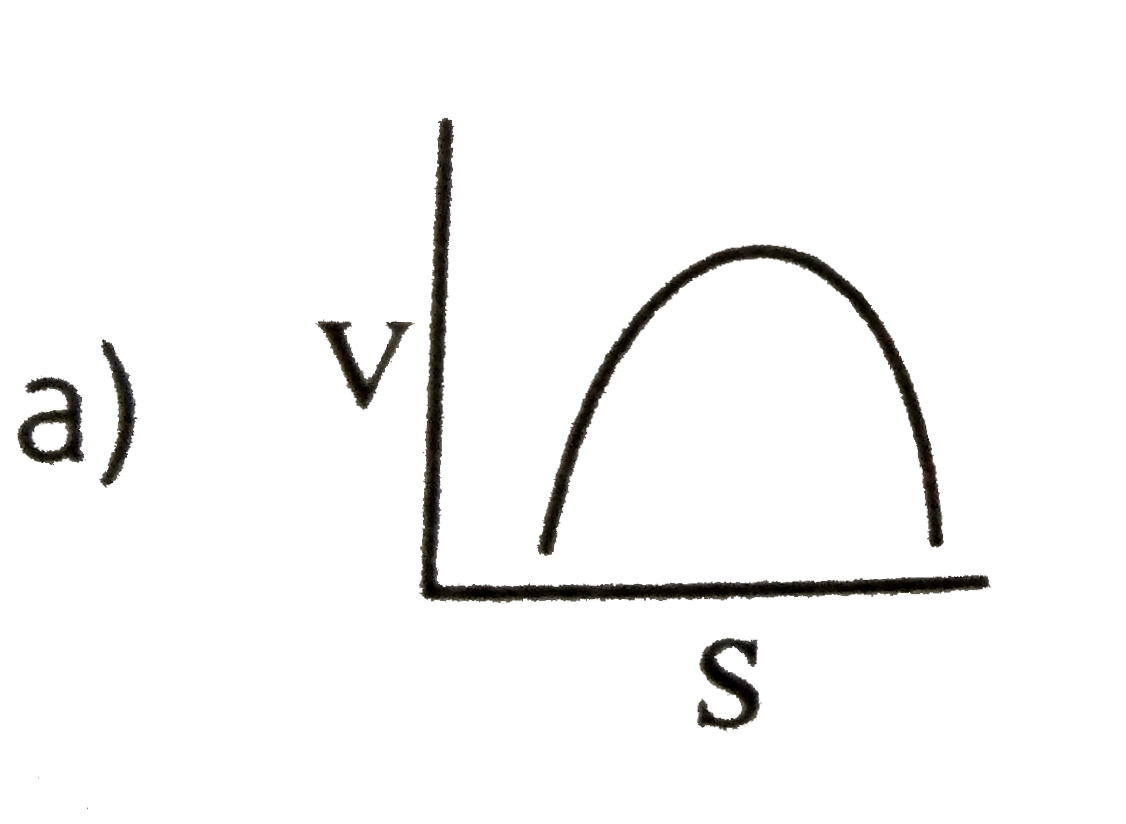 B
B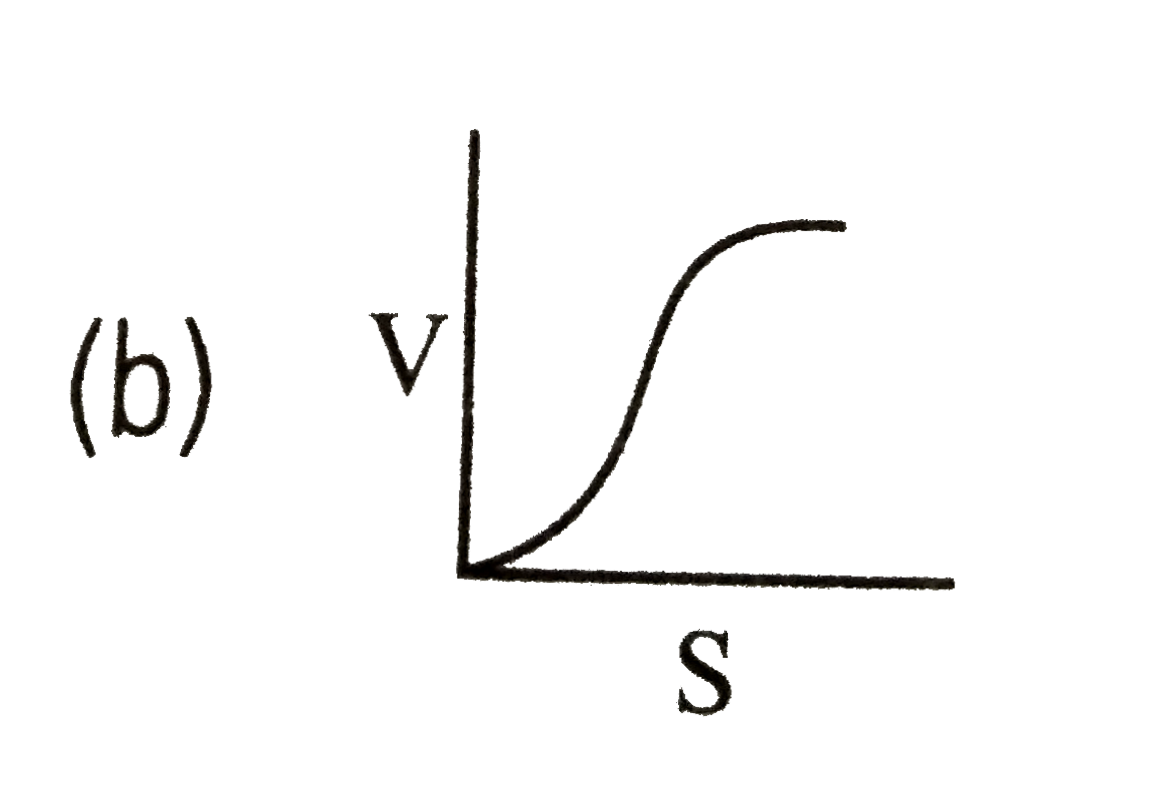 C
C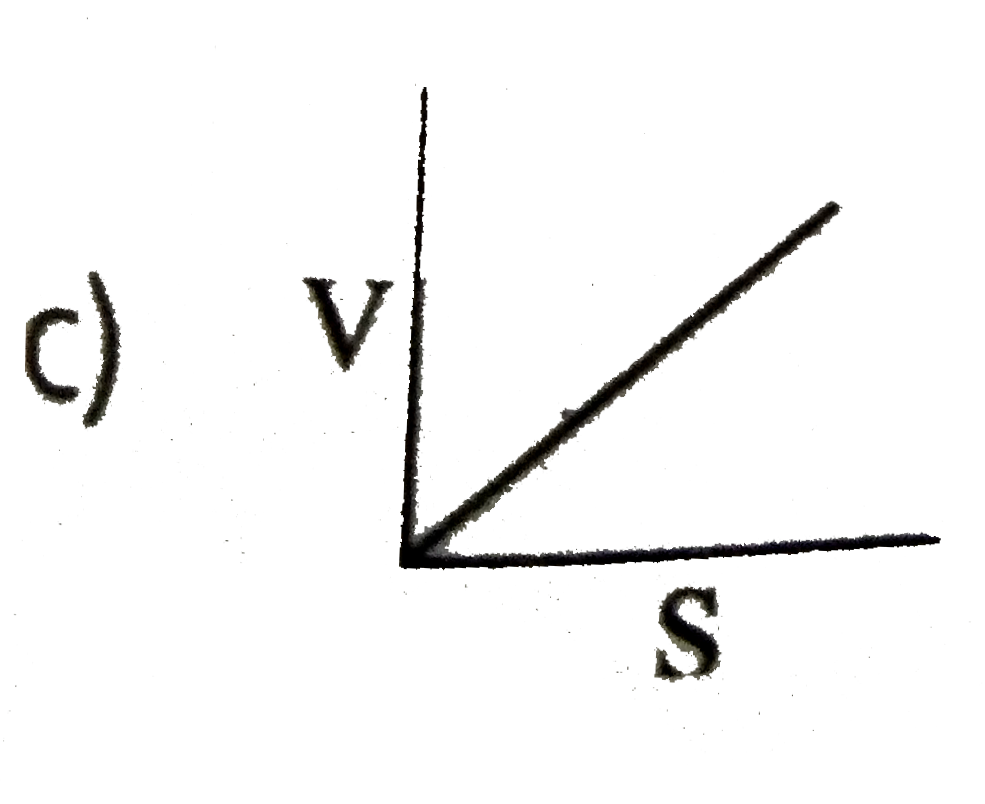 D
D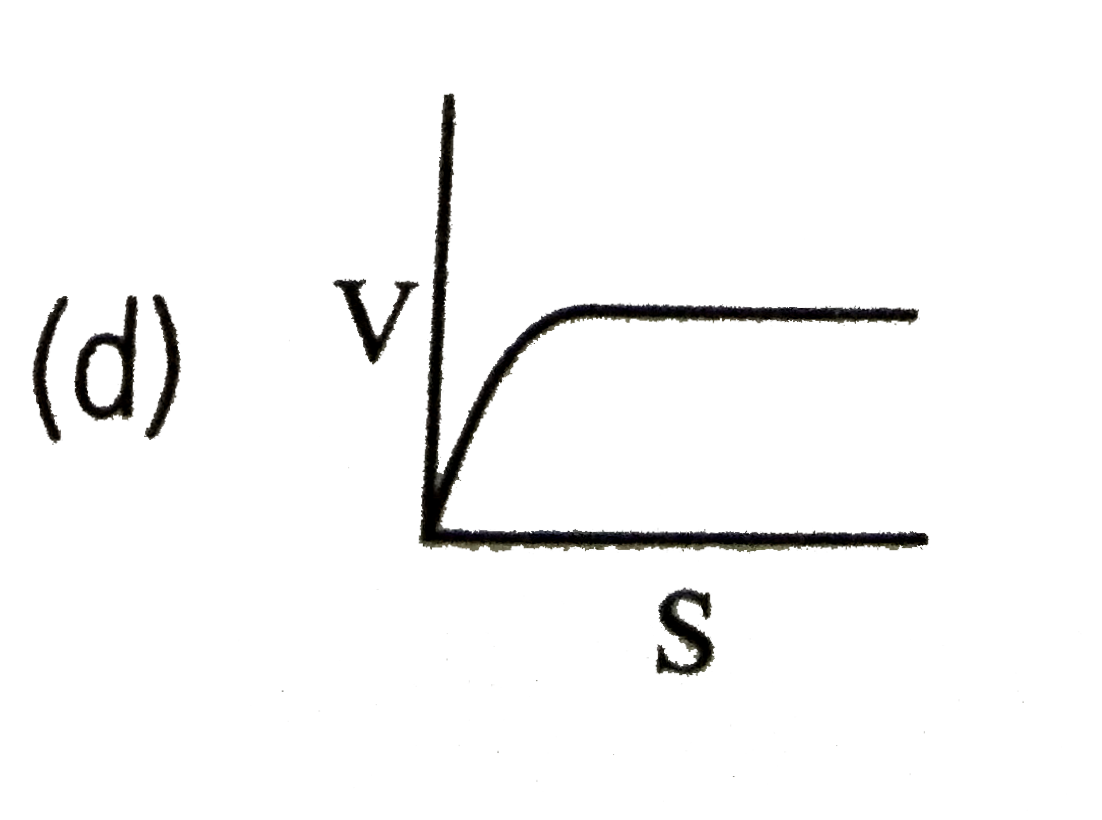
Which one of the given graphs shows the effect of temperature on the velocity of a typical enzymatic reaction ?
View SolutionWhich one of the following graphs show the relationship between the rate of an enzymatic activity and substrate conc(S) -
View SolutionWhich one decribes the given graph correctly
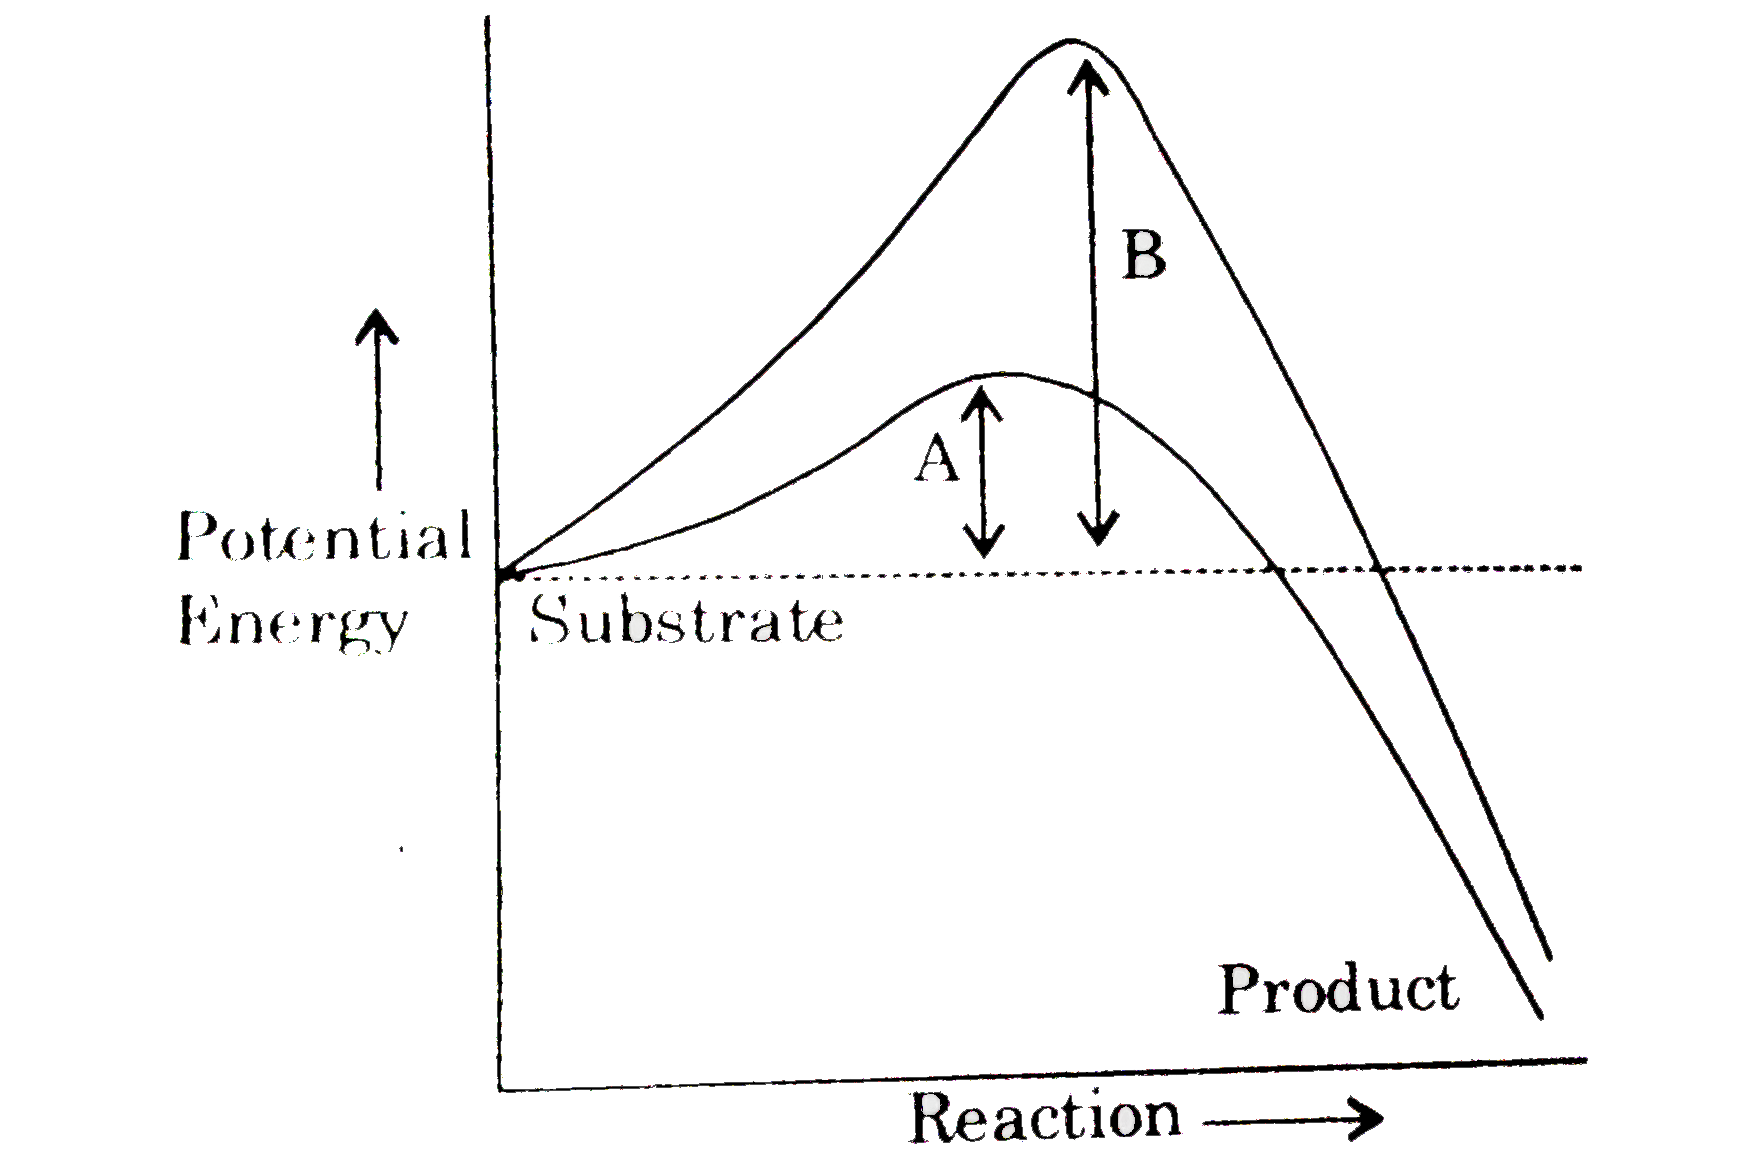 View Solution
Which of the following graphs shows the relationship between the rate of an enzymatic activity and substrate concentration (S) ?
View SolutionWhich of the following graphs shows the correct description of effect of pH on enzyme activity?
View Solution
