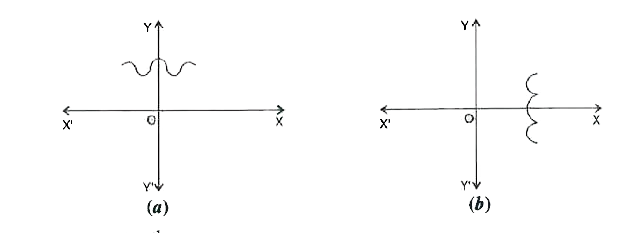
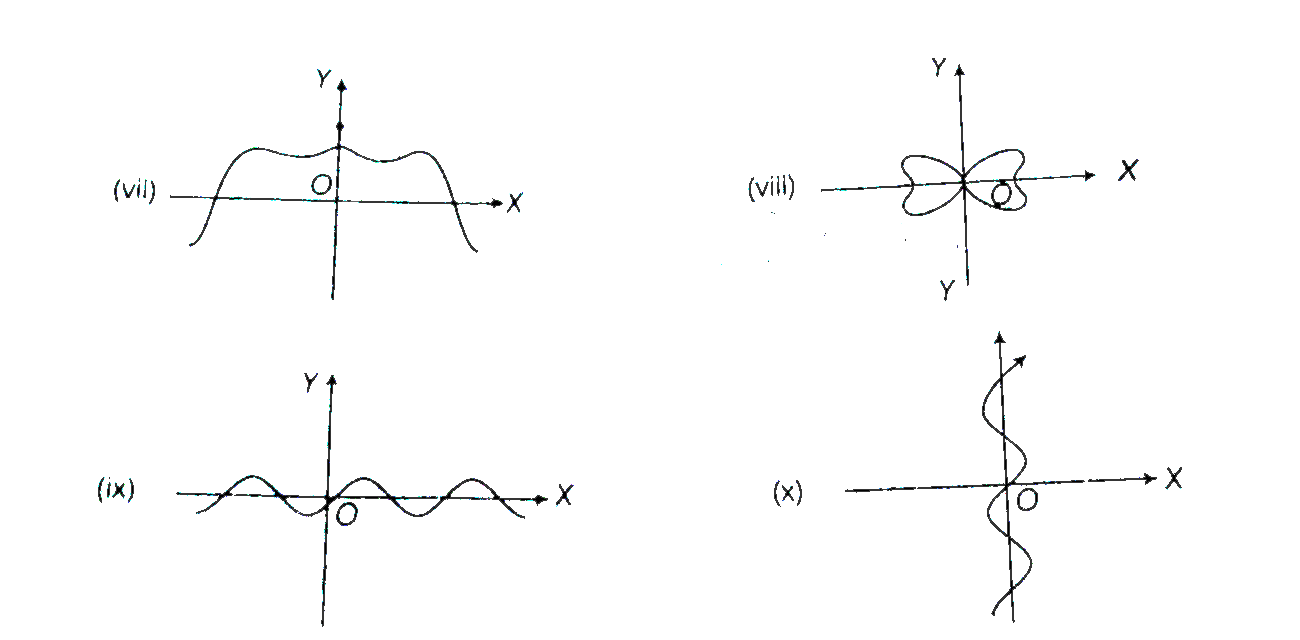
Which of the following graphs represent function whose derivatives have a maximum in the interval (0,1) ?
A
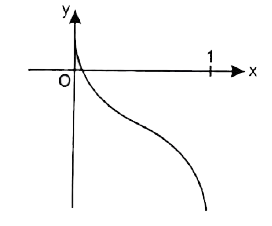
B
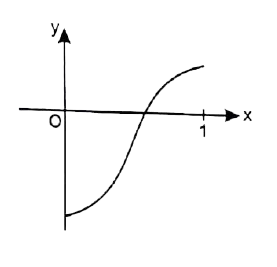
C
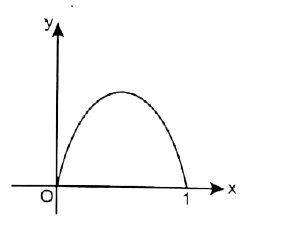
D
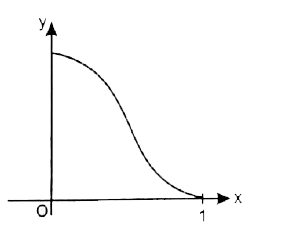
Video Solution
Text Solution
The correct Answer is:A, B
|
Answer
Step by step video, text & image solution for Which of the following graphs represent function whose derivatives have a maximum in the interval (0,1) ? by Maths experts to help you in doubts & scoring excellent marks in Class 12 exams.
Updated on:21/07/2023
Topper's Solved these Questions
- BOOK - VIKAS GUPTA (BLACK BOOK)CHAPTER - APPLICATION OF DERIVATIVES EXERCISE - EXERCISE (COMPREHENSION TYPE PROBLEMS)16videos
APPLICATION OF DERIVATIVES
- BOOK - VIKAS GUPTA (BLACK BOOK)CHAPTER - APPLICATION OF DERIVATIVES EXERCISE - EXERCISE (MATHCING TYPE PROBLEMS)1videos
APPLICATION OF DERIVATIVES
- BOOK - VIKAS GUPTA (BLACK BOOK)CHAPTER - APPLICATION OF DERIVATIVES EXERCISE - EXERCISE (SUBJECTIVE TYPE PROBLEMS)22videos
APPLICATION OF DERIVATIVES
- BOOK - VIKAS GUPTA (BLACK BOOK)CHAPTER - AREA UNDER CURVESEXERCISE - AXERCISE (SUBJECTIVE TYPE PROBLEMS)8videos
AREA UNDER CURVES
Similar Questions
Knowledge Check
- Question 1 - Select One
Which of the following graph is correctly represented?
A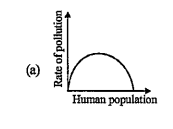 B
B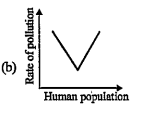 C
C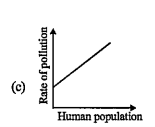 D
D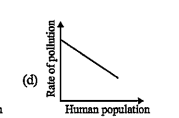
- Question 2 - Select One
What is the range of the function f(x)=|x|x,x≠0?
A B
B C
C Dnone of above
 - Question 3 - Select One
Which one the following graph represents the function
f(x)=xx,x≠0?A B
B C
C DNone of the above
Which one of the following graphs represents the function of x? why?
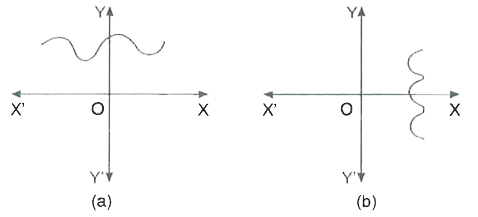 View Solution
Does the following graph represent a function or a relation?
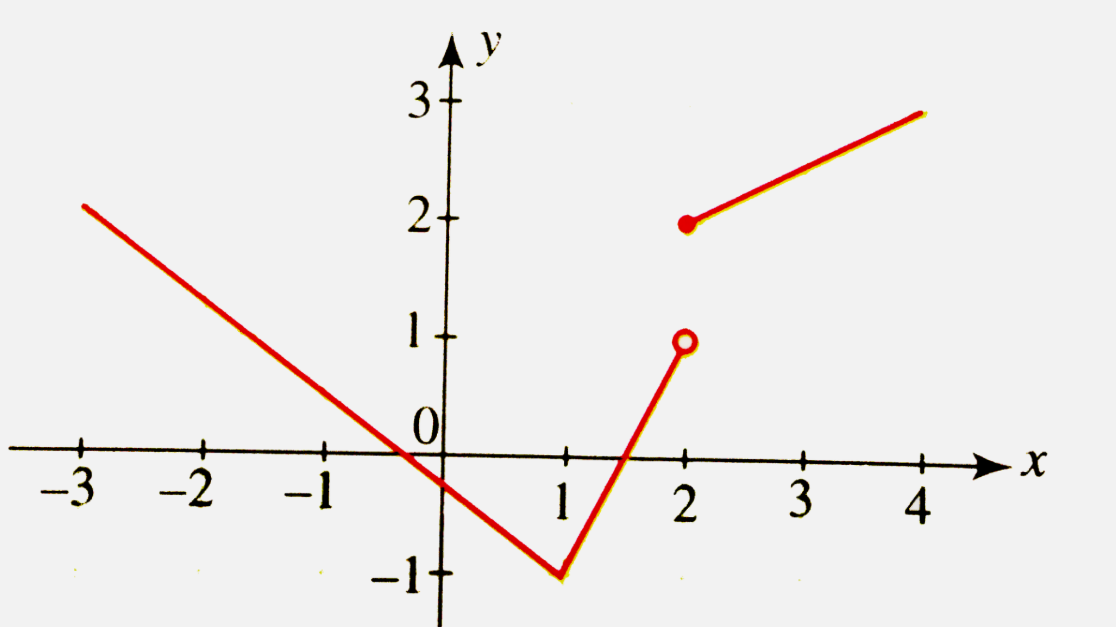 View Solution
Which of the following graphs are graphs of a function?
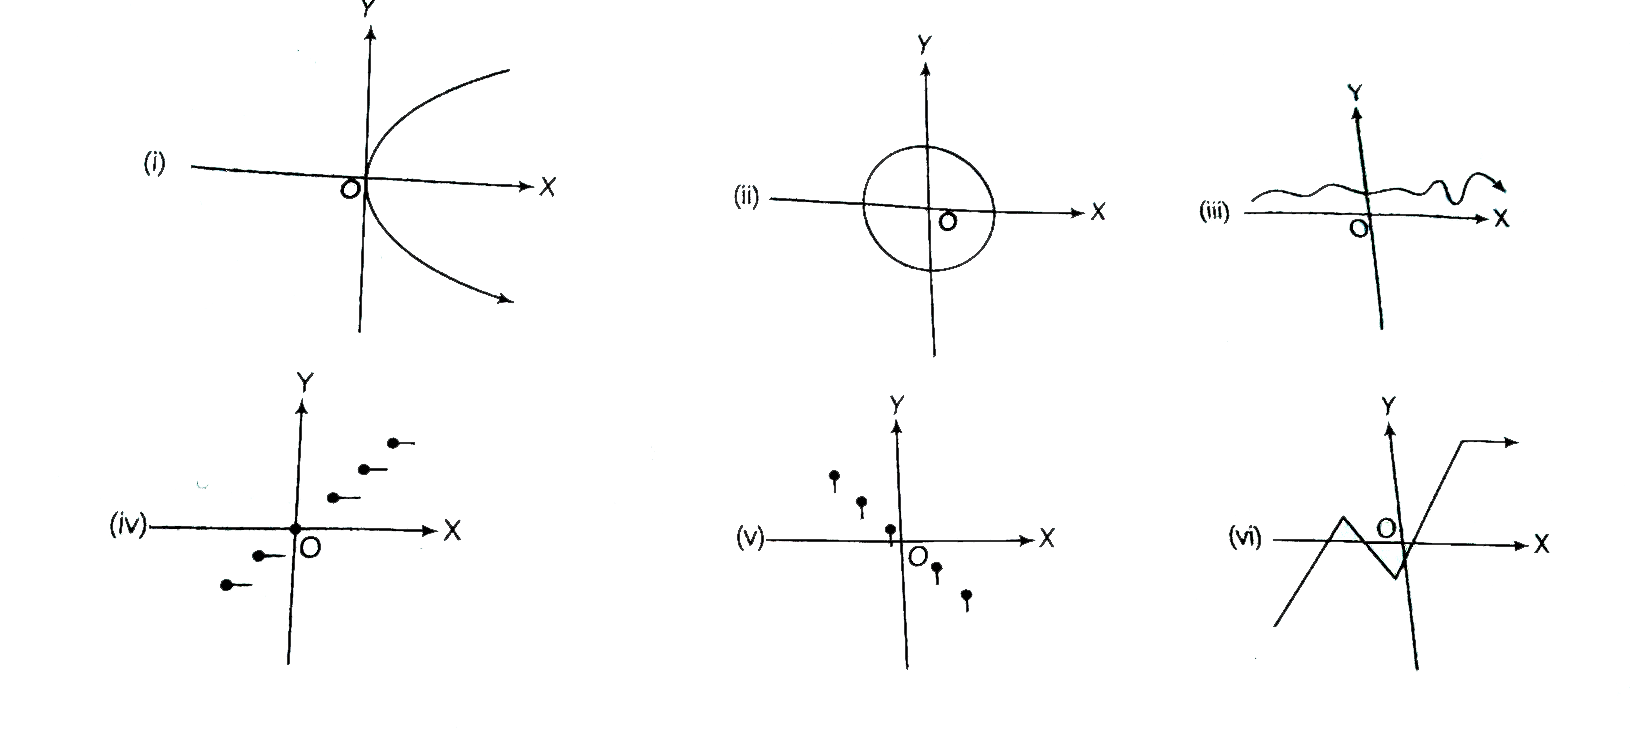
 View Solution
Does the following graph represent a function? Justify your answer.
View SolutionWhich of the following pair of functions have the same graph ?
View Solution


