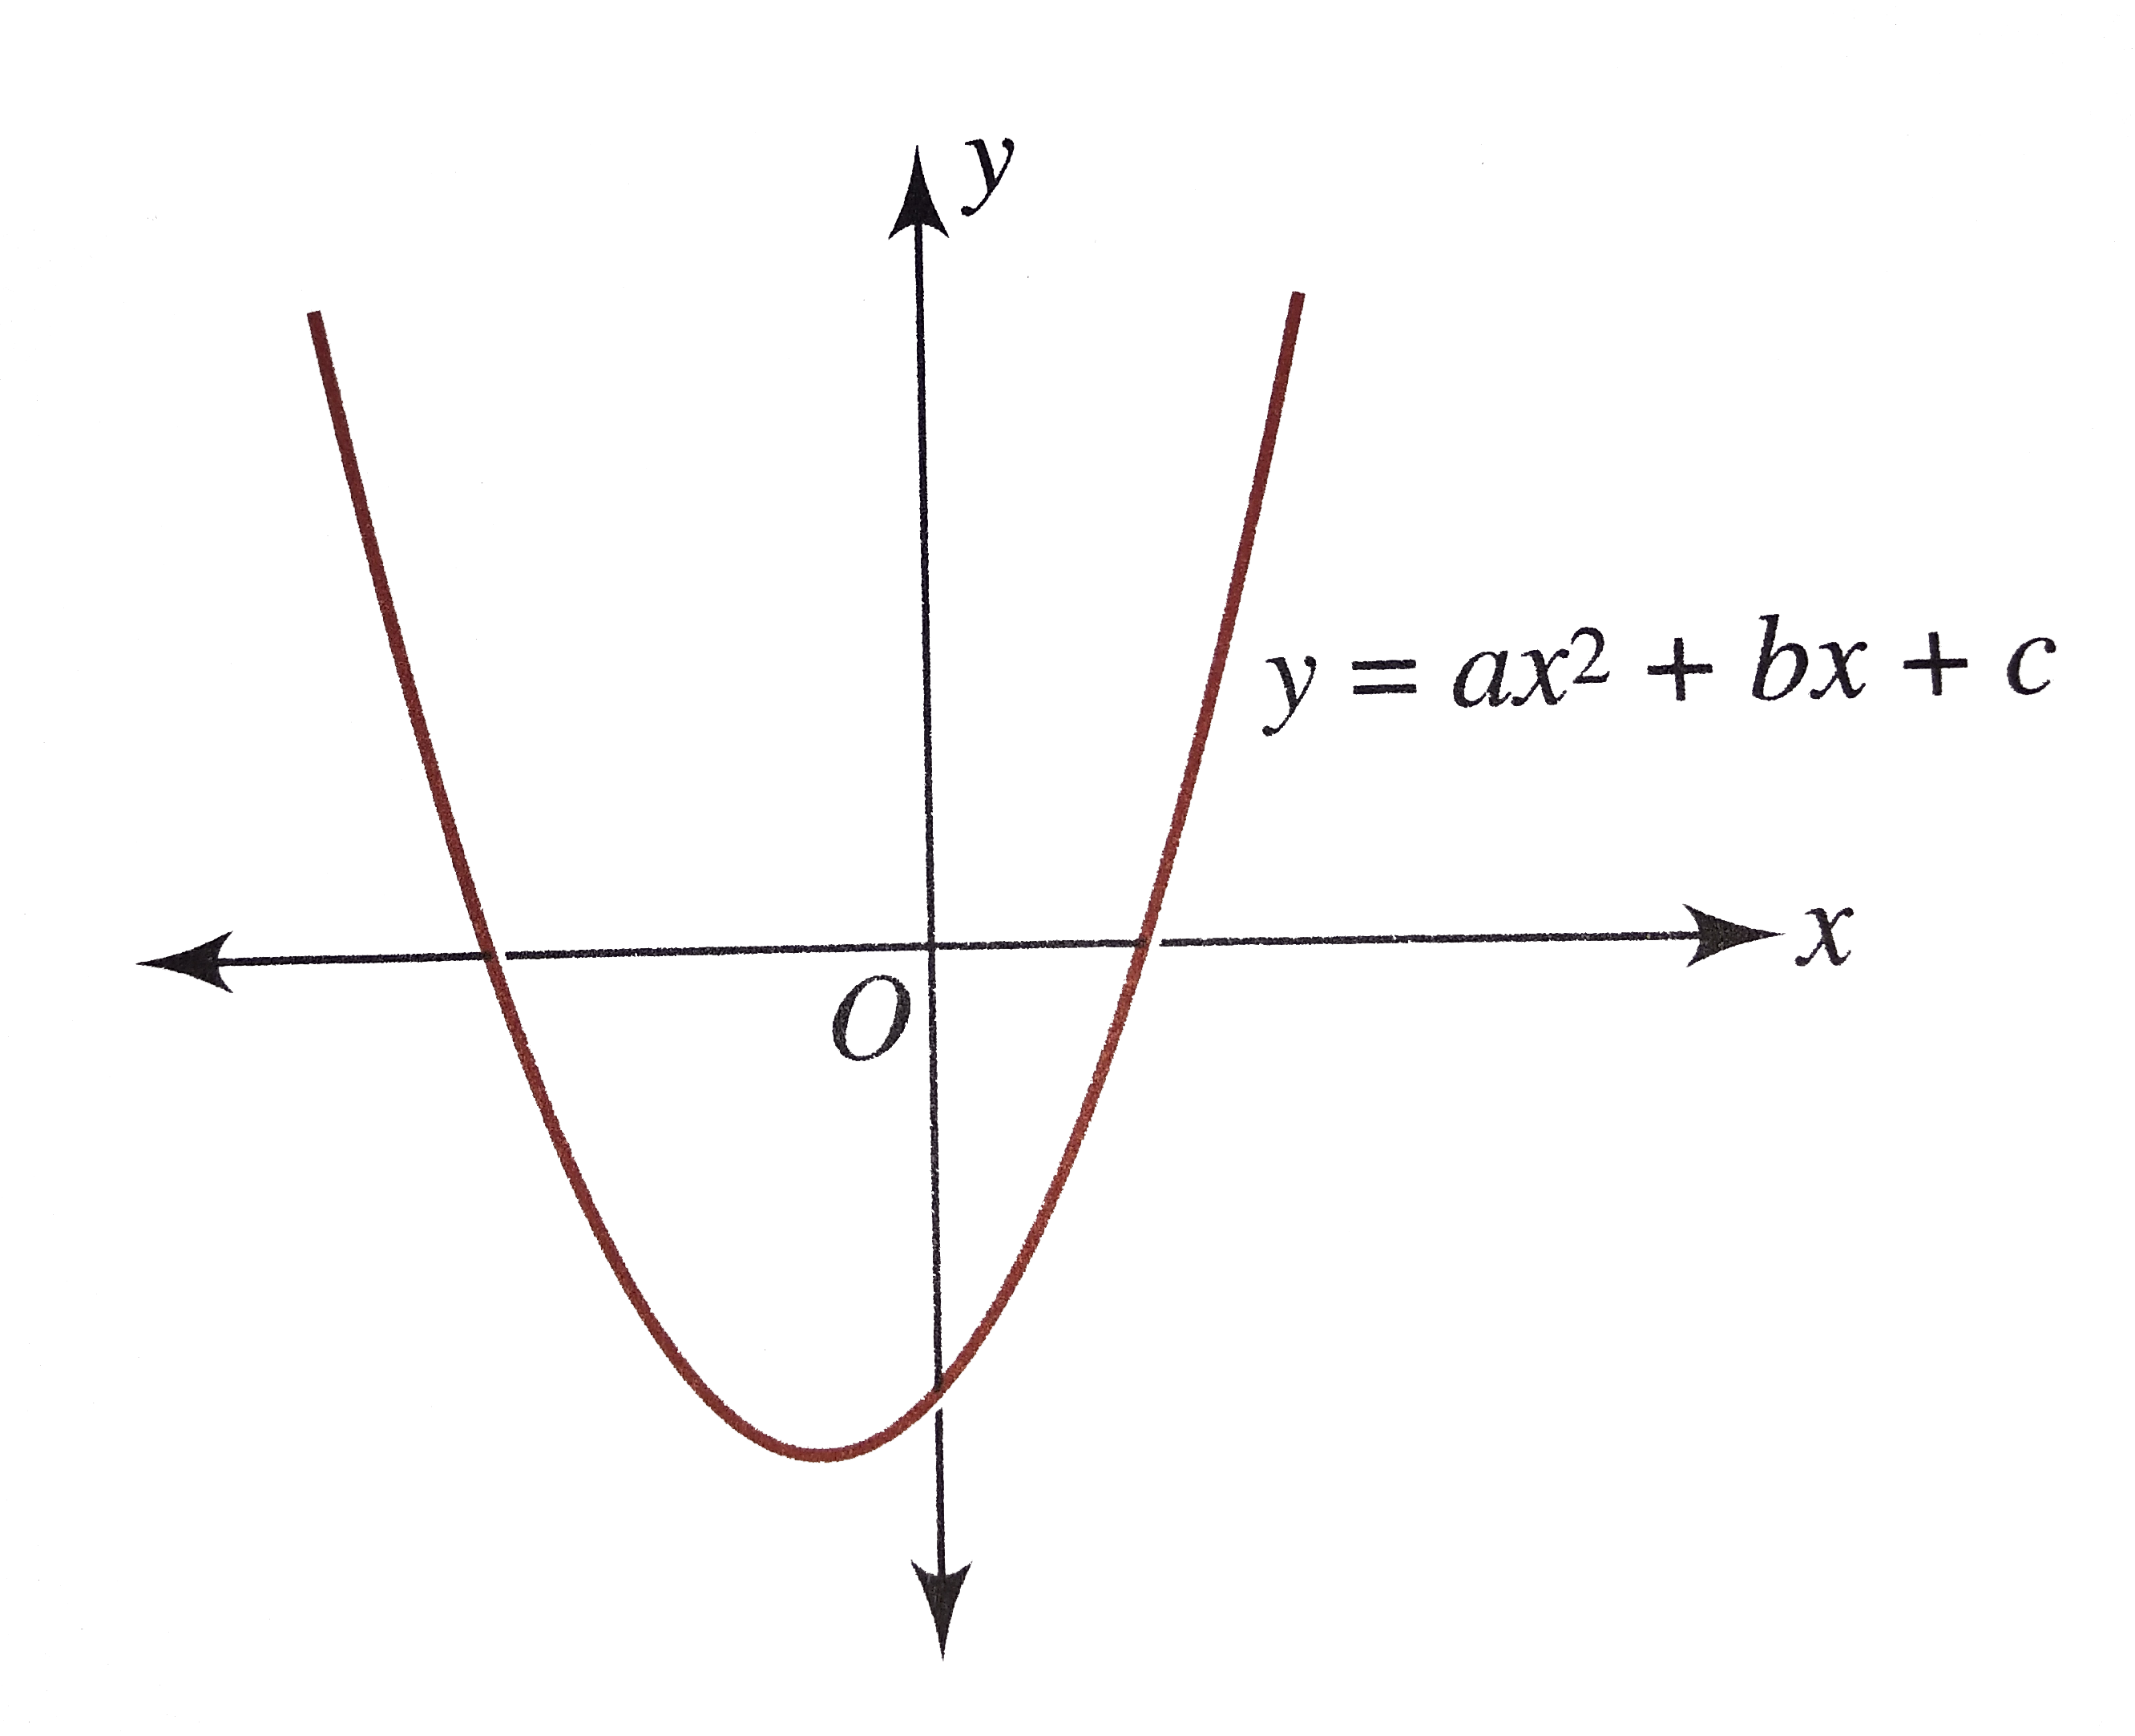
The graph of the polynomial f(x)=ax2+bx+c is as shown below (Fig. 2.19). Write the signs of 'a' and b2−4ac . FIGURE
Step by step video & image solution for The graph of the polynomial f(x)=a x^2+b x+c is as shown below (Fig. 2.19). Write the signs of ' a ' and b^2-4a c . FIGURE by Maths experts to help you in doubts & scoring excellent marks in Class 10 exams.
Updated on:21/07/2023Topper's Solved these Questions
Similar Questions
The graph of quadratic polynomical f(x)=ax2+bx+c is shown below

View SolutionDraw the graph of the polynomial f(x)=x^2-2
View SolutionDraw the graph of the polynomial f(x)=x2−6x=9.
View SolutionDraw the graph of the polynomial f(x)=2x2−4x+5.
View SolutionThe graph of a polynomial f(x) is as shown in Fig. 2.21. Write the number of real zeros of f(x) . (FIGURE)
View SolutionThe graph of the polynomial f(x)=ax2+bx+c is as shown in Fig. 2.20. Write the value of b2−4ac and the number of real zeros of f(x) . (FIGURE)
View SolutionThe graph of the quadratic polynomial y=ax2+bx+c is as shown in the figure.Then
View SolutionThe graph of a polynomial y=f(x) , shown in Fig. 2.18. Find the number of real zeros of f(x) . (FIGURE)
View SolutionIn Fig. 4.109, express x in terms of a, b and c . (FIGURE)
View SolutionThe following figure shows the graph of f(x)=ax2+bx+c, then find the sign of values of a,bandc.

View Solution
