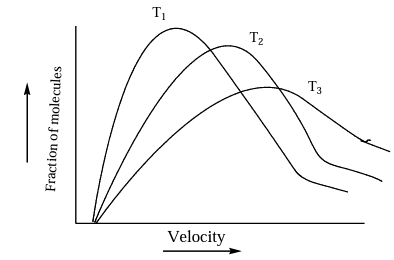
According to Maxwell Boltzmann distribution of energy
the fraction of molecules with most probable kinetic energy decreases at higher temperatures
the fraction of molecules with most probable kinetic energy increases at higher temperatures
most probable kinetic energy increases at higher temperatures
most probable kinetic energy decreases at higher temperatures.
The correct Answer is:A, C
Step by step video, text & image solution for According to Maxwell Boltzmann distribution of energy by Chemistry experts to help you in doubts & scoring excellent marks in Class 12 exams.
Topper's Solved these Questions
- BOOK - PRADEEPCHAPTER - CHEMICAL KINETICSEXERCISE - NCERT EXEMPLAR PROBLEMS WITH ANSWERS, HINTS AND SOLUTTIONS (SHORT ANSWER QUESTIONS)20videos
CHEMICAL KINETICS
- BOOK - PRADEEPCHAPTER - CHEMICAL KINETICSEXERCISE - NCERT EXEMPLAR PROBLEMS WITH ANSWERS, HINTS AND SOLUTTIONS (MATCHING TYPE QUESTIONS)3videos
CHEMICAL KINETICS
- BOOK - PRADEEPCHAPTER - CHEMICAL KINETICSEXERCISE - NCERT EXEMPLAR PROBLEMS WITH ANSWERS, HINTS AND SOLUTTIONS (MULTIPLE CHOICE QUESTIONS-1)20videos
CHEMICAL KINETICS
- BOOK - PRADEEPCHAPTER - BIOMOLECULES EXERCISE - IMPORTANT QUESTIONS (FOR BOARD EXAMINATION)25videos
BIOMOLECULES
- BOOK - PRADEEPCHAPTER - CHEMISTRY IN EVERYDAY LIFE EXERCISE - IMPORTANT QUESTION FOR BOARD EXAMINATION30videos
CHEMISTRY IN EVERYDAY LIFE
Similar Questions
Knowledge Check
- Question 1 - Select One or More
According to Maxwell , Boltzmann distriubtion of energy ……… .
Athe fraction of moleucles with most probable kinetic enegy decreases at higher temperaturesBthe fraction of moleucles with most probable kinetic enegy increases at higher temperaturesCmost probable kinetic energy increases at higher temperatureDmost probable kinetic energy decreases at higher temperature - Question 2 - Select One or More
In the graph showing Maxwell Boltzmann distribution of energy ................ .
Aarea under the curve increases with increase in temperatureBarea under the curve decreases with increase in temperatureCwith increase in temperature curve broadens and shifts to the right hand side.Das a gas cools to a lower temperature, the peak of the graph shifts to the left - Question 3 - Select One or More
In the graph showing Maxwell, Boltzmann distribution of energy ……….. .
Aarea under the curves must not change with increase in temperatureBarea under the curve increase with increase in temperatureCarea under the curve decrease with increase in temperatureDwith increase in temperature curve boradens and shifts to the right hand side
In the graph showing Maxwell Boltzmann distribution of energy ................ .
View SolutionThe maximum in the curves describing the Maxwell-Boltzmann distribution of speeds corresponds to
View SolutionAssertion : In Maxwell - Boltzmann distribution of speeds , the curve broadens at higher temperature .
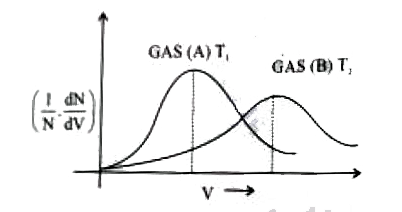
Reason : At a particular temperature , the individual speed of molecules as well as the distribution of speeds remains the same .View SolutionAccording to Maxwell.s distribution of molecular speeds, for the below graph drawn for two different samples of gases A and B al temperature T1 and T2 respectively, which of the following statements in are incorrect?
 View Solution
According to Maxwell.s distribution of molecular speeds, for the below graph drawn for two different samples of gases A and B al temperature T1 and T2 respectively, which of the following statements in are incorrect?
 View Solution


